Keeping Pace
with
k – 12 Online Learning
A Review of State-Level
Policy and Practice
2007
Research and writing by
John Watson and Jennifer Ryan, Evergreen Consulting Associates
Writing, editing, and guidance from
Craig Butz, Odyssey Charter Schools Pete Knopf, Illinois Virtual High School Kate Loughrey, Texas Education Agency Liz Pape, Virtual High School
Allison Powell, Clark County School District Mickey Revenaugh, Connections Academy
November 2007
Research supported by:
Additional research and writing conducted by Linda Passamaneck
of eLearning Architects. Additional support and guidance
provided by AT&T and the North American Council
for Online Learning.
®
Keeping Pace
with
k – 12 Online Learning:
A Review of State-Level
Policy and Practice
Acknowledgements
This is the fourth annual Keeping Pace report. The fi rst Keeping Pace was published in 2004, in response to a request for timely online education policy information by the Colorado Department of Education (CDE). Stevan Kalmon, then of the CDE, was a strong advocate for the report, and helped with raising funds, writing and editing. Cathy Gunn, then of Learning Point Associates, was instrumental in suggesting and overseeing publication and distribution. The four funding organizations in the fi rst year were the CDE, Illinois Virtual High School (IVHS), Learning Point Associates, and Wisconsin Virtual School. The 2004 report was a smaller effort than subsequent years, surveying 22 states and conducting in-depth research into 11 of them. In 2005 Keeping Pace expanded to review all 50 states, largely in response to the vision of Matthew Wicks of IVHS, and the 2006 report continued this broad approach.
For the 2007 report, funders are Clark County School District, Connections Academy, Florida Virtual School, Illinois Virtual High School, Odyssey Charter Schools, Texas Education Agency, and Virtual High School. In addition, the BellSouth Foundation (now AT&T) contributed funds to help with dissemination of the report.
In all four years of the report, the funding organizations have provided critically important expertise and guidance. The 2007 report is very much a collaborative effort that builds on the leadership and experience of the following people:
Craig Butz, Odyssey Charter School Kate Loughrey, Texas Education Agency Liz Pape, Virtual High School
Mickey Revenaugh, Connections Academy
Essington Wade and Allison Powell, Clark County School District Pete Knopf and Matt Wicks, Illinois Virtual High School
Julie Young, Florida Virtual School
Susan Patrick of the North American Council for Online Learning (NACOL) has contributed valuable expertise in all areas of k-12 online learning.
Another set of key contributors to the report are the people associated with an online program or education agency who gave their time to provide the information that is the basis for Keeping Pace. We have been consistently surprised by the amount of time and quality of responses we receive from people around the country. This report would not be possible without their input.
We have made every attempt to ensure accuracy of the profi les in Keeping Pace, but recognize that in a report of this breadth some errors of accuracy or omission are likely. We welcome comments, clarifi cations, and suggestions; please send them to [email protected].
Table of Contents
Executive summary . . . .6
1. Introduction . . . .10
1.1 Methodology . . . .11
1.2 How to read this report . . . .12
2. National snapshot and the year in review . . . .14
2.1 Growth of online students and programs . . . .18
2.2 State audits of online programs . . . .20
2.3 Other online learning developments in 2006-2007 . . . .22
3. Key issues . . . .25
3.1 Variations among programs . . . .25
3.2 State-led program attributes . . . .27
3.3 Geographic reach of online programs . . . .30
3.4 Student demographics . . . .31
3.5 Types of courses . . . .32
3.6 Funding online programs . . . .34
3.7 Accountability for student achievement . . . .36
3.8 Common measures: course completion and student retention . . . .39
3.9 Looking ahead: recommendations for practitioners and policymakers . . . .44
4. Program profi les . . . .48
5. Southeastern states . . . .78
6. Northeastern states . . . .90
7. Central states . . . .98
8. Western states . . . .120
Executive
Summary
Executive summary
Online learning at the k-12 level has grown so much in recent years that the main issue in most states is no longer whether or not online learning is occurring, but rather how it is being implemented. As of September 2007, 42 states have signifi cant supplemental online learning programs (in which students enrolled in physical schools take one or two courses online), or signifi cant full-time programs (in which students take most or all of their courses online), or both. Only eight states do not have either of these options, and several of these states have begun planning for online learning development. In addition to the spread of online learning programs to most states across the country, the majority of existing online programs show considerable growth in the number of students they are serving.
The increase in online learning has created countless new educational opportunities for students to take courses that were not previously available to them, in subjects ranging from core courses to electives such as Mandarin Chinese. It has allowed rural school districts to provide access to highly qualifi ed teachers in courses that the districts could not previously offer. Online learning has also allowed students and parents the fl exibility of a new
educational option.
Key fi ndings of the Keeping Pace research include:
New online programs are being developed every year, and the total number of online
programs is increasing quickly.
Myriad types of programs exist, mixing and matching among variables that include
type of governance (state-led, charter, district, etc.); amount of instruction online (fully online, hybrid); course types; student types; geographic reach; and other variables.
Promising practices, with demonstrated success, are being developed in teacher
professional development, teacher management, communication between teachers and students, data management, course development, and other areas of practice. A small number of programs have attracted attention from policymakers due to
questions about fi nances, quality, and ways in which the programs adhere to existing laws and regulations. There has been increased scrutiny of online programs,
particularly full-time programs, in a few states, and programs that do not adhere to quality standards risk creating a backlash that could impair all online programs. Data to evaluate online programs against face-to-face education are lacking, in part
because of shortcomings of state data systems and in part because online student populations are at most only 1-2% of the total.
Data to compare online programs to one another are insuffi cient because of a lack of
common measures in calculating and reporting student achievement. Major online learning program and policy developments in 2006-2007 include
Florida Virtual School, the largest online program in the country in terms of number
of unique students, had more than 100,000 course registrations, more than 90,000 course completions, and more than 50,000 students in 2006-2007.
K12, Inc., the largest operator of online schools across the country, fi led for its initial
public offering in late July. Its prospectus discusses the company’s growth, from 11,000 students in fi scal year 2005 to 27,000 in FY 2007, an annual growth rate of 35%.
The Missouri Virtual Instruction Program, an unusual state-led program in that it is
offering both elementary and high school classes, and full-time and supplemental, began operations in Fall 2007 with over 2,000 students.
State auditors in Colorado, Idaho, and Kansas released audits of online learning
programs across their respective states.
Wyoming created a distance education task force that will be reporting to the state in
Fall 2007. Wyoming does not have a state-led online learning program, nor numerous online district programs or charter schools, so the legislature has the opportunity to lay the groundwork for the development of online learning in the state.
Arkansas passed a law that allows online learning in charter schools if the schools
offer a combination of on-site and online learning.
In Arizona a bill to expand the Technology Assisted Project Based Instruction (TAPBI)
program, a pilot of 14 online district programs and charter schools, was passed by the legislature but vetoed by the Governor.
Indiana’s budget bill HB1001 stipulated that virtual charter schools would not be
funded through June of 2009.
Michigan moved ahead with implementing its requirement, passed in 2006, that all
students have an “online learning experience” before graduating.
Looking ahead
Online programs continue to grow and provide new educational opportunities for students, and state policymakers continue to be challenged to fi nd the most appropriate ways to oversee these new programs. While most programs appear to be offering a high-quality educational option for students and parents, the lack of transparency and data in many states, and questionable practices from a few programs, may threaten the sustainability of online learning for all. In light of this threat, many online programs believe that some regulation of online learning is appropriate, as long as it relies on transparency, primarily measures outcomes data instead of mandating inputs, and is fl exible enough to allow for
innovation and developing practices. Processes and outcomes of online programs that should be reviewed include:
Student achievement outcomes, including participation in state assessments
Student demographics
Curriculum development procedures
Teacher training, supervision, and evaluation, including communication
requirements
Tracking of attendance and activity in the course
Special education services.
Oversight of online programs should be fl exible and allow for innovation. State agencies overseeing online programs, for example, might provide guidelines for each category and then build reporting requirements for online programs that are tied to those standards. With the many approaches to online learning that are in place, it would not make sense to be overly prescriptive.
The Keeping Pace research demonstrates that successful, high quality online programs are being developed and delivered at many different levels, from national programs to single-district programs, as well as state-led, multi-single-district, and consortium programs. The most important variable is not the level at which the program is being offered, but whether the program is able to deliver and ensure a quality educational offering for students. By demonstrating quality outcomes, online education will continue to grow and provide educational opportunities for students and parents.
Section 1:
Introduction,
fi ndings
1
Online learning at the k-12 level has grown so much that the main issue in most states is no longer whether or not online learning is occurring, but rather how it is being implemented. As of September 2007, 42 states have signifi cant supplemental online learning programs (in which students enrolled in physical schools take one or two courses online), or signifi cant full-time programs (in which students take most or all of their courses online), or both. Moreover, several states that do not yet have large online programs, such as Wyoming and Vermont, are formally exploring online learning through the creation of distance education task forces. In addition to the spread of online learning programs to most states across the country, the majority of existing online programs show considerable growth in the number of students they are serving. Forty percent of the online programs responding to a recent survey reported annual growth of over 25% in the 2006-2007 school year, and half of these programs reported growth of 50% or higher.
The increase in online learning has created countless new educational opportunities for students to take courses that were not previously available to them, in subjects ranging from core courses to electives such as Mandarin Chinese. It has allowed rural school districts to provide access to highly qualifi ed teachers in courses that the district could not previously offer. Online learning has also allowed students and parents the fl exibility of a new educational option. Furthermore, the growth and spread of new online programs, particularly full-time online schools, has captured the attention of several states that are looking closely at how these programs attract students, teach students, and account for their spending.
For example, in December of 2006 Colorado released an audit of full-time online programs across the state. The next day, a banner headline in one of the state’s two largest newspapers proclaimed “Online Ed Slammed: state audit assails lack of oversight, blocks new schools until
system is fi xed” With the audit and subsequent publicity, policymakers, educators, parents,
and students who were previously unfamiliar with k-12 online education received a quick— although not entirely accurate—education in the policy and politics of online learning in Colorado. In May of 2007 the Colorado legislature responded to the audit by passing a law that will greatly improve oversight of online programs, and support continued growth of online learning.
Colorado was not the only state to focus attention on online learning in late 2006 and the fi rst half of 2007. Kansas and Idaho also conducted formal audits, echoing some of the concerns found by the Colorado audit, although in less depth. In other states, new programs were created or had their fi rst students; and several states passed new laws expanding (or in a couple of cases restricting) online education options.
This report is the fourth in a series of annual reports looking at the status of k-12 online education across the country. It is sponsored and guided by seven organizations with expertise in online learning: Clark County School District (Nevada), Connections Academy, Florida Virtual School, Illinois Virtual High School, Odyssey Charter Schools (Nevada), Texas Education Agency, and Virtual High School. These organizations believe that online learning benefi ts students by increasing educational opportunities, and recognize that appropriate policies and practices are required for sustainable growth.
1.1 Methodology
The information found in Keeping Pace 2007 came from two primary data-gathering efforts: the fi rst a web-based program survey, and the second a combination of Internet research and phone interviews with state education agency personnel.
The survey was designed to gather information from as many k-12 online programs as possible, including state-led programs, full-time and supplemental programs, charter schools, and district-level programs. The survey was distributed through posting on a discussion board of the North American Council for Online Learning (NACOL), by email from NACOL to many of its members, and by email directly to many programs known by Keeping Pace researchers. The survey contained extensive questions about the type of program, number of students, teachers and teaching practices, and student demographics. While many of the questions were similar to the questions asked of state-led programs in previous Keeping Pace reports, others were specifi c to full-time programs. The survey also included numerous questions to determine whether programs were tracking student demographics.1 Survey results were used in two ways: fi rst, to provide part of the data
underlying the issues analysis discussion, and second to create the program profi les in section 2. The program profi les were reviewed by the programs prior to their publication. A total of 82 surveys were completed. Because very few formal reporting requirements for online programs exist, the self-reported program survey data were not independently verifi ed against other information sources.
For state policies, Internet research and reviews of state laws were combined with interviews of education agency personnel. For states with little new activity in 2007, in many cases personnel reviewed and made minor changes to program profi les presented in Keeping Pace
2006. For the states that had passed new laws, or for which Keeping Pace had incomplete
information in 2006, the profi le was created for the fi rst time. In most cases, the state education agency reviewed the fi nal version of the profi le for accuracy.
In addition to the methods discussed above, two other sources of information were used extensively. The sponsoring organizations for Keeping Pace provided extensive expertise and knowledge of the state of online learning across the country. Their familiarity with existing research and signifi cant developments in online learning nationwide was a key source of information for this report. In addition, NACOL was an informal partner to Keeping Pace. As the leading association most familiar with nationwide k-12 online learning developments, NACOL provided valuable assistance in research and providing contacts.
1
and Dawson (2005), Virtual schools: Policy and Practice Consideration. In Berge and Clark (eds.) Virtual schools: Planning for Success. New York: TC Press.
1.2 How to read this report
The goal of Keeping Pace is to to serve as a useful document for policymakers and
practitioners, and as such, it takes a journalistic approach to research and writing. Most state and program profi les include footnotes that reference state laws, state policies, and websites of programs. However, in some cases, the information is general and was gathered through numerous website reviews and phone interviews with state agencies; in these cases footnotes are not included. The primary purpose of footnotes is to provide the source documents that will be most valuable to readers.
In a fi eld that is growing and changing as rapidly as online education, timeliness of information is imperative, and indeed timeliness has been one of the drivers of interest in
Keeping Pace. Research for this year’s report was conducted from May through August of
2007, and every effort has been made to ensure currency of information as of September 1, 2007.
This report has several goals. First, it strives to add to the body of knowledge about online education policy and make recommendations for advances. Second, it serves as a reference source for information about programs and policies across the country. Keeping
Pace attempts to be useful for both policymakers and practitioners who are new to online
education as well as those who have extensive experience in the fi eld. Third, because there has been so much online education activity in the past year, the report attempts to capture new activity. With these goals in mind, the report’s second chapter, titled National snapshot
and the year in review, captures both a picture of the state of online learning in 2007 as well
as a sense of the rate and type of changes being implemented.
Chapter three of the report discusses fi ndings categorized by key issues such as funding, teaching, and accountability, including analysis and recommendations. This analysis chapter integrates fi ndings from the program survey and the state profi les research.
Chapter four presents 25 program profi les. Unlike previous Keeping Pace reports, the program profi les are not limited to state-led programs. Instead the profi les capture a cross-section of program types, including state-led and district-led, supplemental and full-time, charter schools, and both synchronous and asynchronous programs.
Chapters fi ve through eight present state profi les of more than 40 states, divided into southeastern, northeastern, central, and western regions.
Although presented fi rst, the key issues chapter of the document builds on the program and state profi les presented later in the report. The state profi les contain most of the footnotes and references to source documents.
Defi nitions
For simplicity, Keeping Pace draws a distinction between supplemental programs and full-time programs. The distinction is not precise, because a few supplemental programs have some full-time students, and programs that fall into the full-time category have some part-time students. Although not exact, the distinction is important because students in supplemental programs are enrolled in a school separate from the online program, while students in full-time programs are enrolled only in the online school. In addition,
Full-time programs typically are responsible for
these students’ scores on state assessments required by No Child Left Behind, which is the primary way in which student outcomes, and school performance, are measured; and Public education funding which follows the
student fl ows to full-time online programs, unlike most supplemental programs that are funded by other means. (Florida Virtual School is an exception in that FLVS receives public education funding.)
The way in which Keeping Pace counts student numbers for full-time programs and supplemental programs is fundamentally different. For
supplemental programs we count course registrations—one student in one semester-long course—while in full-time programs we count
enrollments, defi ned as one year-long full-time equivalent (FTE) student.
Other terms used in this report are defi ned as:
State-led online programs are created by legislation or by a state-level agency, and/or administered by a state education agency, and/or directly funded by a state appropriation or grant for the purpose of providing online learning opportunities across the state. State-led programs are typically supplemental, offering courses for students who are otherwise enrolled in a traditional school setting. Examples of state-led online programs include the Illinois Virtual High School, Kentucky Virtual High School, and Michigan Virtual School.
Because online programs evolve, some programs are categorized as state-led that do not fi t the defi nition presently, but did in important stages of their development. Florida Virtual School, for example, is now independent and funded via the state’s full-time equivalent (FTE) public education funding, but previously received funding via legislative appropriation.
State-led online initiatives are different from online programs in that initiatives typically offer online tools and resources for schools across the state, including aggregating courses from outside sources, instead of developing and offering their own courses that are taught by teachers that they have hired. Examples include the Washington Digital Learning Commons, Oregon Virtual School District, and Massachusetts Online Network for Education (MassONE).
Full-time online programs, sometimes called cyberschools, are online learning programs in which students enroll and earn credit towards academic advancement based on successful completion of the courses (or other designated learning opportunities) provided by the online school. Many full-time online schools are charter schools.
Some states draw a distinction between single-district programs, which serve students who reside within the district that is providing the online courses, and multi-district programs, which serve students from multiple districts. Multi-district programs may be state-led, run by a consortium
or network, or operated by one district offering an online program to students from other districts.
State-level policies, including legislation, education code, and formal rules promulgated by the state education agency, are a main focus of the state profi les. This report is primarily interested in policies that were created to address online learning in its various forms, but also includes policies that were created for brick-and-mortar schools, or other types of distance learning, that are used to regulate online learning in the absence of specifi c online policy.
Creating a snapshot of the national landscape is a challenge because there are so many types of online programs and categorizing them is diffi cult. Within these limitations, this chapter provides several different views of summary data that focus primarily on supplemental
multi-district programs and full-time multi-district programs. State-led programs, a
common type of multi-district program that is usually supplemental, are also broken out in the summaries below.
The focus on multi-district programs, instead of single-district programs, is based on two factors. First, multi-district programs tend to be larger, to have better-developed policies and practices, and to create more policy implications than single-district programs. Second, very few data are available for single district programs. The division between supplemental and full-time programs is consistent with the way students think about their online experience, as a single course or as the main source of their education. Also, many issues of policy and practice are tied to whether the online program is supplemental or full-time. It is important to note that the distinction between full-time and supplemental programs is blurring, as discussed in chapter 3.
In most states, the main supplemental offering is a state-led program or initiative. In a few states (Nevada, Wisconsin, Montana, Indiana, Kansas, and Minnesota), there are signifi cant district-led supplemental programs offered across districts. Three New England states— Massachusetts, Connecticut, and New Hampshire—have signifi cant numbers of students taking supplemental online courses through Massachusetts-based Virtual High School. Also, in most states, many full-time, multi-district online schools are charter schools. Only one state without charter schools, Washington, has a signifi cant number of full-time, multi-district programs.
In summary, as of September 2007, 42 states have signifi cant supplemental online learning programs, signifi cant full-time programs, or both. Only eight states do not have either of these options, and several of these states have begun planning for online learning
National snapshot and the year
in review
2
2
In 38 states, most pro-grams are state-led but some are district-led. In several New England states the primary supplemental program is Virtual High School, located in Massachusetts.
In 18 states, mostly online charter schools
Unknown number of programs because of very limited reporting. In many cases course vendors or other online programs provide courses to the district. Distinction between a small number of online courses and a program is unclear. Multi-district Single-district Full-time Supplemental Geographic Reach Pr ogram T ype
Breaking this down into the supplemental and full-time categories:
38 states have signifi cant supplemental, multi-district online programs or initiatives,
including 30 states with state-led programs or initiatives. 18 states have signifi cant full-time, multi-district programs.
14 states have both signifi cant supplemental, multi-district online programs/
initiatives, and signifi cant full-time, multi-district programs. 8 states have neither.
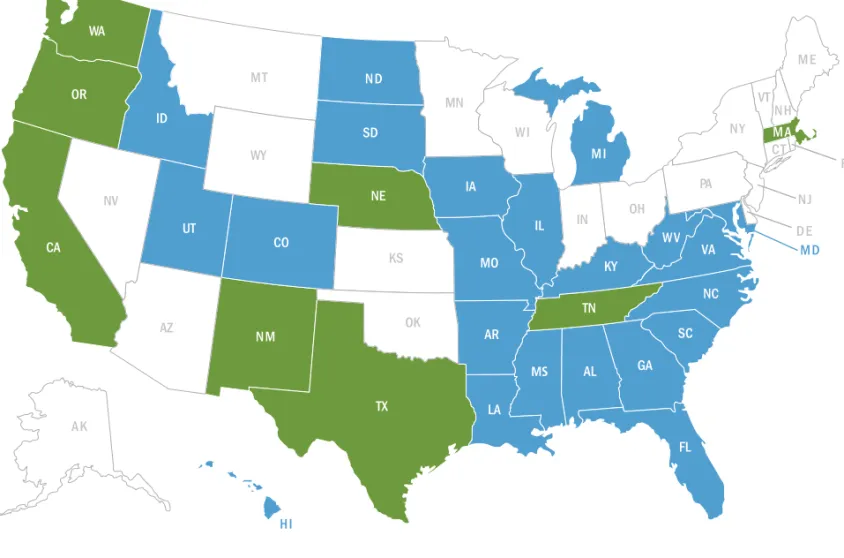
National Summary
N H CA OR WA VT UT AZ CO TX SD NE KS MN IA MO AR LA AL GA SC NC TN KY IL IN OH PA W V VA M D C T M A M I FL W I ID NV N M D E R I M T N D H I A K MS N Y M E N J WY OKStates with signifi cant supplemental state-led or multi-district online programs or initiatives
States with signifi cant full-time, multi-district programs
States with both
States with neither
As discussed above, state-led programs and initiatives comprise most of the signifi cant supplemental programs. There are 30 states with state-led programs or initiatives, including states with programs in development stages. These include programs such as the Florida Virtual School, Michigan Virtual School, and Illinois Virtual High School, and initiatives such as the Washington Digital Learning Commons and Nebraska Distance Education Council. (See Figure 2: States with state-led programs and initiatives. Also see defi nitions in chapter 1 for further explanation on the difference between state-led programs and state-led initiatives.)
States with a state-led program that meets the Keeping Pace defi nition and registers students into courses (includes programs that met this defi nition in earlier stages)
States with state-led initiatives that provide online learning opportunities across the state but do not register students into courses
States with state-led programs and initiatives
N H CA OR WA VT UT CO TX SD NE IA MO AR LA AL GA SC NC TN KY IL W V VA M D N J C T M E M A M I FL ID N M D E R I M T N D H I A K MS WY AZ NV KS OK MN IN OH PA N Y W I
N H M D N J C T M E M A D E R I
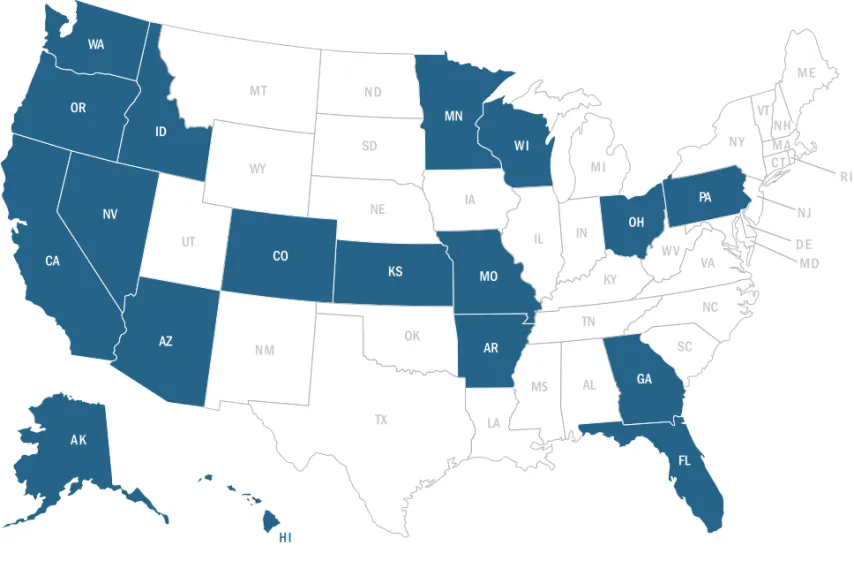
Finally, 18 states have full-time, multi-district online schools. States with the largest number of students in these programs include Ohio, Pennsylvania, and Minnesota. (See Figure 3: States with full-time, multi-district online programs.)
States with signifi cant full-time, multi-district charter schools or district programs
States without signifi cant full-time, multi-district charter schools or district programs
CA OR WA VT UT AZ CO TX SD NE KS OK MN IA MO AR LA AL GA SC NC TN KY IL IN OH PA W V VA M D N J C T M E M A N Y M I FL W I WY ID NV N M D E R I M T N D H I A K * N H MS *
States with full-time, multi-district online programs
Figure 3: States with full-time, district online programs. In most states that have full-time, multi-district programs, these programs are charter schools (though Missouri is unusual in that its full-time, multi-district program is state-led). States that do not have full-time, multi-district programs typically have one or more of the following attributes: they do not have a charter school law (10 states), they have either a law or precedent that does not allow online charter schools or makes them diffi cult to operate (about 5 states, depending on the defi nition used), or they do not allow students to choose schools outside of their district of residence. In about 15 states there does not appear to be a reason why online charter schools do not exist, but none have yet been created, perhaps in part because of reluctance of charter school authorizers.
2 .1 Growth of online students and programs
The Keeping Pace research demonstrates the rapid growth of online education in two ways:
growth of student numbers in existing programs, and new programs being developed and enrolling or registering students for the first time.
2 .1 .1 Growth of existing programs
The Keeping Pace survey results demonstrated that many online programs are growing
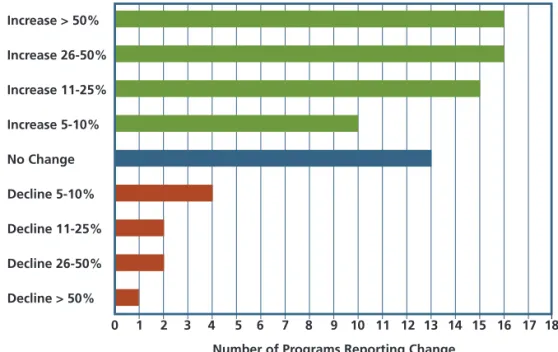
rapidly, while only a few are declining. Indeed, 20% of all programs responding to the survey reported growth of more than 50% between the 2005-2006 and 2006-2007 school years, and 40% reported growth of 25% or higher. The fact that 11% of programs reported a decline, and 16% reported no change (defined in the survey as enrollments or registrations staying within 5% of the previous year), suggests that the growth is not entirely across the parents, and educators. Also notable is that many of the programs reporting significant growth were among the largest programs in the survey; for example, Florida Virtual School reported growth of more than 25%. This demonstrates that the large percentage increases are not merely based on small programs adding a relatively small number of students.
0 1 2 3 4 5 6 7 8 9 10 11 12 13 14 15 16 17 18 Increase > 50% Increase 26-50% Increase 11-25% Increase 5-10% No Change Decline 5-10% Decline 11-25% Decline 26-50% Decline > 50%
Number of Programs Reporting Change
Figure 4: Number of programs reporting percent change in number of course registrations (for supplemental programs) and enrolled students (for full-time programs) between school years 2005-2006 and 2005-2006-2007. One program reported a decline of 50% or higher, 13 programs reported no change, and 16 programs reported increases of 50% or more.
At the state level, the Minnesota Department of Education (MDE) reported an increase of 52% in the number of students taking one or more courses online between the 2005-2006 and 2006-2007 school years in programs certified by the MDE. (Single-district programs are not required to report.) Most of this growth occurred as students taking supplemental board, but is tied to some combination of funding, quality, and awareness among students,
courses.2 The Kansas audit of online programs counted an increase in total FTE of 38% from
2005-2006 to 2006-2007, and a total increase of 123% between 2004-2005 and 2006-2007.3
2 .1 .2 Growth in number of new programs
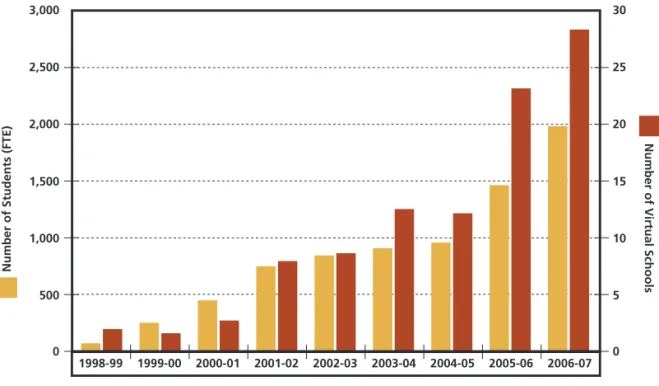
Because only a few states track online programs, the total number of programs is unknown, yet the number appears to be growing because new programs are being created every year, and very few, if any, are known to have closed. Data from the few states that track online programs demonstrate the growth in the number of programs, for example, Figure 5 from the Kansas state audit.
1998-99 1999-00 2000-01 2001-02 2002-03 2003-04 2004-05 2005-06 2006-07 2,500 30 25 20 15 10 5 0 2,000 1,500 1,000 500 0
Number of Virtual Schools
Number of Students (FTE)
3,000
Figure 5: Program and student growth in online programs in Kansas. Source: Kansas audit of online programs.
The Keeping Pace survey response included 10 programs that have opened since Fall 2006,
or 12% of all responses. These include the Missouri Virtual Instruction Program (MoVIP), Chicago Virtual Public School, Nevada Virtual Academy, and the North Carolina Virtual Public School. The survey asked programs in what year they started, and the results show new programs have come online in each of the last several years—including every Fall semester from 1998 to 2007, and most Spring and Summer semesters of those years— suggesting steady growth over time.
2 Karen Johnson, Minnesota Department of Education, personal communication, August 6, 2007 3
2.2 State audits of online programs
One of the signifi cant developments in late 2006 and 2007 was the release of audits of full-time online programs by three states: Colorado, Idaho, and Kansas.
Colorado was the fi rst state to release its audit, in December of 2006. The report questioned the practices of several full-time online programs and the oversight capability of the
Colorado Department of Education. The Trujillo Commission, formed in response to the audit, captured the audit’s fi ndings in its report:
“Auditors found that state oversight of online programs was lacking in numerous ways. Auditors reported that the Colorado Department of Education… did not effectively use the ac creditation process to maintain oversight of school districts. Some school districts did not use their own accreditation processes. In some instances chartering processes were not effectively used to maintain adequate oversight of online programs… [and] individual schools did not maintain adequate oversight of their own program.”
The state Board of Education also created a task force to respond to the audit’s fi ndings; both the task force and the Trujillo Commission suggested recommendations for legislators. In response, the legislature passed Senate Bill 215, which made numerous changes to online education regulations. The new law in Colorado is among the most comprehensive online education oversight laws in any state. The key elements, among many details of the bill, are
Creation of an online division within the Colorado Department of Education (CDE)
that will oversee online programs, primarily through oversight of district authorizers plus regular reporting by the programs themselves.
A requirement that the online division and state Board of Education create quality
standards for online programs; and that the state board consider including the quality standards in accreditation requirements.
A distinction between multi-district online programs and single-district programs.
While both types of programs must submit an annual report to CDE, the multi-district online programs are subject to greater oversight because the authorizers of multi-district programs must be certifi ed by the state as demonstrating the capacity to run an online program.
A requirement that online programs that use physical facilities in which students
meet formally as part of their schooling enter into a memorandum of understanding with the school district in which each physical facility is located.
Removal of the existing prohibition on funding online students who were not public
school students in the prior year, as of June 2008.
A requirement that all online programs report annually to the state.
Idaho released a shorter audit of online programs in March of 2007. The audit discusses how online charter schools are recognized and defi ned in charter school law, and the lack of any similar defi nition or recognition of online programs that are not charter schools. It states:
“Virtual charter schools in Idaho operate under a framework of state laws, rules, and other oversight mechanisms. Virtual schools are not required to comply with most
rules made by the State Board of Education, but must comply with the general education laws of the state and the rules and laws that specifi cally apply to charter schools. Initial oversight of virtual schools occurs throughout the petition approval process. The Public Charter School Commission and the state accreditation process provide some ongoing oversight of virtual schools in operation. However, neither the
approval nor oversight processes address key areas related to virtual education: curriculum development, delivery of instruction, and student-teacher contact.”4 (Italics added)
In addition to charter school requirements, Idaho’s online schools are required to be
accredited according to standards developed by the state or by the Northwest Association of Accredited Schools. However, no accreditation requirements specifi c to online schools exist. The audit also says:
“Current statutory defi nitions do not adequately consider the design of virtual schools, nor do they provide specifi c information related to development of curriculum, how instruction will be delivered to a student, and the frequency of contact between teachers and students. As a result… virtual schools vary widely in these three key areas of operations.”5
The audit report concludes with several recommendations, including defi ning virtual public schools, requiring that all online charter schools be authorized by the Public Charter School Commission, and requiring all online schools to report annually. As of July 2007 the
legislature has not passed any new laws in response to the audit.
Both Colorado and Idaho have state-led, supplemental programs that were not studied by the auditors. Colorado Online Learning and the Idaho Digital Learning Academy do not have full-time students and are not “schools” according to the federal defi nition; for these and other reasons they were not part of the audits. However, while the funding issues are different for state-led programs compared to full-time programs, many of the other issues, such as accountability, quality of courses, and hiring and managing teachers, are similar. Kansas, the third state in which an audit has been released recently, does not have a state-led program, but does have 35 online programs operated by school districts and educational service centers across the state.6 Unlike Colorado and Idaho, neither of which had strong
online education policies prior to the audits, Kansas did have policies requiring online programs to report to the state Department of Education, and tied funding of online
students to this reporting. However, the state education agency did not follow through with its policies, according to the audit:
“The Department has established comprehensive policies and procedures to provide general oversight of virtual schools. These include policies on funding, teaching and curriculum standards, accountability for student achievement, equity and access, and annual reporting requirements. In 2005-06, these policies and procedures were recognized as some of the strongest in the country. However, Kansas’ actual oversight of virtual schools is weak because the Department often hasn’t carried out the policies it has established.”7
4 Offi ce of Performance Evaluations, Idaho Legislature, Virual School Operations Education Report, March 2007, p. 15 5 Ibid, p. 25
6 The State Audit listed 28 online programs but more have been added since the release of the audit.
7 Legislative Division of Post Audit, State of Kansas, K-12 Education: Reviewing Issues Related to Virtual Schools, April 2007;
While each of the three states that conducted an audit has some state-specifi c issues, several general lessons for online programs emerge from the fi ndings. The primary lesson is the ongoing need for quality assurance of both courses and instruction—not only to ensure quality for students, but also to demonstrate quality to other stakeholders. It is likely that these audits are the beginning of greater scrutiny of online programs by states and
policymakers. With greater analysis comes the opportunity to prove that online learning works, and to demonstrate how online programs are increasing educational opportunities for students across the country.
2.3 Other online learning developments
in 2006-2007
Major online learning program and policy developments include:
Florida Virtual School, the largest online program in the country in terms of number
of unique students, had more than 100,000 course registrations, more than 90,000 course completions, and more than 50,000 students in 2006-2007.
K12, Inc., the largest operator of online schools across the country—mostly charter
schools—fi led for its initial public offering in late July. Its prospectus discusses the company’s growth, from 11,000 students in fi scal year 2005 to 27,000 in FY 2007, a compound annual growth rate of 35%. The company’s revenue in FY 2006 was $116.9 million.8
The Missouri Virtual Instruction Program, an unusual state-led program in that it is
offering both elementary and high school classes, full-time and supplemental, began operations in Fall 2007 with over 2,000 students.
Minnesota passed a law to implement several changes to its online learning
requirements. The law was amended to:
Defi ne “supplemental online learning” as an online course taken in place
of a course period during the regular school day at a local district school and “full time online learning provider” as an enrolling school authorized by the department to deliver comprehensive public education.
Specify that online learning providers of supplemental courses must make
available to the enrolling district the course syllabus, standards alignment, content outline, assessment requirements and contact information.
Delete the student online learning enrollment maximum of 12 semester
credits per year and add a supplemental online learning enrollment limit of 50% of the student’s full schedule unless agreed upon by enrolling district. Change the requirement that online learning providers “affi rm” to the
commissioner that online learning courses have equivalent standards or
instruction, curriculum and assessment requirements as other courses
offered to enrolled students, to the requirement that providers “demonstrate” these qualities.
North Dakota passed a law requiring the state Department of Public Instruction to
create an approval process for online courses being provided from out of state (but not between schools in North Dakota.) Notably, the law states that all teachers must “meet or exceed the qualifi cations and licensure requirements placed on the teachers by the state in which the course originates” meaning that teachers do not have to be certifi ed in North Dakota. This law is signifi cant because state certifi cation of teachers remains a stumbling block for many programs operating across state lines.
Wyoming created a distance education task force which met during Summer 2007
and will be reporting to the state in Fall 2007, with the expectation that the state legislature may address online learning in 2008. Wyoming does not have a state-led online learning program, nor numerous online district programs or charter schools, so the legislature has the opportunity to lay the groundwork for the development of online learning in the state.
Arkansas passed HB 2481, which allows online learning in charter schools and district
programs if they are “blended,” meaning “students receive curriculum instruction on-site for a designated period of time and receive instruction in a virtual or remote setting via Internet-based curriculum.” The law requires that the state board establish rules for approving online curriculum and providers; as of August 2007 these rules have not been created.
In Arizona a bill to expand the Technology Assisted Project Based Instruction (TAPBI)
program, a pilot of 14 online district programs and charter schools, was passed by the legislature but vetoed by the Governor. Governor Janet Napolitano said that the results of a review of TAPBI, due in November 2007, should be considered before expanding the program.9
Indiana’s budget bill HB1001 stipulated that virtual charter schools would not be
funded through June 2009: “A virtual charter school is not entitled to any funding from the state of Indiana during the biennium and is not entitled to a distribution of property taxes.”
The Pennsylvania Department of Education joined several state legislators in calling
for a standard funding rate for online charter schools, possibly one that would be lower than the rate for physical charter schools or traditional schools.10
Finally, Michigan moved ahead with implementing its requirement, passed in 2006, that all students have an “online learning experience” before graduating. The Michigan Department of Education released its guidelines for the Michigan Merit Curriculum. The guidelines for online learning require that students:
9 Arizona State Board for Charter Schools, Board Briefs, Volume V, Issue VI, June 11, 2007 10 www.pdenewsroom/cwp.view.asp?Q=128768&A=3
“Take an online course, or
Participate in an online experience, or
Participate in online experiences incorporated into each of the required credit courses
of the Michigan Merit Curriculum.”
The guidelines go on to explain options for the “online learning experience” and require that the “meaningful online experience requires a minimum accumulation of twenty hours… for students to become profi cient in using technology tools to virtually explore content.”
3
Key Issues
The following chapter discusses key issues in online learning using two main sources of data: the Keeping Pace web-based survey of online programs, and the review of state policies that are detailed in the state profi les in chapters 5 through 8.
3.1 Variations among programs
Online education is provided in a nearly endless variety of program types. Variables include the program organizational type and governance, the geographic area from which students are drawn, whether the program is full-time or supplemental, and whether courses are synchronous or asynchronous.11 Categories of programs aren’t perfectly delineated, but
identifying a few of the major ones is valuable. They include:
State-led programs: This is a well-known category because in many states the state-led
program is the highest profi le online program. Examples include the Florida Virtual School, Illinois Virtual High School, Michigan Virtual School, and Idaho Digital Learning Academy. Attributes of state-led programs are discussed in section 3.2 below. State-led initiatives provide courses and/or online tools, resources, and services but
are different than the programs in the fi rst category. Different types of state-led online learning initiatives have developed in recent years, with a number of states recognizing the value of providing online learning opportunities, but choosing a different model than the programs described above. Examples include the
Massachusetts Online Network for Education (MassONE), the Washington Digital Learning Commons (DLC), and the Oregon Virtual School District. They are different than the state-led programs, such as the virtual schools in Florida, Illinois, Michigan, and Kentucky, in that the latter programs all have their own courses (although some may be licensed), and their own teachers (although they may be part-time, adjunct teachers). The state-led initiatives may be better described as providers of online tools and resources and aggregators of online courses, although no single defi nition
describes them all.
Charter schools are a type of public school available in the 40 states that have passed
charter school laws. Charter schools have an authorizer who may be (depending on the state) a school district, a university, or a state-wide authorizer created for that purpose. There are two types of charter schools related to online learning: fully online
11 Gregg Vanourek, “A Primer on Virtual Charter Schools: Mapping the Electronic Frontier,” National Association of Charter School
charter schools, which were created to be primarily or entirely distance education programs, and charter schools that are partially online and partially face-to-face. District online programs are, as the name implies, run by school districts. Although a
district may authorize a charter school, in this report the term “district-run program” does not include charter schools. District programs may be single-district, meaning that the program serves only students who reside within the district, or multi-district, meaning that the program attracts students from districts other than the one that has created the online program. This is an important distinction that is recognized in policy and oversight mechanisms in Minnesota and Colorado.
Consortium or network programs are a fi nal, catch-all category. Examples include the
Virtual High School Global Consortium, Wisconsin eSchool Network, and
Connecticut Adult Virtual High School. These programs recognize that there is value in economies of scale, in combining resources to create online courses, train teachers, and provide student support, and are demonstrating that such programs do not necessarily have to be run at a state level or by a state education agency.
3.1.1 Online program categories are becoming less distinct
Although the categories discussed above are important, they are blurring in several ways: Grade levels served by programs are overlapping
: In the program survey, 38% of programs offered courses to elementary students (k-5 or k-6), 62% offered courses to middle school students (grades 6-8 or 7-8), and 85% offered courses to high school students (grades 9-12). Clearly, many programs offer a wider variety of grade levels than just elementary, middle, or high school grades. Eighteen respondents said they serve elementary, middle, and high school students; almost all of these are full-time programs and at least some of them started at the elementary level and have
expanded to the upper grade levels. State-led and supplemental programs are most likely to serve only high school students, but a signifi cant number of these programs are expanding to middle school grades.
The distinction between supplemental and full-time is blurring
: About a third of the
programs that identifi ed themselves as supplemental had at least some full-time students. In some cases the full-time students come from a set population; both the Georgia Virtual School and Illinois Virtual High School said their full-time students are primarily or entirely hospitalized or homebound. Conversely, a number of the full-time programs are expanding to serve supplemental students as well. In Minnesota, which does not have a state-led program, most of the growth in the number of online students in the last year has been among supplemental students. The distinction between online and face-to-face is blurring
: Several types of blending
between online and face-to-face teaching exist. One example is teachers in physical classrooms incorporating online tools such as discussion forums or online
assessments to extend learning for their students. Another form of blended learning occurs when primary instruction is delivered online, with the occasional face-to-face meeting between teachers and students. These meetings can be at the beginning of the course or throughout the semester. For example, Odyssey Charter School has its online students meet face-to-face with teachers weekly, and in 2007 Arkansas passed a
law requiring that online learning for elementary students combine online and face-to-face instruction.
Another model combining online and face-to-face has students regularly access their online course from a physical facility and have access to a mentor or facilitator at that facility. A version of this approach is common among the state-led supplemental programs working with local schools. When this method is applied to a full-time online school that creates the physical setting for students, there may be signifi cant policy implications because the online program may create the physical setting, which looks very much like a school, within another school district. One example is Hope Online Learning Academy Co-op, the second largest online program in
Colorado with 1,520 full-time students in school year 2005-2006. Hope students meet every day in learning centers operated by the school, where they take online courses under the supervision of a mentor. The licensed teacher of record for each course interacts with students online.
The approach of having students in a full-time program meeting at a physical location is not common, and perhaps it will remain an anomaly. In the program survey only 11 respondents (13%) said they bring students together in a physical location more than once per week, and the comments in response to the question suggest that some of the programs that said yes may not actually get together as often as once per week.
3.2 State-led program attributes
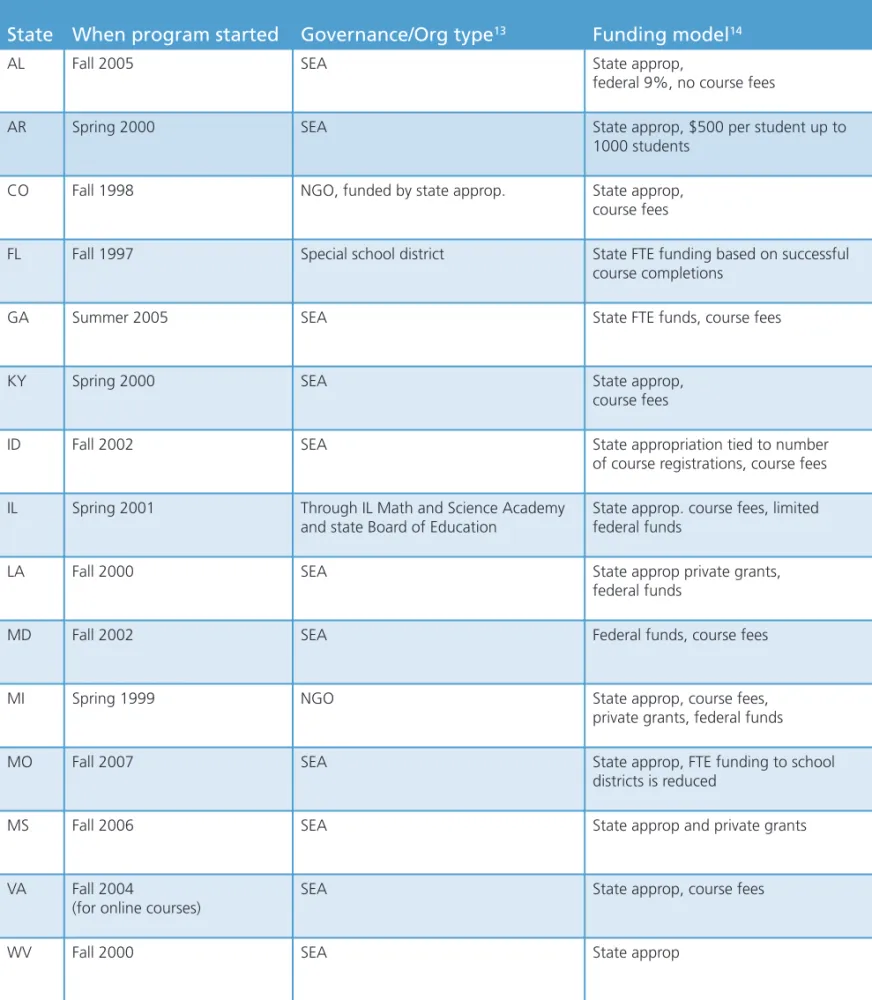
State-led programs and initiatives are an important type of program, because in many states the state-led program is the main driver of online education. These programs have in common that they were created, funded, or implemented by the state or a state agency. They are usually mostly or entirely supplemental, serve mostly or entirely high school students (some have a small number of middle school students), and typically work with local schools who grant course credit and award diplomas. They may license or develop their courses, or a combination of both. They hire teachers either full-time, part-time, or a combination of both. They are usually funded by state appropriations that are independent of the number of course registrations they have, and they often charge course fees. These and other program attributes are detailed in Table 1 below. (The table does not include all state-led programs due to space constraints.)
Table 1: Summary of key attributes of state-led programs
12State When program started Governance/Org type13 Funding model14
AL Fall 2005 SEA State approp,
federal 9%, no course fees
AR Spring 2000 SEA State approp, $500 per student up to 1000 students
CO Fall 1998 NGO, funded by state approp. State approp, course fees
FL Fall 1997 Special school district State FTE funding based on successful course completions
GA Summer 2005 SEA State FTE funds, course fees KY Spring 2000 SEA State approp,
course fees
ID Fall 2002 SEA State appropriation tied to number of course registrations, course fees IL Spring 2001 Through IL Math and Science Academy
and state Board of Education
State approp. course fees, limited federal funds
LA Fall 2000 SEA State approp private grants, federal funds
MD Fall 2002 SEA Federal funds, course fees MI Spring 1999 NGO State approp, course fees,
private grants, federal funds MO Fall 2007 SEA State approp, FTE funding to school
districts is reduced
MS Fall 2006 SEA State approp and private grants VA Fall 2004
(for online courses)
SEA State approp, course fees WV Fall 2000 SEA State approp
12 Most of the data are based on the Keeping Pace program survey, and some additional data are based on the Southern Regional Education Board’s Report
on State Virtual Schools, August 2007.
13 Governance/Organization type: SEA means state education agency and NGO means non-profi t, non-governmental organization
# course registrations15
Full-time
students? Grades served
# courses/ % licensed Enrollment types16 # teachers17 7,000 No 9-12 44, 50% Set dates 133 pt 3,850 ND18 9-12 35, ND Set dates 23 pt, 6 ft 1,227 No 6-12 68; 10% Set dates 32 pt 100,000 Less than 5% 6-12 90; 3% Self-paced 320 ft; 175 pt 4,300 Only hospital/
homebound
6-12
(courses are 9-12)
78; 0% Rolling start dates, set end dates
120 pt 1,350 ND 6-12 78 ND 48 pt 3,682 Very few 7-12 85, 1% Set dates 65 pt 2,750 Very few, mostly
homebound
6-12 114, 42% Set dates 75 pt 5,605 No 6-12 36, 0% Set dates 16 ft, 41 pt About 1,000 No 7-12, courses are 9-12 43, 90% Self-paced and
set dates 0 ft, 11 pt 8,587 No 6-12 264, 67% Self-paced and set dates 100 pt About 13,000 (in Fall 2007)
Yes, a signifi cant number K-5 and 9-12 (6-8 to be added in 2008-09) 100% licensed Self-paced ND 3,000 No 9-12 27, 100 % Set dates 0 ft, 73 pt 4,416 ND 6-12 31, 50% Set dates 18 ft, 16 pt Between 2,000 and 3,000 No 6-12 158, 98% Self-paced and set dates 2 ft, 17 pt
15 # course registrations is from summer 2006 through spring 2007. One course registration is one student taking one semester-long course. Because
state-led programs are primarily supplemental, the number of course registrations is typically in the range of 20-35% higher than the number of unique students.
16 Options are self-paced or with one or more set start and end dates 17 PT=part-time, FT=full-time
3 .3 Geographic reach of online programs
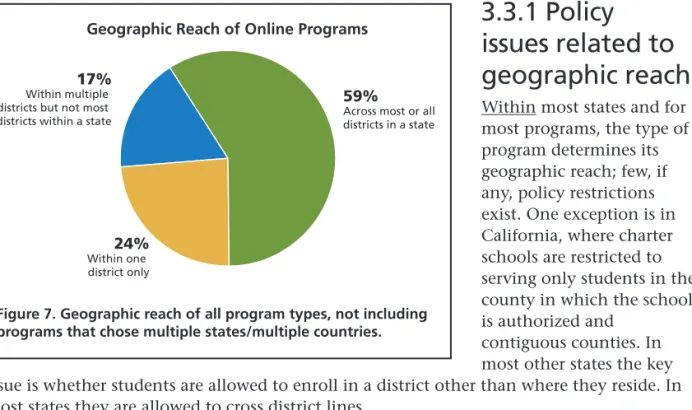
One main reason that online programs (all programs, not just state-led) are challenging education policy is that many policies do not anticipate schools that operate across an entire state, or beyond. The program survey results demonstrate that many programs are doing so, as shown in Figure 7. In addition to these programs, 10% of programs said they operate across multiple states, and 8% operate across multiple countries.20
The breakdown of geographic reach by program type reveals that 15 of 19 online charter schools operate statewide, and only 4 of 22 district programs operate statewide. Not surprisingly, state-led programs operate across their states, and in some cases beyond.
Geographic Reach of Online Programs
59%
Across most or all districts in a state
17%
Within multiple districts but not most districts within a state
24%
Within one district only
Figure 7. Geographic reach of all program types, not including programs that chose multiple states/multiple countries.
3 .3 .1 Policy
issues related to
geographic reach
Within most states and for most programs, the type of program determines its geographic reach; few, if any, policy restrictions exist. One exception is in California, where charter schools are restricted to serving only students in the county in which the school is authorized and
contiguous counties. In most other states the key issue is whether students are allowed to enroll in a district other than where they reside. In most states they are allowed to cross district lines.
Funding issues are tied to geographic reach in states in which funding differs by location. These states must decide whether online students are funded at the rate of their “home” district, where they reside; at the rate of the district in which the program is located; or at some other rate that may be specific to charter schools, to online programs, or to online charter schools.
Across states there are policy barriers related to geographic reach. The main one is the requirement that the online teacher be certified in the state in which the program and/or student resides. Although some states have provisions to recognize teacher certifications in other states, procedures to recognize certifications across states can be cumbersome. In North Dakota, a law passed in 2007 recognizes that online teachers may be from out of state and requires that online teachers “meet or exceed the qualifications and licensure
requirements placed on the teachers by the state in which the course originates.”
20
3 .4 Student demographics
There is a lingering perception that most students in online programs are honors or Advanced Placement students. The data in the program survey do not support this view, as 81% of responses from programs with high school level courses reported that 15% or fewer of their course registrations were for AP courses. Only 9% reported that more than 45% of their course registrations were for AP courses.21
Conversely, the survey also asked each program the percentage of course registrations for credit recovery classes. The number of programs responding was low, and 22% of the respondents said they did not know. Of the ones who did know, 59% had 15% or less of their course registrations in credit recovery courses, while nearly one third (31%) had 31% or more in credit recovery.
For supplemental programs, which register students who are enrolled in another school, tracking student types and reasons that students are taking online courses is often beyond their data-tracking capability. AP course registrations are an exception to this, because Advanced Placement is a formal designation that is tied to the course, not to the student; therefore every student in an AP course is by default an AP student. With credit recovery in most cases the designation is tied to the student, not to the course, and for most
supplemental programs the only way to know if the student is a credit recovery student is if the student or administrator at the student’s home school communicates this to the online program. An exception to this rule is supplemental programs offering online courses in summer that are explicitly for credit recovery.
Beyond credit recovery and AP courses, there are relatively limited student demographic data in online courses and programs, even among the few states that track online programs. Tracking demographics nationally is made more challenging by a lack of common measures. For example, the term “at-risk” is commonly used, but there is no single definition at the national level or even among some states. The Colorado audit of online programs noted that although programs often reported a certain percentage of at-risk students, the method of measuring at-risk was not consistent among programs.
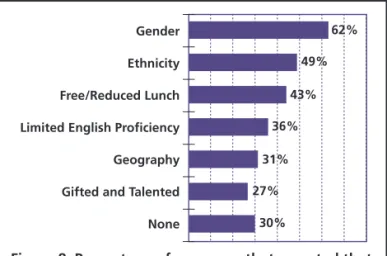
Figure 8: Percentage of programs that reported that they track each of the above demographic variables. Geography typically refers to whether students are from urban, suburban, or rural regions.
Gender
Ethnicity
Free/Reduced Lunch
Limited English Proficiency
Geography
Gifted and Talented
None 62% 49% 43% 36% 31% 27% 30%
Despite the lack of common definitions for some terms, having programs track demographics of their own students is a starting point to tracking demographics at the state or national level. The Keeping Pace survey asked programs what
demographics they record. The only demographic tracked by more than half the programs was gender; the rates of other demographic measures are shown in Figure 8 to the left.
The Keeping Pace survey was not large
enough to extrapolate to national online student demographic
21 The survey asked for percentage of students who took the AP exam and how well those students did on the exam. However,
because the number of programs reporting significant numbers of AP course registrations was low, and because about 1/3 of these programs did not have information on the percentage of their students who took the AP exam or their students’ AP exam scores,
numbers, but the results clearly demonstrate that online learning is not limited to middle class, Caucasian students, as is sometimes believed. The sixteen programs that reported free and reduced lunch data collectively had 35% of their students eligible for free or reduced lunch, with a range from 3% to 53%. Student ethnicity across all reporting programs was about 73% Caucasian, 12% African-American, and 7% Hispanic, with the remainder split between Native American, Asian/Pacifi c Islander, multi-racial, or “other.” These data must be considered approximate because they were self-reported, and because only 20 programs reported ethnic data in a way that could be tabulated. Still, the data demonstrate that online programs and courses are being chosen by a variety of students. Perhaps not surprisingly, the few programs that reported data on students of limited English profi ciency had very few LEP students.
Some supplemental state-led programs track demographics not in terms of individual students, but by the demographics of the schools in which the students are enrolled. In Illinois, for example, schools that have at least 25% free and reduced lunch students qualify for free course registrations at the Illinois Virtual High School on a sliding scale in which schools with a higher percentage of free and reduced lunch students receive more free course registrations. In 2006-2007, 50% of course registrations at IVHS were from schools that qualifi ed for scholarships. Similarly, Florida Virtual School reported that 24% of students come from high minority schools and 18% from low performing schools.
3.5 Types of courses
Online courses may be real-time or asynchronous, may be self-paced or on a set schedule with a start and end date, and may be developed by the online school or licensed from an outside source. In each of these areas, the survey found that:
Most programs (65%, or 50 out of 77) use asynchronous courses primarily or entirely;
31% of programs use a mix of both real-time and asynchronous, and only 4% use synchronous courses primarily.
For course pacing, 39% of programs have courses with set start and end dates to
allow students to proceed through the course as a cohort. This includes supplemental programs that have more than one start and end date to accommodate different school schedules across a state. One-quarter of reporting programs have courses that are self-paced, and 36% offer both types of courses. At least one program with students in grades k-12 reported that the high school courses have set dates, and the elementary level courses are self-paced. This makes sense because high school students spend a greater proportion of their time online, so having a cohort of students to allow communication among students is more important at the older grade levels.
Online programs license anywhere from none to all of their courses from outside
providers, with no apparent tendencies among the 60 programs that responded to this question. Indeed, the symmetry among the percentages of courses being licensed versus being developed in-house is remarkable. Fourteen programs (23%) had licensed 100% of their courses, and 14 programs had developed 100% of their courses. Thirty-two programs (53%) had licensed 50% or more of their courses, while 33 programs (55%) had licensed 50% or less of their courses.