| 1
Acknowledgement and Study Contributors
This is a study analyzing the size and scope of the nonprofit sector in the Nashville MSA. I would like to thank the Center for Nonprofit Management (CNM) for sponsoring this initiative with special thanks to Lewis Lavine and Susan King for helping throughout the survey process.
Furthermore, many organizations spent their precious time completing the nonprofit survey. I thank them for their efforts and contributions to this project.
This report is a product of teamwork. The following undergraduate research assistants contributed to various aspects of this project:
John Meese: Literature Review and Data Gathering
Lance R. Ridings: Data Gathering, Outlier Analysis, and MSA Comparison Taylor Eidson: Outlier Analysis, and Employment and Volunteering Data
| 2
Table of Contents
A Guide to the Numbers in This Study 3
Glossary of Terms 4
Executive Summary 5
I. Introduction 8
II. Literature Review and Methodology 9
II.1. Literature Review 9
II.2. Geography and Scope of the Nonprofit Sector 15 II.3. Economic Impact Definition and IMPLAN Software 16
II.4. Data and Data Sources 19
III. Characteristics of the Nonprofit Sector and the Nashville MSA Economy 21
III.1. Size, Scope and Change by Segment 21
III.2. The Nonprofit Sector and the Nashville MSA Economy 34
IV. Economic Assessment of the Nonprofit Sector 36
IV.1. Economic Impact—Export Component 36
IV.2. Economic Contributions—Total Spending 44
IV.3. Economic Contributions Plus Volunteering 50
V. Recession Crisis Management and Nonprofits in the Nashville MSA 53 VI. A Comparative Perspective on the Nonprofit Sector in the Nashville MSA 59
VII. Conclusion 63
VIII. Works Consulted 65
| 4
Study region The geographical area (Nashville MSA) for which economic impacts and contributions are estimated.
Nashville MSA
The Metropolitan Statistical Area including Cheatham, Dickson, Hickman, Davidson, Macon, Canon, Sumner, Smith, Robertson, Rutherford, Trousdale, Williamson, and Wilson counties.
CNM Center for Nonprofit Management
FTE Full time equivalency. Indicates the workload of a full time employee.
BERC MTSU Business and Economic Research Center
IMPLAN model An input-output modeling system. IMPLAN includes procedures for generating multipliers and estimating impacts by applying final demand changes to the model.
Nonprofit sector Businesses that operate for purposes other than profit and are not government organizations.
Business revenue Revenue generated from the operation of nonprofit organizations.
Impact analysis Net new economic activity generated by the nonprofit sector, which includes the impact of dollars from outside the study region on the regional economy.
Contribution / significance analysis
Importance of the nonprofit sector to the study region: Total spending of the nonprofit sector in the local economy.
Nonprofit organization Organizations in our study are those classified as 501(c)(3), 501(c)(4), and 501(c)(6), excluding churches
Employment Total nonfarm employment: The number of people working for wages in non-farming related industries.
Diversity index
A summary measure that takes into account how many different types of nonprofit segments are in the dataset, as well as the relative strength of each segment with respect to number of businesses, total revenues, and total expenditures. The index becomes "zero" when there is only one nonprofit segment (i.e., human services). This study uses the Shannon-Weaver diversity index.
Export base Net new dollars flowing into the region because of the activities of nonprofit organizations.
Nonprofit segments
There are nine major categories of nonprofit organizations used in this study. They are human services; education; health; arts, culture and humanities; environment;
international; mutual benefit; public and social benefit; and unknown. Wages and salaries (Labor
Income) Wages and salaries paid to employees of nonprofit organizations. Direct effect Changes in economic activity during first round of spending.
Indirect effect Changes in sales, income or employment within the region in backward linked industries supplying goods and services to nonprofit organizations.
Induced effect
Increases in sales within the region from employee spending earned in the nonprofit sector and supporting industries. For example, doctors in a nonprofit hospital spend their earnings on goods and services in the regional economy. This spending generates business revenues, employment, and wages and salaries throughout the study area economy.
Total effect Sum of direct, indirect, and induced effects.
Additive (Volunteering) Estimated contributions of volunteer activities are added to total contributions of the nonprofit sector.
Enabler (Volunteering) A component of the nonprofit sector's contributions that may have not been possible without the volunteers.
| 5 Executive Summary
Although its size and scope is considerable, no systematic attempt has previously been made to study this sector in the Nashville MSA. The Business and Economic Research Center (BERC), Middle Tennessee State University, under the sponsorship of the Center for Nonprofit Management (CNM), has produced this assessment of the nonprofit sector’s contribution to the local economy.
Study findings demonstrate the presence of a vibrant nonprofit sector, bringing in a significant amount of money from sources outside the Nashville MSA.
Key Findings
Profile of the Nonprofit Sector
o The Nashville MSA’s nonprofit sector in 2011
employs 151,734 people, 15.3 percent of all regional employment;
has 2,045 nonprofit organizations, 5.44 percent of all regional businesses;
has revenue of $9.4 billion, 6.7 percent of all regional business revenue.
o One in every three individuals over 16 years of age has volunteered for at least one nonprofit organization, generating an economic value of $376 million in wages and salaries and 8,147 in full-time equivalency work hours.
o The nonprofit sector has a strong export base, attracting $2.7 billion from sources outside the Nashville MSA, or one in every three nonprofit dollars.
The Economic Impact of the Nonprofit Sector—An Export Base Analysis
o The economic impact of the direct spending of $2.7 billion (export base) by the nonprofit sector accounts for $6.12 billion in business revenue, representing 4.37 percent of all business revenues in the Nashville MSA.
| 6
For every dollar of direct nonprofit spending of resources flowing from outside sources, an additional $1.22 in business revenue is created in the Nashville MSA through a multiplier effect.
o The nonprofit sector’s export base directly employs 46,415 people, generating an employment impact of 72,095 jobs, accounting for 7.27 percent of all jobs in the Nashville MSA.
For every 100 jobs directly created by the export base of the nonprofit sector, an additional 55 jobs are created across the regional economy.
o The export base component of the nonprofit sector disburses $1.4 billion in wages and salaries, generating an economic impact of $2.67 billion, representing five percent of all study-area wages and salaries.
For every dollar of wages and salaries paid by the nonprofit sector’s export base, an additional $0.91 of wages and salaries is created in the local economy.
o The export base of the nonprofit sector created total annual state and local tax revenues of $201 million in 2011.
Broader Economic Contributions of the Nonprofit Sector to the Nashville MSA Economy
o The nonprofit sector’s total contribution (direct, indirect, and induced) to business revenue in the Nashville MSA is $20.5 billion, accounting for 14.7 percent of the Nashville MSA’s business revenue.
Every dollar of direct spending by the nonprofit sector creates $1.22 in additional revenue throughout the economy of the Nashville MSA.
o Nearly one in every four jobs is created by the nonprofit sector in the Nashville MSA, with a total employment of 237,967 (including all full-time and part-time workers).
| 7
Every 100 direct jobs created by the nonprofit sector generates an additional 57 jobs through multipliers in the Nashville MSA.
o The nonprofit sector accounts for 16.8 percent of the Nashville MSA’s total wages and salaries, totaling $8.96 billion.
Every one dollar of wages and salaries paid by the nonprofit sector creates an additional $0.90 in wages and salaries through multipliers.
Recession Crisis Management
o Nearly 50 percent of nonprofit organizations cited a reduction in revenue because of the 2008 recession, while 56 percent of nonprofits indicated an increase in demand for services.
The Nashville MSA and Its Peers
o The nonprofit sector in the Nashville MSA is relatively strong compared with its nine peer MSAs.
Overall, Nashville ranks third in terms of the strength of the nonprofit sector among 10 MSAs.
Nashville and Raleigh are relatively stronger than other MSAs in terms of the combined strength of the nonprofit segments education and health care.
In conclusion, the nonprofit sector in Nashville, including its volunteerism component, is strong, diverse, and vibrant. It is a major contributor to the economic output (business revenue) of the MSA and plays a vital role in the area’s strong economic picture.
| 8 I. Introduction
The nonprofit sector is an important part of both local and national economies because it includes not only spending and associated employment but also volunteering and civic participation in community affairs. Although its size and scope is considerable, no systematic attempt has previously been made to study this sector in the Nashville MSA. The Business and Economic Research Center (BERC), Middle Tennessee State University, under the sponsorship of the Center for Nonprofit Management (CNM), has produced this assessment of the nonprofit sector’s contribution to the local economy.
The purpose of this study is to find answers to the following questions:
i. What is the scope and size of the Nashville MSA’s nonprofit sector? ii. How has the Nashville MSA’s nonprofit sector evolved over the years?
iii. How has the Nashville MSA’s nonprofit sector managed the economic downturn? iv. How does the Nashville MSA’s nonprofit sector compare with that of peer MSAs? To answer these questions, BERC designed and administered a nonprofit survey in addition to obtaining nonprofit data from various sources. Study findings demonstrate the presence of a vibrant nonprofit sector in the Nashville MSA, bringing in a significant amount of money from sources outside the Nashville MSA.
The rest of this report will proceed as follows. The second chapter deals with the review of selected literature and methodological issues. The third chapter presents a summary of the characteristics of the Nashville MSA’s nonprofit sector. The fourth chapter provides a
comprehensive assessment of its economic contributions. The fifth and sixth chapters compare the Nashville MSA’s nonprofit sector with that of peer MSAs, as well as the effect of the 2008 recession on nonprofit management. A conclusion and survey tables follow.
| 9 II. Literature Review and Methodology
How did BERC analyze the nonprofit sector’s contribution to the local economy? In this section, we briefly address this question by reviewing literature, identifying data sources, and constructing the conceptual framework for data analysis.
II.1. Literature Review
Literature on the nonprofit sector deals with a wide range of topics including the economics of giving, dynamics of volunteering, management issues, civic participation, and economic impact assessments. Given the scope of this study and the research questions posed earlier, we primarily reviewed the literature on the economic contributions of the nonprofit sector to the state and local economies. The selected literature reviewed for this study, shown in Table 1, helped us develop consistent methodology for analyzing the nonprofit sector in the Nashville MSA.
Table 1: Selected Literature Review
Study Region Scope1 Method Data Source Sector Size Composition2 Health Conclusion
MSA/Region level studies
IRS #: 1,081 24% HS 12% ASS IRS 17% HS 13% HLTH 11% RLGN NTEE 10% A&H 2002-2008 IRS 14.6% PHIL NTEE 14.6% EDU 2006-2007 IRS #: 7,612 15.0% EDU NTEE 10.9% HS USCB 14.4% PHIL Kansas City Nonprofit Sector (2007) 9% T-L/F #t1.9% 13.3% n/a 10.8% HS 1.66 #/PP #: 8,010 CMP Survey USCB National and local data used to quantify nonprofit sector. Entire population used to negate sampling error. Results compared to similar regions. Includes some
501(c)(4) & 501(c)(6) data
#t33% The sector has flourished in the broadening economy and will continue to do so.
'08-'09: #t8.2%, RVt2%
Focus of study is to provide relevant data in order to encourage research and understanding. Kansas City MSA Kansas City Nonprofit Sector (2009) 12.4% n/a RVt17%
Focus of study is to provide relevant data in order to encourage research and understanding.
1.65 #/PP 9% T-L/F CMP Survey
National and local data used to quantify nonprofit sector. Entire population used to negate sampling error. Results compared to similar regions. Includes some 501(c)(4) & 501(c)(6) data Kansas City MSA 10% A&H, EDU, RLGN, HLTH State of the Sector (2012) Northeast Florida
2009-2010 National statistics used to examine nonprofit sector structure and financial makeup. Results compared to similar regions.
NCCS
NTEE 3% BUS
9% T-L/F
Despite nonprofit number growth, few have the capacity to make significant impact or weather economic turmoil. '07-'08: #u2.8% #t102% RVt71% State of the Sector (2010)
National statistics used to examine nonprofit sector structure and financial makeup. Compared to similar regions.
NCCS 0.9 #/PP 1998-2008 Northeast Florida #: 998
#Number of NPOs in region CNPCouncil of Nonprofits GSPGross State Product NTEENational Taxonomy of Exempt Entities T-L/FTotal Region Labor Force
#/PPNumber of NPOs per 1,000 residents DESDepartment of Employment Security HLTHHealth P/RTotal region payroll TRTotal revenue in region
A&HArts & Humanities DOLDepartment of Labor HSHuman Services PHILPhilanthropy/Grantmaking USCBUnited States Census Bureau
ASSAssociations EDUEducation IRSInternal Revenue Service p-L/FTotal region private sector Labor Force UVMUniversity of Vermont
BEAUS Bureau of Economic Analysis EMPLEmployment n/aNo classification code PUBPublic & Societal Benefit V/HVolunteer hours (in millions)
BUSTotal Region Businesses (Number) ERICEconomic Research and Information Center NCCSNational Center for Charitable Statistics RLGNReligion VLNumber of volunteers
CNCSCorporation for National & Community Service
GMPGross Metropolitan Product NPONon Profit Organization RVRevenue VOLVolunteer rate
1Unless otherwise noted, the studies referenced here limit the scope of their study to 501(c)(3) organizations with more than $25,000 in annual revenue. 2The subsectors mentioned are those with a 10% or higher share of the nonprofit sector.
| 11
Table 1: Selected Literature Review (Continued)
Study Region Scope1 Method Data Source Sector Size Composition2 Health Conclusion
MSA/Region level studies continued
2005-2006 IRS #: 7473 15.2% PHIL
NTEE 3.8% BUS 14.7% EDU USCB 9% T-L/F 10.9% HS 2004-2005 IRS #: 7,336 16.6% EDU NTEE 2.8% BUS USCB 9% T-L/F 1.38 #/PP 13% GMP
State level studies
2008-2010 IRS #: 3,022 33% HS NCCS 18% GSP 15% EDU CNCS 15% T-L/F 2012 IRS #: 6,201 37.7% HS 31% VOL 18.7% HLTH 14.1 V/H 11.9% EDU 11.3% PUB 10.7% A&H National and local statistics used
to examine nonprofit sector. Results compared to similar regions. Includes spotlight on key region NPOs. NPOs with revenue greater than $50,000/year Maine (ME) Maine Nonprofit Sector Impact (2013) ME DOL 16% P/R 12% A&H, HLTH EMPLt4 % Kansas City Nonprofit Sector (2005) Kansas City Nonprofit Sector (2006) CMP Survey 1.77 #/PP 13.3% n/a Kansas City MSA
National and local data used to quantify nonprofit sector. Entire population used to negate sampling error. Results
compared to similar regions and trend.
#t1.8% Focus of study is to provide relevant data in order to encourage research and understanding.
Includes some 501(c)(4) & 501(c)(6) data
RVt12%
The nonprofit sector is essential to the region. Not mentioned in this study North Dakota's Nonprofit Sector in Brief (2013) North Dakota (ND) NPOs with revenue greater than $50,000/year
National statistics used to examine nonprofit sector structure and financial makeup, including limited impact assessment. CNCS NCCS 15% p-L/F Kansas City MSA #t26%
Despite the continued demand for services, more nonprofit organizations are competing for fewer resources. Present revenue levels for the sector are below 2002 levels. RVu5.6%
10.5% HS 16.5% PHIL Survey
National and local data used to quantify nonprofit sector. Entire population used to negate sampling error. Results
compared to similar regions and trend.
Includes some 501(c)(4) & 501(c)(6) data
The nonprofit sector is essential to the region.
#Number of NPOs in region CNPCouncil of Nonprofits GSPGross State Product NTEENational Taxonomy of Exempt Entities T-L/FTotal Region Labor Force
#/PPNumber of NPOs per 1,000 residents DESDepartment of Employment Security HLTHHealth P/RTotal region payroll TRTotal revenue in region
A&HArts & Humanities DOLDepartment of Labor HSHuman Services PHILPhilanthropy/Grantmaking USCBUnited States Census Bureau
ASSAssociations EDUEducation IRSInternal Revenue Service p-L/FTotal region private sector Labor Force UVMUniversity of Vermont
BEAUS Bureau of Economic Analysis EMPLEmployment n/aNo classification code PUBPublic & Societal Benefit V/HVolunteer hours (in millions)
BUSTotal Region Businesses (Number) ERICEconomic Research and Information Center NCCSNational Center for Charitable Statistics RLGNReligion VLNumber of volunteers
CNCSCorporation for National & Community Service
GMPGross Metropolitan Product NPONon Profit Organization RVRevenue VOLVolunteer rate 1Unless otherwise noted, the studies referenced here limit the scope of their study to 501(c)(3) organizations with more than $25,000 in annual revenue.
2The subsectors mentioned are those with a 10% or higher share of the nonprofit sector.
| 12
Table 1: Selected Literature Review (Continued)
Study Region Scope1 Method Data Source Sector Size Composition2 Health Conclusion
State level studies continued
IRS 26% RLGN Responses:
NCCS 14% PHIL 54%:tRV
OR DOJ 12% A&H 20%:uRV
Survey 10% HS 25%:tVL 4% margin of error
43% HS Responses: 18% HLTH 37%:uRV 14% EDU 32%:tRV NCCS 15% GSP CNCS 14% T-L/F BEA 32.4 V/H NH DES 28% VOL 2007-2010 IRS #: 4,316 38% HS NCCS 80 V/H 17% EDU 14% HLTH 10% PUB
IRS #: 4,028 28% HLTH & Responses:
NCCS 19% GSP 16% EDU
BEA 20.7 V/H
UVM 6.5 #/PP
Nontraditional funding avenues, such as fundraising and special events, are expected to increase over the next year. 60%uRV
15% A&H National and local statistics,
compared with survey results, used to examine nonprofit sector. 2008-2010 Vermont (VT) Vermont's Nonprofit Sector (2011) 2009-2011 New Hampshire (NH) Nonprofit Sector in Brief (2012)
The nonprofit sector is essential to the region.
#t47% 10% T-L/F
CNCS National and local statistics used to examine nonprofit sector structure and financial makeup. Financial strategies examined. Includes some 501(c)(4) & 501(c)(6) data Kentucky (KY) Kentucky's Nonprofit Sector (2012)
The recovery and success of the region nonprofit sector is dependent on cross-sector cooperation and partnership. Not mentioned in this study 14% EDU 31% HS National and local statistics used
to examine nonprofit sector structure and financial makeup. Financial strategies examined. Oregon (OR) Oregon Nonprofit Sector (2012)
Nonprofits expect revenue and support to increase in fiscal 2012.
Demand for nonprofit services continues to rise while overall funding remains low.
Not mentioned in this study NJ Center for Non-Profits This study consists primarily of
the results of an online survey issued to a sample of the region. 2011 New Jersey (NJ) New Jersey Nonprofits (2012) 13% p-L/F #: 10429 National and local statistics,
compared with survey results and past reports, used to examine nonprofit sector. 2010-2011
#Number of NPOs in region CNPCouncil of Nonprofits GSPGross State Product NTEENational Taxonomy of Exempt Entities T-L/FTotal Region Labor Force
#/PPNumber of NPOs per 1,000 residents DESDepartment of Employment Security HLTHHealth P/RTotal region payroll TRTotal revenue in region
A&HArts & Humanities DOLDepartment of Labor HSHuman Services PHILPhilanthropy/Grantmaking USCBUnited States Census Bureau
ASSAssociations EDUEducation IRSInternal Revenue Service p-L/FTotal region private sector Labor Force UVMUniversity of Vermont
BEAUS Bureau of Economic Analysis EMPLEmployment n/aNo classification code PUBPublic & Societal Benefit V/HVolunteer hours (in millions)
BUSTotal Region Businesses (Number) ERICEconomic Research and Information Center NCCSNational Center for Charitable Statistics RLGNReligion VLNumber of volunteers
CNCSCorporation for National & Community Service
GMPGross Metropolitan Product NPONon Profit Organization RVRevenue VOLVolunteer rate
1Unless otherwise noted, the studies referenced here limit the scope of their study to 501(c)(3) organizations with more than $25,000 in annual revenue. 2The subsectors mentioned are those with a 10% or higher share of the nonprofit sector.
| 13
Table 1: Selected Literature Review (Continued)
Study Region Scope1 Method Data Source Sector Size Composition2 Health Conclusion
State level studies continued
2008 IRS #: 5,804 38% HS 19% HLTH 12% EDU 11% PUB 10% A&H 2008-2010 2007-2008 IRS #: 2,935 32% HS NCCS 17% GSP 15% EDU CNCS 14% HLTH ME DOL 12% A&H IRS #: 31,511 23% HS NCCS 7% T-L/F 20% PUB 18% EDU 17% RLGN National statistics used to
examine nonprofit sector structure and financial makeup, including limited impact assessment. Includes all region NPOs North Dakota (ND) The North Dakota Nonprofit Sector (2010)
The nonprofit sector is essential to the region. Not mentioned in this study 34% VOL 17 V/H CNCS NCCS
Smaller nonprofits are struggling more than larger ones, yet all have begun to rely increasingly upon earned income. The sector remains hopeful that 2011 will yield sector improvements. 55%uRV (2008) 61%uRV (2009) 37%uRV (2010) Survey
Survey results examined over a period of multiple years to explore immediate effects of the recession. Includes only data on members of the MN CNP Minnesota (MN) Nonprofit Current Conditions Report (2010) 32% HS #: 2,000 10% HLTH 11% PHIL & PUB 436 surveyed 2009-2010 New Jersey (NJ) New Jersey's Nonprofit Sector (2009) 14% T-L/F EMPLt2 %
The nonprofit sector is essential to the region while
demonstrating efficiency and innovative partnerships.
The nonprofit sector is essential to the region. Nonprofits strain as funding pools shrink and demand for services increases. '98-'07: RVt55% '98-'08: #t72% 162.5 V/H NJ DOL National statistics used to
examine nonprofit sector structure and financial makeup. Maine Nonprofit Sector Impact (2010) Maine (ME) Includes some 501(c)(4) & 501(c)(6) data
National and local statistics used to examine nonprofit sector structure. Includes spotlight on key region NPOs.
#Number of NPOs in region CNPCouncil of Nonprofits GSPGross State Product NTEENational Taxonomy of Exempt Entities T-L/FTotal Region Labor Force
#/PPNumber of NPOs per 1,000 residents DESDepartment of Employment Security HLTHHealth P/RTotal region payroll TRTotal revenue in region
A&HArts & Humanities DOLDepartment of Labor HSHuman Services PHILPhilanthropy/Grantmaking USCBUnited States Census Bureau
ASSAssociations EDUEducation IRSInternal Revenue Service p-L/FTotal region private sector Labor Force UVMUniversity of Vermont
BEAUS Bureau of Economic Analysis EMPLEmployment n/aNo classification code PUBPublic & Societal Benefit V/HVolunteer hours (in millions)
BUSTotal Region Businesses (Number) ERICEconomic Research and Information Center NCCSNational Center for Charitable Statistics RLGNReligion VLNumber of volunteers
CNCSCorporation for National & Community Service
GMPGross Metropolitan Product NPONon Profit Organization RVRevenue VOLVolunteer rate
1Unless otherwise noted, the studies referenced here limit the scope of their study to 501(c)(3) organizations with more than $25,000 in annual revenue. 2The subsectors mentioned are those with a 10% or higher share of the nonprofit sector.
| 14
Table 1: Selected Literature Review (Continued)
Study Region Scope1 Method Data Source Sector Size Composition2 Health Conclusion
State level studies continued
2007-2008 #: 7817 15% GSP 14% T-L/F 40.4 V/H 32% VOL 5.76 #/PP USCB #: 10,494 35.3% HS NCCS 1.77 #/PP 17.1% EDU 13.1% HLTH 12.7% PUB 38% HS 11% PUB 12% EDU, HLTH, A&H
The nonprofit sector is essential to the region.
'94-'04: #t79% #: 1,668
IRS National statistics used to
examine nonprofit sector structure and financial makeup, including impact assessment. 2004 Montana (MT) Montana Nonprofit Sector (2007) 13% EDU Not mentioned in this study
The nonprofit sector is essential to the region.
13% GSP MO ERIC
National and local statistics used to examine nonprofit sector structure and makeup, including limited impact assessment. 2009 Missouri (MO) Missouri Nonprofit Sector (2009) Not mentioned in this study
The nonprofit sector is essential to the region. A Portrait of the Nonprofit Sector in New Hampshire (2009) New Hampshire (NH) Includes all region NPOs
National and statistics used to examine nonprofit sector structure and financial makeup. Key leaders interviewed for sector insight. IRS NCCS CNCS 29% HS 23% PUB
#Number of NPOs in region CNPCouncil of Nonprofits GSPGross State Product NTEENational Taxonomy of Exempt Entities T-L/FTotal Region Labor Force
#/PPNumber of NPOs per 1,000 residents DESDepartment of Employment Security HLTHHealth P/RTotal region payroll TRTotal revenue in region
A&HArts & Humanities DOLDepartment of Labor HSHuman Services PHILPhilanthropy/Grantmaking USCBUnited States Census Bureau
ASSAssociations EDUEducation IRSInternal Revenue Service p-L/FTotal region private sector Labor Force UVMUniversity of Vermont
BEAUS Bureau of Economic Analysis EMPLEmployment n/aNo classification code PUBPublic & Societal Benefit V/HVolunteer hours (in millions)
BUSTotal Region Businesses (Number) ERICEconomic Research and Information Center NCCSNational Center for Charitable Statistics RLGNReligion VLNumber of volunteers
CNCSCorporation for National & Community Service
GMPGross Metropolitan Product NPONon Profit Organization RVRevenue VOLVolunteer rate
1Unless otherwise noted, the studies referenced here limit the scope of their study to 501(c)(3) organizations with more than $25,000 in annual revenue. 2The subsectors mentioned are those with a 10% or higher share of the nonprofit sector.
II.2. Geography and Scope of the Nonprofit Sector
The geographical scope of this study is confined to the Nashville Metropolitan Statistical Area (MSA), which includes 13 counties in middle Tennessee, shown in Map 1: Cheatham, Dickson, Hickman, Davidson, Macon, Canon, Sumner, Smith, Robertson, Rutherford, Trousdale,
Williamson, and Wilson counties.
A clearly defined study area allows us to identify out-of-area monetary flows. If the source of a nonprofit’s revenue is from outside a clearly
defined area, we then argue that the monetary activity is net addition to the area’s economy. This treatment is an important component of the economic impact estimates in the following sections.
Does this study include all nonprofit organizations? Consistent with the literature, this study deals with a selected number of nonprofit organizations. BERC initially used the IRS classification of tax- exempt institutions. BERC collected information for
Proposed Nonprofit Sector Study Area
Map 1: What is the study area?
What nonprofits are included in this study? a. Public Charities (501(c)(3))
b. Civic League and Social Welfare (501(c)(4))
c. Business Leagues and Associations (501(c)(6))
Are all organizations in these groups included in this study? No, there are two exclusions:
a. Organizations with less than $25,000 in annual revenue b. Churches were excluded
| 16 institutions classified under the following subgroups: Public Charities (501(c)(3)), Civic Leagues and Social Welfare Organizations (501(c)(4), and Business Leagues (501(c)(6).
In choosing nonprofits for this survey, BERC used the nonprofits’ income as a main criterion under the following guideline: if the last reported income (IRS 990 form) was less than $25,000, BERC excluded that organization. Furthermore, consistent with the literature, churches were excluded.
II.3. Economic Impact Definition and IMPLAN Software
What is the concept of economic impact, and how do we estimate it? In analyzing the nonprofit sector, BERC provides three types of assessment: (I) its economic impact (narrow category); (II) its economic contribution
(broader category); and (III) its economic contribution including volunteer hours (the broadest category). The chart on the right illustrates the three measures’ relationship.
Economic Impact and Economic Contributions. Economic impact refers to economic activities that are net new to the local
economy. Such activities include exporting of goods and services by local businesses to areas outside the Nashville MSA, out-of-area visitor spending, and recapturing of economic activities sent outside the Nashville MSA due to lack of local business services. In the case of the nonprofit industry, we measure the direct economic impact by identifying the amount of monetary flow to
| 17 the study region from outside the Nashville MSA: the net contributions to local economic activities. Without these nonprofit organizations, the local economy would have been smaller in proportion to the net new economic activities associated with the nonprofit sector, as well as their indirect and induced effects.
This study makes a distinction between economic impact and economic
contributions. While the former refers to new economic activity, the latter deals with the total size of the
nonprofit sector in the Nashville MSA. The concept of economic contributions then refers to total spending of the nonprofit sector in the local economy. Because it is a broader concept, any measure of economic contributions includes the economic impact measures. To measure the economic contributions, this study first calculates total
expenditure of the nonprofit sector and then counterfactually removes the sector from the local economy to identify indirect and induced effects.
Finally, this study argues that the economic activities associated with the nonprofit sector would not have been possible with only their given level of employment and nothing more. Volunteers are
What concepts are estimated? (I) Economic Impact
a. Monetary flow to Nashville from outside the Nashville MSA:
i. Direct Impact—amount of monetary flow to the nonprofit sector from outside the Nashville MSA
ii. Indirect Impact—business-to-business transactions in the region as money is spent by the nonprofit sector
iii. Induced Impact—impact of employees’ spending in the region as they receive salaries and wages from the nonprofit sector
(II) Economic Contributions
a. Economic impact (I) plus other spending
associated with the locally generated revenue i. Direct Impact—amount of nonprofit’s
total spending
ii. Indirect Impact—effects of business-to-business transactions
iii. Induced Impact—effects of employee spending
(III) Economic Contributions plus Volunteering a. Economic contributions (II) plus volunteering
i. Direct Impact—only the direct measure of the value of volunteering
| 18 critically important in this sector. In a third category, this study quantifies total wages associated with volunteer labor and adds the total direct wages to the economic contribution estimates.
IMPLAN Model. To estimate indirect and induced effects of economic activities, BERC uses the IMPLAN model developed for the Nashville MSA. IMPLAN is a nationally recognized, commonly used input-output model to measure the economic and fiscal effects of economic development projects.
What is this study not measuring? It is important to note that by its very nature, this study estimates economic contributions of the nonprofit organizations’ spending in the Nashville MSA. This estimate is markedly different from the economic contributions of nonprofit-related economic activities in the Nashville MSA. In the latter case, a study would also estimate any economic activity
associated with a nonprofit organization. For example, while this research focuses simply on the impact of a university’s operating expenditure spending, a broader study might also include spending associated with visitors to the
campus, students’ spending, capital expenditures, etc. Adding all of these components could even double the total impact estimate of an organization’s operating expenditure. For this reason, the results in this study are not directly comparable with studies that deal with all economic activities associated with a nonprofit organization.
| 19
II.4. Data and Data Sources
Where did the data originate? This study has used multiple sources to construct the input
database. The chart below summarizes the process followed to estimate the variables of interest.
A. Data identification and extraction process. BERC created several databases used in this study. At the regional level, establishment, employment, revenue, and population indicators were collected to standardize the nonprofit indicators across peer MSAs. Using the National Center for
Charitable Statistics (NCCS) Core Files, BERC staff identified several outlier organizations in the database and collected employment and volunteering information for those organizations using IRS 990 form files.
Chart 1: Database Identification, Survey Administration, and Indicator Creation Process
A. Data Identification and Extraction C. Variables Created and Used B. Online Survey of Nonprofits in the Nashville MSA
Regional Economic Indicators • Establishment • Employment • Revenue • Population National Center for Charitable Statistics Core Files • Nonprofit Establishments • Nonprofit Revenues • Nonprofit Expenditures • Nonprofit Segments Individual IRS Form 990 Files
• Outlier Nonprofit Employment • Outlier Nonprofit Volunteers • Outlier Nonprofit Revenues
Online Survey of Nonprofit Organizations in
the Nashville MSA
Percent of Revenues from Sources Outside the MSA
Number of Volunteers and Volunteer Hours Crisis Management Other Characteristics of Nonprofit Organizations Variables of Interest I. Economic Impact (a) Amount of expenditure attributable to sources outside the MSA
II. Economic Contributions (a) Amount of total expenditure of nonprofit organizations
III. Volunteer Hours (a) Number of volunteers (b) Number of volunteer hours
(c) Wage equivalent of volunteer hours IV. Comparison (a) Nonprofit versus other major sectors of economy (b) Nashville versus peer MSAs
| 20
B. Online survey of nonprofits in the Nashville MSA. BERC designed and administered an online survey of nonprofit organizations in February 2013. The primary purpose was to gather several pieces of
information that would supplement the data BERC obtained in section A. BERC
received 306 completed surveys from nonprofit organizations out of 1,086 organizations surveyed for a survey response rate of 28.18 percent. The survey helped us answer three major questions:
I. What is the percent of nonprofit revenues coming from sources outside the Nashville MSA? II. What is the extent of volunteering in the Nashville MSA?
III. How did nonprofit organizations manage the 2008 recession? In the section that follows, we will cover these issues extensively.
C. Variables created and used in this study. As a result of the processes in sections A and B, BERC created several variables that will be used throughout this study (Section C in Chart 1).
No
Response Response
Drop from the list (Undeliverable, misclassification or asked to be removed) Total Net total Response Rate Email Census 399 230 10 635 625 36.22% Mail Sample 385 76 60 521 461 16.49% Total Sample 784 306 70 1,156 1,086 28.18% Total Population 2,045 Margin of error +/-5.17%
| 21 III. Characteristics of the Nonprofit Sector and the Nashville MSA Economy
Organizations in the nonprofit sector represent a diverse group of the NAICS (North American Industrial Classification System) sectors in the regional economy. They also differ in size in terms of employment, revenue, and expenditure. For example, the 15 largest organizations in the
Nashville MSA’s nonprofit sector account for two-thirds of its total revenue and expenditure. This section explores the dynamics of the nonprofit sector in the Nashville MSA.
III.1. Size, scope and change by segment
Number of establishments. According to the NCCS Core Files, the number of nonprofit
organizations whose total revenue is larger than $25,000 was 2,045 in the Nashville MSA in fiscal year 2010-11, representing 5.44 percent of all businesses in the Nashville MSA. In terms of nonprofit organizations by major segment, the human services segment is by far the largest, representing 34 percent of all nonprofits. Compared with 2008, the number of nonprofit
0% 5% 10% 15% 20% 25% 30% 35% H uma n Se rvi ce s Pu b lic a nd S oc ie ta l B ene fi t (Ot he r) Ed uc a tio n H ea lth C a re A rt s En viro nme nt and An imal s Int ernat io na l Mu tua l B ene fi t Un kn own Perc ent of N onpro fi t Esta bl is hme nt s
Major Nonprofit Segments
Chart 2: Nonprofit Organizations in the Nashville MSA by Major Segment (% in 2010)
| 22 organizations increased by 5.2 percent. In the same period, the total number of businesses in the Nashville MSA decreased by 3 percent.
Chart 3 below presents changes in the number of nonprofit organizations by segment. The largest growth occurred in the international segment, with an increase of 39.4 percent to 46 in 2010. In terms of the absolute number, the
segments of human services and education added 44 and 31 new organizations, respectively, between 2008 and 2010. Organizations classified under mutual benefit, public and societal benefit, and unknown were either stagnant or experienced decline in numbers between 2008 and 2010.
From 2008 to 2010, total businesses
in the Nashville MSA declined by 3
percent to 37,619, while the number
of nonprofit organizations with
income larger than $25,000
| 23
Nonprofit revenues. What is the size of the nonprofit sector in the Nashville MSA? To estimate this figure, BERC used a consistent source, the NCCS Core Files, and an online survey. This report presents a conservative estimate of total revenue because BERC excluded (a) all organizations with less than $25,000 in annual revenue and (b) about 400 smaller organizations because the mailed surveys were returned as undeliverable.
According to BERC estimates, the size of the nonprofit sector in the Nashville MSA was $9.4 billion in 2010. The nonprofit sector experienced significant growth between 2008 and 2010, with a 10.2 percent increase in revenue in current dollars.
How is this revenue distributed across major nonprofit
segments? Chart 4 summarizes the breakdown of nonprofit sector revenue by major segment. The education segment accounts for nearly half (46.8%) of nonprofit revenues with $4.4 billion. The second-largest segment is health care with $3.1 billion and a 32.9 percent share, followed by human services with $0.94 billion and public and societal benefits with $0.62 billion.
All major nonprofit segments recorded growth in revenue between 2008 and 2010. While some segments recorded moderate growth in terms of percent change, such segments as mutual benefit, international, and those classified as unknown doubled their revenues (Table 1).
Nashville’s nonprofits
experienced significant
revenue growth between
2008 and 2010:
Up 10.2%
| 25
Nonprofit expenditures. What matters for this study is how much money nonprofit organizations spend in the Nashville MSA. The amount of money these organizations spend enters as a direct input into the regional IMPLAN model to measure the economic contributions of these
organizations. BERC used the NCCS Core Files and BERC online survey results to calculate the expenditure side of the equation. As stated in the methodology section, this study does not attempt to measure capital expenditures because these expenditures may show significant annual fluctuations.
According to BERC estimates, total expenditure of the nonprofit sector in the Nashville MSA was $8.97 billion in 2010. The nonprofit sector’s expenditure showed significant growth between 2008 and 2010 with a 10.8 percent increase in expenditures in current dollars.
How is this expenditure distributed across major nonprofit segments? Chart 5 summarizes the breakdown of nonprofit sector expenditure by major segment. The education segment of the nonprofit sector, with $4.3 billion, accounts for nearly half (47.7 percent) of nonprofit
expenditures. The second-largest segment is health care with $3.0 billion and a 33.3 percent share, followed by human services with $0.90 billion and public and societal benefits with $0.51 billion.
Unlike the case of nonprofit revenue, a few nonprofit segments recorded a decline in total expenditures between 2008 and 2010: the mutual benefit segment experienced a 7.51 percent decline and the public and societal benefit (other) a 5.21 percent decline in expenditures. Total decline in these segments amounted to nearly $29 million. On the other hand, the education and health care segments recorded significant expenditure growth (in absolute size) with a combined total growth of $0.79 billion (Table 2).
| 27
Nonprofit employment. How many people are employed by this diverse group of nonprofit
organizations? To answer this question, BERC directly asked nonprofit organizations for feedback through an online survey. In addition, BERC did a separate analysis of the 12 largest outlier organizations to get their employment figure separately. According to BERC estimates, nonprofit organizations have 140,650 full-time and 40,489
part-time employees with a combined full-part-time equivalent (FTE) of 151,734 employees. Direct employment figures
represent nearly 15.3 percent of Nashville MSA employment.
Chart 6 summarizes nonprofit employment by major segment. Given the strength of the health care sector in the Nashville MSA, it is not surprising that the health care segment leads all others by 68,218 employees. Education is second with 52,066 and human services a distant third with 20,502 employees. In this context, it is important to highlight the fact that, unlike many peer
Nearly one in every seven
employees in the Nashville
MSA works in the
nonprofit sector.
| 28 MSAs, the education and health care segments in the Nashville MSA nonprofit sector are very much intertwined because of the presence of both Vanderbilt University and Meharry Medical College.
Chart 7 presents the percent breakdown of employment by nonprofit segment in the Nashville MSA. The health care segment represents nearly 45 percent of nonprofit sector employment, followed by education (34.31%) and human services (13.51%). Overall, direct employment by the nonprofit sector is a major force in the Nashville MSA. These estimates do not include the volunteer force these organizations mobilize when there is an unmet need in society.
| 29
Nonprofit volunteers. BERC administered an online survey to measure the level of volunteer activities in the nonprofit sector of the Nashville MSA. According to BERC estimates, a total of 429,588 people volunteered in nonprofit organizations in 2011. Since this survey was not a survey of the population about its volunteering activities, this number may involve duplicate counts of certain individuals volunteering for several organizations throughout the year. What does this tell us about the extent of volunteering in the Nashville MSA? Assuming this number represents unique individuals, one in every three people over 16 years of age volunteered in the nonprofit sector in the Nashville MSA in 2011. This figure is a little
higher than U.S. figures measured through the Current Population Survey (www.bls.gov): According to the
September 2012 estimates, slightly over one in every four individuals over 16 years of age had volunteered in the U.S. in 2011.
What is the significance of volunteering in the Nashville MSA? According to BERC estimates, the volunteers in the Nashville MSA recorded 15,641,448 hours of volunteering in 2011. If we use full-time (40 hours per week) employment figures,
these volunteer hours translate into 8,147 full-time employment equivalency. When we use the 2011 average annual wage for a full-time nonfarm employee in the Nashville MSA, $46,150, the nonprofit volunteering’s monetary value is $376 million.
One in every three people
over 16 years of age has
volunteered in the
nonprofit sector in the
Nashville MSA.
Monetary value of nonprofit
volunteering in the Nashville MSA
is $376 million.
This value is equivalent to the
wages of 8,147 full-time
employees in the Nashville MSA.
| 30 Table 2 below presents volunteering activities across nonprofit segments in the Nashville MSA. The human services segment leads with 225,953 volunteers, followed by public and societal benefit. The public and societal benefit segment has the largest number of volunteer hours with 5.9 million and full-time employment equivalents with 3,056. For percentage distribution, see Chart 8 below.
| 31
Nonprofits as export base. One of the critical research goals of this study is to identify the amount of money flowing to the Nashville MSA from outside sources. BERC used an online survey to identify the percent of nonprofit revenues flowing from sources outside the Nashville MSA. From the survey results we then estimated the total amount of nonprofit expenditure associated with outside sources. This amount is the net new addition to the study region’s economy on which economic impact estimates are based.
As shown in Chart 9, nearly 20 percent of nonprofit organizations in the Nashville MSA have received more than 50 percent of their revenues from sources outside the study region. By using mid-point values, BERC estimated that $2.7
billion in 2011 flowed to the Nashville MSA economy from outside sources because of nonprofit sector activities. In 2008, the total amount of that flow was estimated at $2.5
The amount of money flowing to
the Nashville MSA from other
regions grew by 8.33 percent
| 32 billion. The amount of money flowing to the Nashville MSA from other regions grew by 8.33 percent between 2008 and 2011.
What does this figure tell us about the nonprofit’s role in the Nashville MSA economy? The
nonprofit sector is like an export sector, bringing a significant amount of money into the region by selling goods and services to individuals both in and out of the Nashville MSA. In 2011, an
estimated 28.5 percent of all nonprofit
revenues flowed from other regions. This figure was about the same in 2008. Given the margin of error in the survey, it would be reasonable to state that one in every three dollars of
nonprofit revenues comes from other regions.
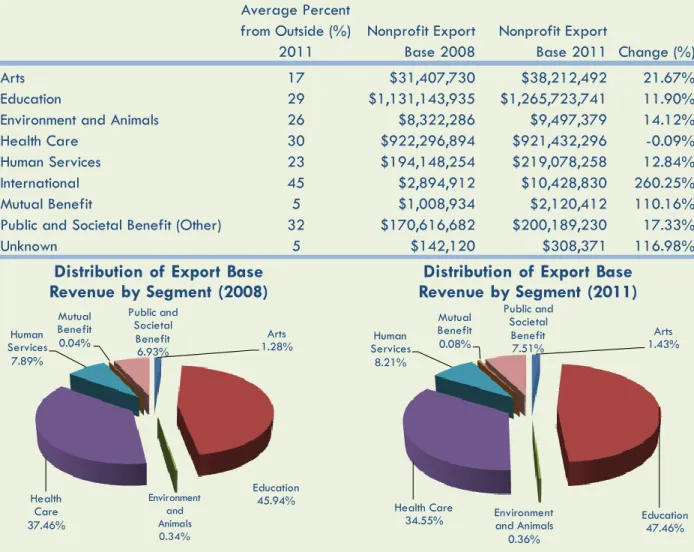
How is the export base of nonprofit revenue distributed across major nonprofit segments? Table 4 gives a detailed view of the distribution and change in the export base of the nonprofit sector. According to the BERC survey, the international segment of nonprofit organizations attracts the largest share of its revenues from other regions, followed by the public and societal benefit and health care segments. In terms of the actual dollar amount, education at $1.27 billion, health care at $0.92 billion, and human services at $.22 billion occupy the top three positions. Compared to 2008, all segments except health care recorded at least a double- or triple-digit growth rate in revenues coming from other regions in the most recent fiscal year. Over the years, as pie charts show, the education segment’s share in the total export base increased more than one percentage point, while the health care segment lost nearly three percentage points.
Nearly one in every three
dollars of nonprofit
revenues flows from other
regions to the Nashville
MSA.
| 33 Export-base calculations in this section will inform us in the following sections about the size of the total economic impact of the nonprofit sector in the Nashville MSA. Following a brief comparative data analysis of the Nashville MSA’s nonprofit sector, Chapter IV presents the economic and fiscal impacts as well as total contributions of nonprofits and volunteering.
III.2. Nonprofit Sector and the Nashville MSA Economy
Average Percent from Outside (%) 2011 Nonprofit Export Base 2008 Nonprofit Export Base 2011 Change (%) Arts 17 $31,407,730 $38,212,492 21.67% Education 29 $1,131,143,935 $1,265,723,741 11.90%
Environment and Animals 26 $8,322,286 $9,497,379 14.12%
Health Care 30 $922,296,894 $921,432,296 -0.09%
Human Services 23 $194,148,254 $219,078,258 12.84%
International 45 $2,894,912 $10,428,830 260.25%
Mutual Benefit 5 $1,008,934 $2,120,412 110.16%
Public and Societal Benefit (Other) 32 $170,616,682 $200,189,230 17.33%
Unknown 5 $142,120 $308,371 116.98%
Table 4: Export Base of the Nonprofit Sector in the Nashville MSA by Segment, Share, and Year
Arts 1.28% Education 45.94% Environment and Animals 0.34% Health Care 37.46% Human Services 7.89% Mutual Benefit 0.04% Public and Societal Benefit 6.93%
Distribution of Export Base Revenue by Segment (2008) Arts 1.43% Education 47.46% Environment and Animals 0.36% Health Care 34.55% Human Services 8.21% Mutual Benefit 0.08% Public and Societal Benefit 7.51%
Distribution of Export Base Revenue by Segment (2011)
| 34 In the previous section, we highlighted the fact that the nonprofit sector represents about 15.3 percent of total employment in the Nashville MSA. The nonprofit sector’s revenue represents 6.7 percent of the Nashville MSA’s
business revenue (output).
How does it compare with the other major sectors in the Nashville MSA economy if we treat the nonprofit sector as an independent major economic sector in the Nashville MSA? In terms of
employment share in the Nashville MSA economy, the sector would become number one with a little over 15 percent (Chart 10). The nonprofit sector’s share is somewhat smaller in terms of business revenue at 6.7 percent and value added (GDP) at 11.45 percent (Table 5 below). Place of Nonprofit Sector in the Nashville MSA Economy
Percent Share in Total Businesses 5.50%
Percent Share in Employment 15.30%
| 35 Compared with the major sectors in the regional economy, the nonprofit sector emerges as an economic powerhouse in terms of direct employment. The next section looks at additional dynamics to explore what other jobs, revenue, income, and taxes are associated with this direct employment.
Table 5: Nonprofit Sector in the Nashville MSA Economy: A Snapshot Description*
Total 991,456 Rank $140,108,520,318 Rank $81,588,381,749 Rank
11 Ag, forestry, fish & hunting 13,840 18 $540,656,881 20 $178,574,751 21
21 Mining 2,855 20 $527,188,939 21 $279,785,734 20 22 Utilities 1,232 21 $602,025,061 19 $387,621,161 19 23 Construction 54,646 11 $6,703,160,652 10 $2,932,651,070 12 31-33 Manufacturing 61,546 9 $30,217,266,848 1 $9,081,549,149 4 42 Wholesale trade 37,819 13 $6,156,347,656 11 $4,848,286,133 8 44-45 Retail trade 100,673 4 $7,078,886,063 9 $4,795,165,756 9
48-49 Transportation & warehousing 33,503 14 $4,451,253,464 14 $2,555,965,366 13
51 Information 22,205 17 $7,091,403,566 8 $3,734,872,045 10
52 Finance & insurance 66,529 7 $13,192,311,523 3 $6,739,245,728 6 53 Real estate & rental 41,466 12 $12,833,420,675 4 $10,676,134,775 1 54 Professional- scientific & tech svcs 65,304 8 $8,241,307,072 7 $6,169,840,244 7 55 Management of companies 10,952 19 $2,117,434,814 17 $1,391,768,188 16 56 Administrative & waste services 67,525 6 $4,489,650,459 13 $3,067,790,802 11 61 Educational svcs 26,619 16 $2,139,640,930 16 $1,223,858,643 17 62 Health & social services 107,972 3 $14,995,959,656 2 $10,531,612,946 2 71 Arts- entertainment & recreation 31,725 15 $1,788,317,444 18 $1,120,029,917 18 72 Accommodation & food services 73,508 5 $4,500,639,618 12 $2,544,759,422 14 81 Other services 58,478 10 $3,930,120,674 15 $2,131,067,348 15 92 Government & non NAICs 113,060 2 $8,511,528,323 6 $7,197,802,571 5
00 Nonprofit Sector* 151,734 1 $9,353,857,693 5 $9,353,857,693 3
Source: IMPLAN, BERC Online Survey, NCCS Core Data Files, and BERC estimates
*Nonprofit data is from NCCS Core Files and BERC estimates. All other data is from IMPLAN database. **Output or business revenue represents all circulation of money in the regional economy. As a highly aggregate measure, it includes all trades, value added (GDP) and personal income.
*** Value added (GDP) is a widely used measure of economic activity. In the case of the nonprofit sector, we used the nonprofit revenue number as a proxy for both output (business revenue) and value added.
| 36 IV. Economic Assessment of the Nonprofit Sector in the Nashville MSA
As the previous chapter clearly establishes, the nonprofit sector in the Nashville MSA is already a sizeable sector. In this section, we explore the indirect and induced contribution of the nonprofit sector to the regional economy. For the analysis, we use the IMPLAN model created for the study region with data from BERC online survey results and NCCS Core Files. We explore three
concepts (economic impact, economic contributions, and economic contributions plus volunteering) along three major dimensions (direct, indirect, and induced effects). The process is summarized in the following chart.
IV.1. Economic Impact—Export Component
What is the meaning of economic impact? Economic impact refers to an economic activity’s net new contribution to the region in which the activity takes place. Some examples include a visitor from out of town spending money on a hotel/motel, a new manufacturing plant operating in the region, federal or out-of-region money flowing to an area to support a new program, or an activity that is unique in the region. Economic impact analysis is different from economic contributions or economic significance analysis in which we often counterfactually remove an institution, program, or event from an economy without determining whether that given institution, event, or program may be considered net new to the region. This section will analyze the
| 37
How is the direct economic impact figure determined? BERC used an online nonprofit survey to capture what percent of nonprofit revenue flows from sources outside the study region. This estimate gives a conservative figure regarding resource flow to the region from outside sources. Many nonprofit organizations may provide a unique service to the study-area residents. In certain medical fields, there may not be even close substitutes within the Nashville MSA. However, making an assessment of each organization’s unique contribution to the region is beyond the scope of this project. Therefore, as a conservative estimate, economic impact assessment in this study focuses on the amount of funding flowing to Nashville from other regions.
In reporting economic impact and economic contribution estimates, we follow the procedure outlined below:
(1)Business revenue (output) effect—direct, indirect (the effect of business-to-business interactions), and induced (the effect of employee spending of wages and salaries) by
nonprofit segment and major industries. These measures (indirect and induced) are also called the ripple effect. The business revenue effect represents all economic activities (i.e., trades, value added, income, taxes, proprietary income, etc.) associated with the activity. Therefore, this figure should not be aggregated with any other measures reported here.
(2)Employment effect—direct, indirect, and induced by nonprofit segment and major industries. (3)Labor income effect—direct, indirect, and induced by nonprofit segment and major industries. (4)Local and state taxes—total taxes by nonprofit segment.
In this context, it is also important to remember the major assumptions used for this section: (1) The study region is the Nashville MSA—13 counties in middle Tennessee.
| 38
(2) Only nonprofit organizations registered under 501(c)(3), 501(c)(4), and 501(c)(6) are included. As a further step, all churches are excluded.
(3) Only organizations with an annual revenue of $25,000 and above are included. (4) In the economic impact section, only the component of revenue flowing to the Nashville
MSA from outside sources is included.
(5) No further assumptions regarding the substitution effect, recapture rate, or any other attributes of nonprofit organizations have been made.
(6) Data sources are the NCCS Core Files for screening purposes and total nonprofit revenue and the BERC online nonprofit survey for an average percent of revenue flowing from outside the Nashville MSA.
(7) There may be a certain degree of discrepancy in data files in terms of number of establishments, revenue, expenditure, and employment, resulting from
a. the use of multiple databases; b. several levels of aggregation;
c. change in data year and impact year (for example, the NCCS Core Files are primarily for the year 2010-11; we deflated these numbers to 2011 to align with survey estimates).
Economic Impact by Segment
Business Revenue. Nonprofit organizations’ total economic impact in the Nashville MSA, measured as business revenue, is $6.12 billion (Table 6). This represents 4.37 percent of the Nashville MSA’s total output (business revenue) in 2011. In FY 2011, activities associated with the nonprofit
organizations accounted for $201.3 million in state and local taxes. Which segment’s impact is the largest? The education segment generated the largest economic impact among nonprofits with
| 39
nearly $3 billion in 2011. The critical player in this segment is Vanderbilt University. The health care segment is next with about a $2.1 billion economic impact on the Nashville MSA economy. For every direct dollar spent by nonprofit organizations, an additional $1.22 was created in the greater Nashville economy. This is primarily because much of the organizational spending in the education and health care segments is in the form of salary and wages.
Employment. What is the net employment impact of the nonprofit sector on the Nashville MSA economy? Table 7 highlights the economic impact estimates by nonprofit segment. The total employment impact of the nonprofit sector on the Nashville MSA economy is 72,095 jobs. This figure accounts for 7.27 percent of all jobs in the Nashville MSA. For every 100 direct nonprofit jobs, an additional 55 jobs are created in the Nashville MSA. The largest nonprofit segment by employment impact is health care with 29,700 total jobs (direct, indirect, and induced). The education segment follows closely with 28,863, and the human services segment occupies third place with 6,852.
Table 6: Economic Impact of the Nonprofit Sector in the Nashville MSA: FY 2011
Business Revenue
Nonprofit Segment Direct Effect Indirect Effect Induced Effect Total effect
Local & State Taxes
Arts $39,683,149 $19,316,635 $26,878,174 $85,877,958 $3,535,465
Education $1,310,940,945 $705,923,847 $956,379,657 $2,973,244,449 $101,188,726
Environment and Animals $9,777,700 $6,249,928 $6,715,991 $22,743,619 $675,171
Health Care $949,253,589 $422,234,559 $690,834,336 $2,062,322,485 $63,490,792
Human Services $226,570,996 $79,003,573 $162,589,964 $468,164,534 $16,689,400
International $10,742,518 $6,533,464 $7,642,243 $24,918,225 $740,276
Mutual Benefit $2,214,768 $879,112 $1,284,452 $4,378,332 $161,228
Public and Societal Benefit (Other) $206,997,235 $127,122,697 $140,706,160 $474,826,092 $14,766,879
Total Effect $2,756,180,900 $1,367,263,815 $1,993,030,977 $6,116,475,694 $201,247,937
| 40
Although some nonprofit segments have a lesser employment impact, in some cases this may be due to two issues related to the study’s methodology:
(1) many small organizations in the arts and other segments may be excluded because they do not satisfy the $25,000 income minimum, and
(2) many small organizations rely on volunteer labor to operate.
Wages and salaries. How much money do people earn because of the nonprofit sector in the Nashville MSA? Table 8 presents the extent of the wage and salary impact of the nonprofit sector on the Nashville MSA economy. In FY 2011, nonprofit sector–related economic activities account for $2.7 billion in wages and salaries, representing nearly 5 percent of the Nashville MSA’s total wages and salaries. For every dollar of direct wages and salaries, an additional $0.91 of wages and salaries was created in the Nashville MSA. Four major segments account for this sizeable impact on wages and salaries: education with $1.3 billion, health care with $0.93 billion, human services with $0.22 billion, and public and societal benefit with $0.19 billion.
Table 7: Economic Impact of the Nonprofit Sector in the Nashville MSA: FY 2011
Employment
Nonprofit Segment Direct Effect Indirect Effect Induced Effect Total effect
Arts 617 161 207 985
Education 16,310 5,201 7,352 28,863
Environment and Animals 408 49 52 509
Health Care 21,053 3,327 5,321 29,700
Human Services 4,992 608 1,252 6,852
International 862 53 59 973
Mutual Benefit 19 6 10 35
Public and Societal Benefit (Other) 2,155 942 1,082 4,179
Total Effect 46,415 10,347 15,334 72,095
| 41
Table 8: Economic Impact of the Nonprofit Sector in the Nashville MSA: FY 2011
Wages and Salaries
Nonprofit Segment Direct Effect Indirect Effect Induced Effect Total effect
Arts 18,102,408 7,562,948 10,272,002 35,937,357
Education 663,653,109 247,560,263 365,500,898 1,276,714,271
Environment and Animals 4,007,742 2,392,415 2,566,658 8,966,814
Health Care 491,930,869 168,576,145 264,014,411 924,521,425
Human Services 126,515,939 28,854,721 62,136,689 217,507,349
International 4,714,446 2,570,379 2,920,642 10,205,466
Mutual Benefit 864,284 361,384 490,879 1,716,547
Public and Societal Benefit (Other) 87,531,795 46,626,364 53,773,750 187,931,909
Total Effect 1,397,320,592 504,504,619 761,675,929 2,663,501,138
Source: BERC estimtes from IMPLAN regional model.
Chart 11: Total Economic Impact of the Nonprofit Sector: Distribution of Impact by Nonprofit Segment (%)
Arts 1.4% Education 48.6% Environment and Animals 0.4% Health Care 33.7% Human Services 7.7% International 0.4% Mutual Benefit 0.1% Public and Societal Benefit (Other) 7.8%
Business Revenue Impact (Total)
Arts 1.4% Education 40.0% Environment and Animals 0.7% Health Care 41.2% Human Services 9.5% International 1.3% Mutual Benefit 0.0% Public and Societal Benefit (Other) 5.8%
| 42 Economic Impact by Major Industries—Business Revenue. The largest sectors impacted by the nonprofit sector in the Nashville MSA (Table 9) are other services, health and social services, finance and insurance, educational services, real estate and rental, and professional-scientific and technical services.
Economic Impact by Major Industries—Employment. The results here are similar to the business revenue impact: the largest two major sectors are other services and health and social services. The educational services industry is in third place (Table 10).
Table 9: Business Revenue Impact of the Nonprofit Sector in Nashville MSA by Major Industries (FY2011)
Description Direct Indirect Induced Total
Total $2,756,180,902 $1,367,263,815 $1,993,030,977 $6,116,475,694 81 Other services $1,373,187,717 $30,622,572 $95,929,720 $1,499,740,009 62 Health & social services $661,759,138 $13,175,445 $357,862,878 $1,032,797,461 52 Finance & insurance $2,146,855 $348,038,449 $295,356,312 $645,541,616 61 Educational svcs $561,116,346 $23,527,412 $54,521,268 $639,165,026 53 Real estate & rental $1,035,581 $222,158,126 $361,096,666 $584,290,373 54 Professional- scientific & tech svcs $80,975,647 $189,039,570 $77,242,466 $347,257,683 56 Administrative & waste services $365,390 $150,412,550 $51,495,822 $202,273,762 51 Information $3,668,830 $118,521,650 $74,622,372 $196,812,852
44-45 Retail trade $0 $3,068,574 $191,909,868 $194,978,442
72 Accomodation & food services $4,778,294 $39,350,550 $96,438,594 $140,567,438
31-33 Manufacturing $0 $37,525,792 $86,444,539 $123,970,331
71 Arts- entertainment & recreation $62,994,297 $20,569,223 $28,602,362 $112,165,883
42 Wholesale trade $0 $21,879,452 $79,856,810 $101,736,262
48-49 Transportation & warehousing $3,146,595 $56,207,221 $42,249,504 $101,603,319 92 Government & non NAICs $0 $37,861,687 $48,500,066 $86,361,753
23 Construction $0 $21,683,911 $14,784,618 $36,468,529
55 Management of companies $0 $20,183,417 $16,252,252 $36,435,669
22 Utilities $1,006,211 $10,094,190 $13,186,262 $24,286,664
21 Mining $0 $2,441,133 $3,340,930 $5,782,063