ScholarWorks@CWU
ScholarWorks@CWU
All Faculty Scholarship for the College of the
Sciences College of the Sciences
5-2-2017
Visual Knowledge Discovery and Machine Learning for
Visual Knowledge Discovery and Machine Learning for
Investment Strategy
Investment Strategy
Antoni Wilinski
Westpomeranian University of Technology Boris Kovalerchuk
Central Washington University
Follow this and additional works at: https://digitalcommons.cwu.edu/cotsfac Part of the Computer Sciences Commons
Recommended Citation Recommended Citation
Wilinski, Antoni and Kovalerchuk, Boris, "Visual Knowledge Discovery and Machine Learning for Investment Strategy" (2017). All Faculty Scholarship for the College of the Sciences. 135. https://digitalcommons.cwu.edu/cotsfac/135
This Article is brought to you for free and open access by the College of the Sciences at ScholarWorks@CWU. It has been accepted for inclusion in All Faculty Scholarship for the College of the Sciences by an authorized administrator of ScholarWorks@CWU. For more information, please contact [email protected].
Visual Knowledge Discovery and Machine Learning
for Investment Strategy
Antoni Wilinski1, Boris Kovalerchuk2
1
Westpomeranian University of Technology, Faculty of Computer Science and Information Technology, 71-210 Szczecin, Zolnierska 49, Poland
2
Central Washington University, Dept. of Computer Science, 400 E. University Way, Ellensburg, WA 98926, USA
Abstract.
Knowledge discovery is an important aspect of human cognition. The advantage of the visual approach is in opportunity to substitute some complex cognitive tasks by easier perceptual tasks. However for cognitive tasks such as financial investment decision making this opportunity faces the challenge that financial data are abstract multidimensional and multivariate, i.e., outside of traditional visual perception in 2D or 3D world. This paper presents an approach to find an investment strategy based on pattern discovery in multidimensional space of specifically prepared time series. Visualization based on the lossless Collocated Paired Coordinates (CPC) plays an important role in this approach for building the criteria in the multidimensional space for finding an efficient investment strategy. Criteria generated with the CPC approach allow reducing/compressing space using simple directed graphs with beginnings and the ends located in different time points. The dedicated subspaces constructed for time series include characteristics such as Bollinger Band, difference between moving averages, changes in volume etc. Extensive simulation studies have been performed in learning/testing context. Effective relations were found for one-hour EURUSD pair for recent and historical data. Also the method has been explored for one-day EURUSD time series n 2D and 3D visualization spaces. The main positive result is finding the effective split of a normalized 3D space on 4x4x4 cubes in the visualization space that leads to a profitable investment decision (long, short position or nothing). The strategy is ready for implementation in algotrading mode.
Keywords: Visual knowledge discovery, cognitive algorithm, machine learning, multidimensional
visualization, investment strategies, collocated paired coordinates, algorithmic trading, time series prediction, artificial intelligence, big data, classification, forex.
1.
Introduction
While cognitive algorithms intend to mimic the functioning of the human brain for improving human decision-making often the scope of mimicking is not obvious. This is evident for the tasks with unclear human decision that must be mimicked. A market investment decision is one of examples with this difficulty due to complexity and uncertainty of the task and its high dynamics, i.e., a strategy that was correct at time t is not correct at time t+1. Thus for such tasks two stage cognitive algorithms are needed: stage (1) – mimicking good human decision process at the upper level, and stage (2) -- mimicking the functioning of the human brain to reproduce that good human decision. Both stages are active areas of research. This paper focuses on stage (1) for market investment decisions. The general
concept of dynamic logic for human decision at the upper level is presented in [Kovalerchuk, Perlovsky, 2012]. It includes the sequence of decision spaces and criteria from less specific to more specific. This concept is applied in this paper to the development of the investment strategy, where a lossless visual representation of n-D data serves as an initial form of the decision space and more specific is learned later using a machine learning technique.
Difficulties of defining investment strategy algorithmically are well documented in the literature [Kovalerchuk, Vityaev, 2000, Bingham, 2014, Li, Deng, 2009, Martin, 2001, Wilinski et al. 2014, Guo et al. 2014, Hoffmann, 2014]. One of them is multivariate and multidimensional nature of data that complicated both knowledge representation and discovery including: (1) identifying a class of predictive models (SVM, regression, ANN, kNN and so on) with associated trading strategies with parameters to be learned, and (2) analyzing multidimensional data with a naked eye to stimulate both intuitive discovery of patterns and formal models [Lian et al. 2015, Wichard, Ogorzalek, 2004]. The most efficient strategy should take into account the proper balance between both directions of investment (long and short positions) typical for foreign exchange markets (the pair EURUSD belongs to them). The best utilization of the market potential will be reached when numbers of both long and short positions taken are comparable. The methodology proposed in this paper allows the adaptation of the strategy presented in this paper to this symmetry of market.
The goal of this work is finding visualization-inspired investment strategy using multivariate and multidimensional data. One of the main conclusions is that the lossless Collocated Paired Coordinates (CPC) approach [Kovalerchuk, 2014, 2016] is an effective instrument for such inspiration in the synthesis of the investment strategy.
The steps of CPC are:
(1) representing a normalized to [0,1] n-D point x=(x1,x2,…,xn-1,xn), e.g.,=(0.3,0.1,0.4,0.7, 0.2, 0.9) as
a set of pairs (x1,x2),…,(xi,xi+1),…,(xn-1,xn);
(2) Drawing orthogonal Cartesian coordinates (X1,X2),…,(Xi,Xi+1),…,(Xn-1,Xn) on the plane;
in way that all odd coordinates are collocated as a single horizontal axis and all even coordinates are collocated as a single vertical axis
(3) Drawing each (xi,xi+1) in respective orthogonal Cartesian coordinates (Xi,Xi+1) on the plane;
(4) Connecting points by arrows to form a graph x*: (x1,x2)→ (x3,x4)→ (x5,x6)…→(xn-1,xn).
This graph x* represents n-D point x in 2-D losslessly, i.e., all values of x can berestored. Thus this visualization is reversible representing all n-D data without loss of them. For the odd n the last pair is (xn,xn) or (xn,0).
For 3-D visualization, the pairs are substituted by triples (x1,x2, x3),…,(xi,xi+1, xi+2),…,(xn-2,xn-1,xn). If n
is not divisible by 3, e.g., n=7 or n=8 then for n=7 we have triples (x1,x2,x3), (x4,x5,x6), (x7,x7,x7) or
triples (x1,x2,x3), (x4,x5,x6), (x7,0,0), and for n=8 we have triples (x1,x2,x3), (x4,x5,x6), (x7,x8,x8) or
triples (x1,x2,x3), (x4,x5,x6), (x7,x8,0).
Pairs of variables (xi, xi+1) for time series can be sequential pairs of values at time t and t+1. In this
way a 4-D point x can be formed as (vt, yt,vt+1,yt+1), where v is volume and y is profit at two
consecutive times t and t+1. Respectively a 4-D point (vt, yt,vt+1,yt+1)will be represented in 2-D as an
arrow from 2-D point (vt,yt) to another 2-D point (vt+1,yt+1). This simple graph fully represents 4-D
data. It has a clear and simple meaning the arrow going up and to the right indicates the growth in both profit and volume from time t to t+1. Similar interpretations have other arrow directions. To make
visualization more clear the time pairs starting from odd time t are visualized separately from time pairs starting from even time t. This allows a better observation of the beginnings and ends of events. Similarly a 6-D point x can be formed as (vt,dMAt,pt,dMA,t+1,vt+1,pt+1), where dMA is the difference
between the moving averages for some windows. Respectively this 6-D point will be represented in 3-D as an arrow from 3-3-D point (vt,yt, dMAt) to another 3-D point (vt+1,dMA,t+1,yt+1). This simple graph
also fully represents 6-D data with a similar clear meaning—the arrow going up and to the right indicates the growth in all three attributes: profit, dMA, and volume from time t to t+1. Several figures
below such as figures 5-9 and 16-18 show and use this visualization. To shorten notation for the spaces in this paper we will use notation like (Yr,Vr) instead of (Yrt,Vrt,Yr,t+1,Vr,t+1), and (Yr,dMAr,Vr),
instead of (Yrt,Vrt, dMArt,Yr,t+1, dMAr,t+1,Vr,t+1) where index r stands for normalized profit, volume and
dMA. Thus, 2-D and 3-D notations (Yr,Vr) and (Yr,dMAr,Vr) will represent 4-D and 6-D spaces,
respectively.
The general CPC concept can be applied also more generally for time series of pairs of variables v and y. Consider consecutive time moments t, t+1,…,t+k-1 and a 2k-D point
x = (vt, yt, vt+1, yt+1,vt+2,yt+2,…,vt+k-1, yt+k-1),
where v is volume and y is profit as before. This 2k-D point is represented in 2-D as a directed graph (path that starts in 2-D point (vt, yt,) and ends in 2-D point (vt+k-1, yt+k-1). This graph fully represents
2k-D data. In this general case the path that is going up and to the right indicates the growth in both profit and volume from time t to t+k. Collocated Paired Coordinates belong to the class of General Line Coordinates (GLC) that open also other opportunities to represent n-D data visually [Kovalerchuk, 2014, 2016].
This paper is organized as follows: section 2 presents the stages of the process, section 3 presents a visual method for building an investment strategy using 4-D data in 2D space, section 4 reports results of investigation in 2D space, section 5 reports results of investigation of 6-D data in 3D space, and section 6 concludes the paper with its summary and the outline of the future research.
2.
Process of preparing of the strategy
2.1. Stages of the process
The first stage of the process is selecting features/indicators from the time series to prepare the
variables for creating the multivariate space. The selected features should meet some conditions related to correlation [Hellwig, 1969]. We selected the features from many well-known indicators such as Bollinger Bands (BB), difference between moving averages (dMA), volume (V). Some of them were transformed to derivatives of the base indicators such as difference between current and previous Volume (dV), current relative value of the observed variable Yr and others. This catalogue is open for
modification and expansion in case of the insufficient accuracy of prediction.
The selected features/indicators are derived from time series with the same frequency of sampling as underlying instrument. In this paper it is 1 hour EURUSD pair. All indicators are normalized to [0,1], excluding BB due to the nature of this indicator.
The second stage is finding good spaces (Yr,Pr) or (Yr,Pr1,Pr2), where Yr is the main relative
normalized outcome in time series, Pr1, and Pr2 are indicators used for space creating, e.g., Pr1, Pr2
belong to {Br, Vr, dVr, dMAr, etc}. The relative variables with index r are normalized. Inside the
spaces the process is looking for areas or subspaces such as squares, rectangles, cubes or cuboids where the number of profitable events prevails. The event is profitable if it signals to open long or short position in this point of the space and at this time. The areas with big asymmetry between the number of long and short positions are considered as promising from investment strategy point of view. Such asymmetric areas are identified in two steps: (a) by visual and analytical discovery in the CPC space, and (b) by a machine learning process of verification on testing data.
The third stage is testing and verifying the strategy by constructing a cumulative profit curve. The
curve with a significant profit and a small variance (e.g., with appropriate Calmar ratio for evaluating risk) is used as a measure of success of the algorithm along with comparison with the result to typical benchmarks.
2.2.Variables
Below we list the variables used in this study that include the main outcome and its features/indicators. The main outcome variable is Yri =(Yi-Ymin i )/(Ymax i -Ymin i). This is relative position of Close value
Y(i) of current candle normalized to [0 , 1] between min and max of last kb candles, where kb is a
parameter of the strategy (in the first experiment presented below kb=120), where ic is the current
value of index i and
Ymax i=max(Yi); for i=ic -kb … ic
Ymin i =min(Yi ); for i=ic -kb … ic .
The six indicators are listed below.
1) The relative value of position Y(i) with respect to Bollinger Band is denoted as Br,
Br(i)=(Y(i)-Bd(i))/(Bup(i)-Bd(i)). Y(i) can be out of this normalized Bollinger Band range
[0,1]. Here Y(i) is the Close value of i-candle in the time series in i-time, and the Candle is a vector of 4 values known as OHLC,
Ymax(i)=max(Y(i-kb:i)),
Ymin(i)=min(Y(i-kb:i)),
kb is the number of candles back to calculate relative variables;
BBd(i)=MAb(i)-kBb⋅Stb(i),
MAb(i)=mean(Y(i-Bb:i) is the average value of last Bb Closes, and
Stb(i)=std(Y(i-Bb:i) is the standard deviation for last Bb-candles.
2) Relative Volume, Volr, is the measure of the position of current Volume between the min and
max of Volume within the determined number of last candles (here it is kb candles). Volume
is a measure of how much of a given financial asset has been traded in the current period of time. In the experiments EURUSD 1h series was used, thus the period for volume observation is one hour.
3) The difference between moving averages, dMAr, where
dMA(i)=MAf(i)-MAs(i),
MAf(i)=mean(Y(i-f:i-1)) is moving average with f-parameter
MAs(i)=mean(Y(i-s:i-1)),
f and s are the numbers of candles to calculate moving averages. For the first experiment f=5 (“fast”), and s=28 (“slow”),
dMAmax(i)=max(dMA(i-kb:i));
dMAmin(i)=min(dMA(i-kb:i)).
4) Relative return, rr,
rr(i)=(r(i)-rmin(i))/(rmax(i)-rmin(i)),
where
rmax(i)=max(r(i-kb:i)) is return max in last kb=120 candles,
rmin(i)=min(r(i-kb:i));
r(i)=Close(i)-Close(i-1),
Close is the last value in i-candle OHLC.
5) Relative difference between real value of Y and its prediction, dyr. Prediction is performed
with a linear regression model. dyr(i)=(dy(i)-dymin(i))/(dymax(i)-dymin(i)).
Here
dy(i)=Close(i-1)-ynext(i);
ynext(i) is the prediction in i-Close based on linear regression;
dymax(i)=max(dy(i-kb:i));
dymin(i)=min(dy(i-kb:i)).
6) First derivative dVr of the Volume, V. It is also a relative variable:
dVr(i)=(dV(i)-dVmin(i))/(dVmax(i)-dVmin(i)).
Here
dV(i)=Vi-1-Vi-2,
dVmax(i)=max(dV(i-kb:i)),
dVmin(i)=min(dV(i-kb:i)).
2.3.Analysis
The analysis involves three important parameters: f (numbers of candles to calculate fast moving averages), s (numbers of candles to calculate slow moving averages), and kb (number of “back”
candles). Additional parameters include Stop Loss that is popular in the broker platforms mechanism to avoid big losses. The variable Yr and every variable from a set S= {Br, Vr, dMAr, rr, dyr, dVr} are
used to create 2-D spaces such as (Br, Yr), (Vr,Yr) and so on.
Considering the variables as traditional time series allows us to compare each pair (Pr,Yr) as shown in
fig.1, where Pr is one of the variables from the set S. In fig. 1 it is the first pair. This figure shows a
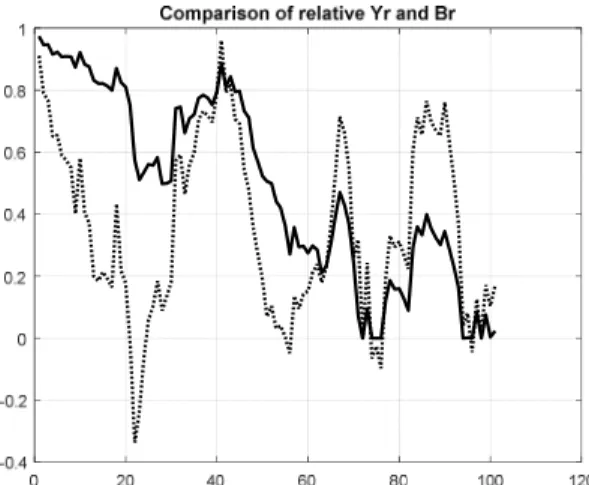
small part of time series (100 one-hour candles of EURUSD). It allows observing a modest correlation with the correlation coefficient equal 0.49 that can be a potential source for a trading strategy rule. Figures 2 and 3 show far worse situations for finding patterns to construct a trading strategy with correlation coefficients only from 0.055 to 0.15.
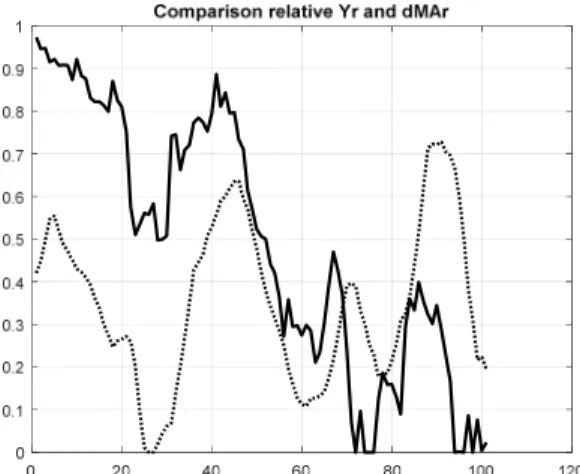
Among other indicators from S only dMAr has a modest correlation coefficient (0.45) with Yr. See
fig. 4. For other pairs the coefficients are much smaller. The visualization of relations of observed variable Yr with variables Vr or dMAr in fig. 1 and fig.4 allows getting a preliminary idea for
classification of variables on promising and not promising by observing the actual position of correlated variables. However, even for these two selected pairs of variables, it is hard to expect building an efficient trading strategy using these relatively low correlations. Surely we cannot base high prediction accuracy expectations on these weak correlated variables.
Fig. 1. Comparison of two time series: relative outcome Yr and relative position of Y(i) inside Bollinger Band (dotted).
Fig. 2. Comparison of two time series: relative outcome Yr and relative returns after every Y(i) (dotted) for one hundred candles.
Fig. 3. Comparison of two time series: relative outcome Yr and relative volume (dotted) in every one hundred period.
Fig. 4. Comparison of two time series: relative outcome Yr and relative difference between two moving averages dMAr (dotted) for one hundred candles.
In this paper we attempt a quite different way for finding a relation between the selected variables in spite of such relatively low correlation. This way is based on the Collocated Paired Coordinates.
2.4.Collocated Paired Coordinates Approach
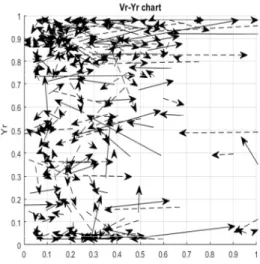
Fig. 5 shows some arrows in (Vr,Yr) space under the CPC approach. This is also a fragment of two
time series such as shown in fig. 3: relative volume Vr and relative main outcome variable Yr. Fig. 3
shows time series in a classical form with time as an independent variable. Fig.5 has no time axis. The time is represented by arrow direction. The beginning of the arrow shows the first point in the space (Vr i,Yr i ), and the head of the arrow shows the next point in the same space (Vr i+1,Yr i+1 ). Fig.5 shows
the inspiration idea for building a trading strategy in contrast with fig. 3 where we do not see it.
Fig. 5. Some examples of arrows which show points of two time series, Yr and Vr
Fig.5 allows finding the areas with clusters of two kinds of arrows. The arrows for the long positions are solid (green) arrows, for the short positions, are dotted (red). Along the Yr axis we can observe a
type of change in Y in the current candle. Due to the fact that if Yr i+1>Yr i then Yi+1 >Yi the proper
decision in i-point would be a long position opening. Otherwise, the best decision in the point would be a short position. Additionally, fig. 5 shows how effective will be a decision in the positions. If the arrows are very horizontal the profit will be small and more vertical arrows indicate the larger profit.
Fig. 6. The arrows represent open positions long (solid line) and short (dotted) in the space (Vr,Yr) (relative volume – relative observed variable).
In comparison with traditional representation in the time series domain, the proposed method brings the additional knowledge about the potential of profit in selected area of parameters (in fig.5 it is (Vr,Yr) space).
Fig. 6 shows multiple arrows for 500 candles period. It shows only candles for even i-candles, denoted as even candles. The arrows for odd candles (odd i) can be visualized in the same way. This separation simplifies visualization. In contrast presenting even and odd candles together will show them connected which will mute the visual pattern. Fig. 7 shows a part of the set arrows from fig. 6. This set includes only more vertical arrows such that, |Yr i+1-Yr i| > h=0.05. Variable h can be a parameter of
future strategy and can have another value. Fig 7 is much more readable and may inspire a trading strategy development more efficiently demonstrating the power of CPC visualization.
While arrows indicate well the increase and decrease in values, another notation in CPC space is also beneficial in cases where the beginnings of the CPC sections are more important than ends. In these cases we use special pins (section with circle at the beginning) instead of arrows.
Fig. 8 shows the pins in (Br,Yr) space with condition Yr i-1 >Yr i only. It is the condition for opening
short positions. It is result of simulation for 500 candles period for even candles only. Here we see the advantage of the dividing candles to even and odd sets. Otherwise, we would have the circle in every contact point between two nearest sections and it will be impossible to recognize the end and the beginning of the pins. In this section, the data from the same EURUSD 1h time series are used for both arrows and pins. The particular used interval with 500 candles is not specific for the method. The objective is to explain the idea of using CPC on any number of candles and intervals. For another interval with the same or another number of candles, the distribution of pins or arrows will be different but the algorithm will search asymmetric areas in the same way.
Fig.7. Subset of arrows from fig.6. Arrows are more vertical.
Fig.8 Example of pins in Br –Yr space for even candles with conditions Yr i-1 >Yr i with suggestion to open short positions
The pins with the circles have an important advantage of observing the clusters of the beginnings of the pins (circles) to determine the best places in the space (Br,Yr ) for opening a long or a short
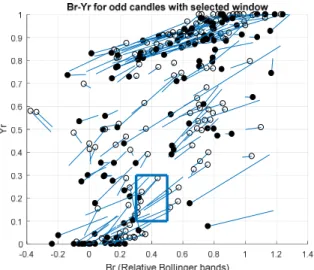
position. For example, fig. 9 shows a rectangle with more empty circles than the filled ones. This leads to the rule: if the next point of time series is exactly in this area, then open a short position.
Fig. 9. Pins in (Br,Yr) space for both directions – long (filled circles) and short positions (empty circles).
It gives an idea how to create an investment strategy - looking for areas with big asymmetry between filled and empty circles, i.e., between suggestions of long and short positions. Note that these areas are changing over time and need to be updated regularly. At first glance arrows in fig. 6 and fig.8 are chaotic without a useful pattern. This situation is quite common in visualization of complex data. It is a strong inspiration for combining a pure visual technique with analytical computations for searching the subsets with big asymmetry. In this case the CPC 2-D or 3-D visual representation opens an opportunity for an analytical discovery of interesting patterns in this low dimensional CPC visual space. In general the combination of analytical and visual means is a core idea of the visual analytics methodology [Keim at al., 2008].
3.
Visual method for building investment strategy in 2D space
The main idea is to find a place in 2-D representation of 4-D (Pr ,Yr ) space where asymmetry between
number of suggestions to open long position (filled circles) and short positions (empty circles) is high (as in the rectangle in fig.9). In the experiments we used a rectangle or a square in 2D space and a cube or a cuboid in 3D space. Consider rectangle R(ic,jc), where ic, jc are the coordinates of its center
with the following properties.
a) For positive long position asymmetry Al :
Property 1:
(ic,jc) = argmax Al (i,j)
where
Al (i,j) =nl(i,j)/(nl(i,j)+ns(i,j)) , i=il, il+1, il+2, … ir ; j=jb , jb+1, jb+2 , …, jt
nl(i,j) – number of suggestions to open long position in the (i,j) area (number of filled circles);
ns(i,j) – number of suggestions to open short position in the (i,j) area (number of empty
circles);
il – left barrier for the area; ir – right barrier for the area ; i has increment 0.1;
Property 2:
(nl+ns) > nmin; where nmin is the minimal threshold number of the events (circles) in the
rectangle. We used nmin=5 in our simulations in the 2D representations to make the
conclusions more robust.
b) For positive short position asymmetry As
Property 1:
(ic,jc) = argmax As (i,j)
where As (i,j) =ns(i,j)/(nl(i,j)+ns(i,j)) , i=il, il+1, il+2, … ir ; j=jb , jb+1, jb+2 , …, jt;
and other notations are the same as in a). Property 2:
(nl+ns) > nmin; where nmin is minimal number of the events (circles) inside the rectangle to
consider this rectangle; in our simulations in 2D spaces there was nmin=5;
For a rectangle with its center in (ic,jc) circle c(Pr , Yr ) belongs to this rectangle when
Pr > ic -w/2 and Pr < ic =w/2, where w=0.2 is the width of the rectangle; Pr ∈ {Br, Vr, dVr,
dMAr, etc}. Yr > jc -h/2 and Yr < jc =h/2, where h=0.2 is the width of the rectangle; YrЄ [0 ,
1].
While in general the optimal rectangles for long and short positions are different here we defined a simplified case. The general concept of the first strategy is to find a rectangle with properties 1 and 2 in the learning mode of the algorithm and then test them in the test mode, i.e., test the algorithm when in current candles the parameters of time series c(Pr , Yr ) are
located in the best areas with coordinates (ic,jc).
4.
Results of investigation in 2D space
All the 4-D spaces based on pairs (Br ,Yr ),(dMAr,Yr), (Vr , Yr), (dVr , Yr), (rr , Yr), (dyr , Yr ) have been
investigated. We considered from 300 to 800 candles for space (Br, Yr ) separately for even and odd
candles and found the best area (rectangle or square in the space) relative to the properties 1 and 2 as a pattern for the investment strategy, i.e., with a large asymmetry between suggestions for opening long and short positions. Fig. 9 shows the rectangle found for short positions with As =ns/(nl+ns) =0.83 and
parameters: (ic,jc)=(0.4, 0.2), w=0.2; h=0.2; nl=1;ns =5. The found rectangle for long positions has
much less Al=nl/(nl+sl)=0.56 with parameters (ic,jc)=(0.4, 0.2), w=0.2, h=0.2, nl=9; sl=7. These
rectangles were used 500 times for profit simulation for the even candles in series from 300 to 1300 of candles (learning period) and the same rectangle was used for testing period from 1301 to 2300 candles. For every (Br,Yr) that happens in this rectangle a short position was opened. The cumulative
Fig. 10. Cumulative profit for long position which were opened based on optimal rectangle in the space (Br,Yr)
Fig. 11. Cumulative profit for short position which were opened based on optimal rectangle in the space (Br,Yr)
The profit for short positions in fig.11 is much higher than in fig. 10 for the long positions which is consistent with As and Al values. The cumulative profit is shown in fig.12 for both sides. The data
from 300 to 1300 candles are responsible for learning period, the next candles from 1301 to 2300 for the test period.
Usually an optimal relation between the periods is found by the search algorithms [e.g., Wilinski A. et all. 2014, Wilinski A., Zablocki M. 2015]. Typically it results in the training period that is much longer than the test one. The first two experiments resulted in a much better split on the training and test periods, which is with the same numbers of candles. The results of initial test guides determining the test period duration. If the result is like in fig.10 then the reduction of the test period makes sense, otherwise its extension is justified.
Fig. 12. Cumulative profit for strategy in (Br,Yr) space for both sides (long and short) of the market.
Fig. 13. Cumulative profit for strategy in (Vr,Yr) space for both sides (long and short) of the market.
The next simulation experiment was conducted for the space (Vr,Yr) (relative volume, relative values
of observed variable Y). The result with a cumulative curve is shown in fig. 13. We obtained the same positive result in the final point of the time series for the other indicators listed above.
In the next experiment we joined all rules, for all indicators. The following relative indicators were used: Br, Vr, dyr, rr, dMAr, dVr. The result of the simulation is presented in fig. 14. The simulation was
performed for arbitrarily determined parameters specified above such as kb, s, f, SL, kw … etc. The
future studies will include looking for optimal values of parameters in a fixed period of time series and also for a proper balance between accuracies in learning and testing periods.
Commonly in financial machine learning the test period is shorter than the training one [e.g., Wilinski A., et. al. 2014, Wilinski A., Zablocki M. 2015]. Fig.14 shows significantly increasing profit in the test period with the same length of both training and test periods in this interval of the market data. In another interval of time series other ratios between length of training and test data need to be learned in the same way.
Fig.14. Cumulative profit for several spaces together
Fig. 15. Considered part of 1h EURUSD time series
In this study we analyze profit in normalized units: price interest points (pip) and PPC (Profit per candle). A pip indicates the change in the exchange rate for a currency pair. We assume one pip as 0.0001 USD in the pair EURUSD that is used as a measurement unit of change.
Profit per candle (PPC) represents the difference between values of cumulative profit at the end and the starting point of the period divided by the number of candles in the period. PPC=(Profitend -
Profitbegin) / (iend - ibegin) where iend , ibegin numbers of considered candles (here – one-hour candles). The
end result is equal to 1371 pips in 2000 candles with PPC equal to 0.68.
The result in fig. 14 is very positive: the Calmar ratio is equal 6.60 for the learning period and it is 2.94 for the test period from 1300-2300 candles. Calmar ratio [Young, 1991] is one from many criteria which evaluate trading quality. It is especially useful for long term simulations and performances. “Calmar ratio of more than 5 is considered excellent, a ratio of 2 – 5 is very good, and 1 – 2 is just good” [Main, 2015].
Next in this section we compare the above result with a common benchmark for the time series of 1h EURUSD in the same period of 2000 candles from February 2, 2012 to May 31, 2012. The chart of the pair is shown in figure 15 below. Another period will be explored in the next section.
The popular benchmark Buy and Hold strategy (only one long position is opened at the beginning) for the considered part of time series provided the negative gain is -0.0771 (loss of 771 pips. The potential maximum possible profit for the 2000 candles is equal to 1.9388 (19388 pips). It is sum of all possible long positions (when y i+1 >y i) open for one-hour period and all possible short positions (otherwise).
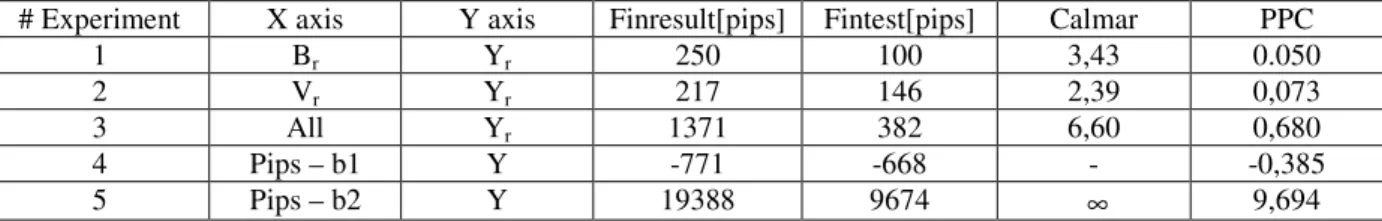
To obtain this absolute result one should have the foreseeing knowledge like God. Note that the result from the first strategy 0.1371 is equal to about 7.1 % of this theoretical maximum profit. The comparison of all considered strategies is presented in table 1. Its columns show final results for learning and test periods jointly and the result for test period only. The column with Calmar ratio presents a level of risk in the strategy and column PPC shows Profit Per Candle in pips. The column Finresult show the full profit reached in both learning and test periods and in column Fintest shows profit from test period only.
The table 1 allows comparing three considered strategies presented above in figures and two benchmarks. In the table 1 “b1” denotes the first benchmark (Buy&Hold); “b2” denotes the second “ideal” benchmark with no losses. For b2 the Calmar ratio is infinity because there is no drawdown in this case. The most interesting result is #3 with all indicators from set S.
The Buy&Hold benchmark (row #4) has no chance to be competitive with our strategies because of decreasing trend in the studied period. Of course one can find another specially prepared period for the Buy&Hold strategy (with increasing trend). In contrast, the strategy proposed in this paper should work everywhere including - for both trends.
The second benchmark b2 is the theoretical ideal result which absolutely no one can reach. The first and the second strategies give us small PPC to be considered as valuable strategies. Later we compare strategy #3 with the results of experiments in 3D spaces presented in the next section.
Table 1. Comparison of the results of different strategies in 2D spaces
# Experiment X axis Y axis Finresult[pips] Fintest[pips] Calmar PPC
1 Br Yr 250 100 3,43 0.050
2 Vr Yr 217 146 2,39 0,073
3 All Yr 1371 382 6,60 0,680
4 Pips – b1 Y -771 -668 - -0,385
5 Pips – b2 Y 19388 9674 ∞ 9,694
5.
Results of investigation in 3D space
5.1.Strategy based on number of events in cubes.
The next idea is exploring effective areas (cubes and cuboids) in 3D space that will represent 6-D data. Each space includes Yr (as main axis to observe the outcome of time series) and two indicators from
set S={ Br, Vr, dyr, rr, dMAr, dVr} in consecutive time periods. The first attempt was made with (Yr , Vr , dMAr ) space. This normalized space was split into 10x10x10=1000 cubes of size 0.1×0.1×0.1. 500 events have been used to locate “circles” or arrows in these 1000 small cubes for the same period of time series as previously (from 300-1300 candles) separately for even and odd candles.
The simulation had shown that many cubes are empty and it makes sense to modify a condition on the minimal number of circles in a cube. In this experiment we started with the limit of 5 circles, Tmin=5.
Fig.16 shows two marked cubes (filled circles for suggestions to open long positions and empty circles for short positions).
Fig. 16. Two cubes found in (Yr,dMAr,Vr) space with the maximum asymmetry between long and short positions.
Fig.17. The zoomed cubes with the best asymmetry from fig. 16. The upper cube with filled black circles is selected for long positions lower cube with empty circles is for short positions. For better visibility the viewpoint is changed from Fig 16.
The grid resolution (1000 cubes) seems to be too fragmented for a good generalization. The next attempt was made with a new grid 5×5×5=125 cubes of size 0.2×0.2×0.2. Fig 18 shows the two cubes with largest asymmetry factor, which were found by the Matlab program. These cubes provide the positive prediction value in terms of the confusion matrix with the accuracy TruePositive/(TruePositive+FalsePositive)) equal to 0.619 (for long positions) and 0.686 (for short positions) with a threshold Tmin =10 on the number of circles required in the cube.
Fig.18. Two determined cubes in Yr-dMAr-Vr space with the maximum asymmetry between long and short positions for the new grid resolution.
Fig.19. Cumulative profit based on algorithm with maximum level of Al or As
The same algorithm was used in both grid cases (10×10×10 and 5×5×5) to find cubes with maximum of criteria Al and As in cubes with an additional requirement on the minimum number of the circles in
the cube to be no less than Tmin. After these two best cubes have been found in the learning period the
proper positions are opened when subsequent events are located in the cubes. Fig. 19 presents the cumulative profit for 5000 candles in learning period and 1700 candles during testing. The presented profit is not too rewarding because of small number of positive events. While formally here Calmar Ratio equals to infinity generally the strategy is extremely careful. For example we can see here the period of almost 3000 hours (between #1200 and #3900) with no trade. The profit of 149 pips in fig.19 is only 0.022 per candle (compare to tab.1) indicates the need in a more dynamic strategy.
5.2.Strategy based on quality of events in the cubes.
The next approach is an algorithm with different criteria. It uses the sum of returns accumulated in the learning period. Fig. 6 above shows a lot of arrows with solid stems (long positions) and dashed stems (short positions) which are located with different angles in the 2D space. The more vertical arrows are
also more promising in profit (independently of the direction) due to the design of this space. Fig. 7 shows arrows with more vertical stems. Therefore a new hypothesis for a potential strategy is that the more vertical arrows lead to higher profit. This is reflected in a new criterion for the learning period which is the value of the projection of the arrows on Yr axis only. The projection value is Yr i – Yr i-1
that is a normalized value of Y i – Y i-1. More formally, consider a cube indexed by (k1, k2, k3) in the
space (P1 , P2 ,Yr) in a 3D grid, where k1, k2 k3 = 1, 2, … K. We are interested in maximum of criterion
Cl for long positions and Cs for short positions:
Cl (k1,k2,k3) = ∑ (Yr i (k1,k2,k3) – Yr i-1 (k1,k2,k3) )
when (Yr i – Yr i-1 )>0 for all i that belong to a learning period and for all cubes (k1, k2, k3) and
Cs (k1,k2,k3) = ∑ (Yr i (k1,k2,k3) – Yr i-1 (k1,k2,k3) )
when (Yr i – Yr i-1 )<0 for all i that belong to learning period and for all cubes (k1, k2, k3). Recall that
the beginning of the arrow (Yr i-1) belongs to (k1, k2, k)-cube belongs, not its head. For each learning
period, the sums Cl (k1,k2,k3) and Cs (k1,k2,k3) are computed in every (k1, k2, k3)-cube.
A new investment strategy is if Cl dominates, then open a long position else open a short position.
Fig.20 shows the bars that represent the criteria C1 and Cs (by their length) in every cube (in grid
4×4×4). The bars have different lengths. A visual strategy can be based on this difference, e.g., if one of the bars is longer than the other one, then open a proper position:
Cl (k1,k2,k3) > Cs (k1,k2,k3) + dc then open long position,
Cs (k1,k2,k3) > Cl (k1,k2,k3) + dc then open short position,
where dc is additional difference for Cl and Cs to make the difference more distinct. This strategy has
been checked for different values of periods of learning and testing, i.e., bars have been generated for the test data and compared with bars for the training data, because for the test period in every i-candle the (k1, k2, k3) cube can be different.
Parameters (f, s, kb) have noticeable influence on the result of every simulation. Fig.21 shows some
curves of cumulative profits as functions of (f, s, kb). The thicker line is the best one relative to the
value of a linear combination of the cumulative profits for learning period and Calmar ratio in the same learning period. For selecting the promising curve the following criterion is used:
C=wc ⋅Calmarlearn + wp ⋅profitlearn
where:
wc is a weight of Calmar component (in these experiments wc= 0.3);
wp is a weight of profit component (in these experiments wp=100 for 500 hours of learning
period);
Calmarlearn is the Calmar ratio at the end of learning period;
profitlearn is a cumulative profit at the end of the learning period measured as a change in
EURUSD rate.
The main idea in constructing the criterion C is to balance Calmar and Profit contributions. We tried to examine some pairs of weights (wc , wp)but this one mentioned above gave us the result we can see
below. Here the authors apply the principles of heuristic – the approach is simple and the results are satisfactory. Fig.21 presents the results of simulations for learning periods of 200 candles and test periods of 50 candles. Fig.21. shows that while the thicker line (best in criterion C) provides one of the top results (profits) it does not provide the best cumulative profits at the end of learning period due to the weighting nature of criterion C that also takes into account the Calmar ratio.
Fig.21. Cumulative profits for different values of parameters (f,s,kb).
Figures 22-27 show cumulative profits for different learning and testing periods as a function of 20 shifted datasets (cycles). The design of these cycles is illustrated in fig. 27. First the best values of parameters (f, s, kb ) were found by optimizing them on training data and then these values were used
in the test period which follows the learning period. The charts in figures 22-24, but fig. 25-26, show very efficient final result taking into account the profit-risk relation. Profit is represented by its PPC value. Practitioners consider the profit at the level of 10-20 pips per day as very high or even unrealistic to be stable [Krutsinger 1997; Pasche 2014]. The general conclusion is that the chosen space (Yr,Vr , dMAr) is very efficient.
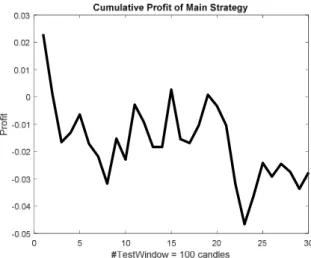
Fig.22. Cumulative profit for main strategy with learning windows of 100 candles and test widows of 10 1h-candles (Calmar ratio ~ 29, PPC=0.80).
Fig.23. Cumulative profit for main strategy with learning windows of 100 candles and test widows of 24 1h-candles (Calmar ratio ~7, PPC=0.78).
Fig.24. Cumulative profit for main strategy with learning windows of 500 candles and test widows of 100 1h-candles (Calmar ratio ~ 8.8, PPC=0.47).
Fig.25. Cumulative profit for main strategy with learning windows of 1000 1h-candles and test widows of 200 1h-candles (Calmar ratio~-0.72. PPC = -0.18).
Fig.26. Cumulative profit for main strategy with learning windows of 1000 1h-candles and test widows of 100 1h-candles (Calmar ratio ~-0.76, PPC=-0.21).
Fig.27. Selection of learning and testing periods
0 2 4 6 8 10 12 14 16 18 20 #TestWindow = 200 candles -0.12 -0.1 -0.08 -0.06 -0.04 -0.02 0
Fig. 22 – 24, 28, 29 are to show general direction of changes in cumulative profit. It is important that y-axes have different scales and should not be compared directly.
Fig. 27 shows how a set of learning periods have been generated for selecting a period that provides the best result at its end. At every learning period, multiple simulations were run with the different parameters. The parameters of the winning learning period are used in the test period to evaluate the efficiency of the optimized parameters in the investment strategy.
5.3. Discussion
The chosen space (Yr , Vr , dMAr ) is the most efficient from explored options from set S= {Br, Vr,
dMAr, rr, dyr, dVr}. Below we discuss characteristics of this space to clarify the impact of parameters f, s
and kb on profit and risk stabilization. Many experienced traders try to find the best universal values
for their indicators [Krutsinger, 1997, Bingham 2014, Fong et al. 2005, Cheng et al. 2012, Mehta, Bhattacharyya, 2004, Fong, Yong, 2005, Wilinski, Zablocki 2015]. Fig. 28 shows the cumulative profit for one of our simulations with constant values of these parameters, f=6, s=20, kb=150 for the
pair learning/test periods 200/100 of one-hour candles. While the chart in fig. 28 starts with values of the parameters that are optimal for the first learning period with high profit value, it shows the significant profit decline for the next periods. This leads us to the conclusion that the desire for stable “universal” parameters has no ground. The markets are under permanent volatility.
Fig.28. Cumulative profit for main strategy with learning windows of 200 candles and test widows of 100 1h-candles (Calmar ratio = 0.39) for constant parameters, f=6; s=20; kb= 150.
Multiple figures above present examples of cumulative profit visualizations. Even a novice usually can estimate a quality of different strategies looking at these visualizations, For instance, the advantage of the curve in fig. 24 over the curve in fig.28 is evident without any formal measurement. Next we explored other aspects of the method by checking the strategy on more recent data with newest candles and different sampling. Fig. 29 shows simulation with one-day candles.
Fig.29. Cumulative profit for the strategy in 1d EURUSD time series with 5-days testing windows and 30-days learning windows in 20 periods, Calmar ratio=7.69; PPC=23.83 pips; delta=0.05.
The result is also very positive. Additionally we can notice that the learning period is equal to about one month and the testing period is a one-week period (five trading days). These are very convenient circumstances for both automatic and manual trading.
The last experiment was carried out on a much larger periods of data of 80 cycles (windows of shifted sets of training and testing data) with each learning period of 500 one-hour candles and each test period of 100 one-hour candles (fig.30). Fig. 30 shows that the cumulative profit has one period within 25-30 cycles with declining values of profit, but the total results are very positive. While we use measurable objective criteria of success (Calmar ratio and PPC) human perception of success is also important to have confidence in the strategy and the curve in fig. 30 serves this goal.
Fig. 30. Long-term simulation with new data (up to 2017) with learning period of 500 1h candles and test period of 100 candles. End result (profit): 1915 pips, Calmar ratio = 11.8 and PPC =0.31).
Fig 31 shows some simulation results in a symbolic form of circles and squares of the sizes that depend on PPC. This figure visualizes the difference in simulation results for one-hour and daily time series, where circles denote one-hour time series and squares denote daily time series. The X coordinates is hours in a learning period and Y coordinate is hours in a test period. The best result for one-hour series (100/24 hours ratio between learning and test periods) is a circle in the left-bottom corner of Fig. 31. For the time series of one-day candles (shown as squares) the positive results take
place for ratios of days such as 100/24, 50/20, 150/24. In Fig 31 these ratios are shown in hours, e.g., the point 30/5 days is shows as a large square for 720/120 hours.
Fig. 31. Results of simulations for different ratios of learning/testing periods. The circles present the result for simulations in one-hour time series and the squares present the result for one-day series.
6.
Conclusion
Many parts of the paper show the inspiring power of CPC visualization in both 2D and 3D spaces of features that represent time series data. This power is coming from the two levels of the approach in searching the best conditions to build the investment strategy. The first level involves examining the best 4D and 6D coordinate systems to build 2D or 3D visualization spaces. The second level involves learning parameters of attributes in each selected space.
A key role of the CPC approach in visualization of 4D and 6D points as arrows in 2D and 3D was in helping to find the best locations (squares in 2D or cubes in 3D) to open long or short positions, respectively. It is shown that the CPC method allows guiding exploration and machine learning for improving the search for the best local combinations of predictive features. For instance, further exploration will benefit from adding Kelly’s criterion [Nekrasov, 2014] to select the best squares (or cubes) in CPC spaces. This criterion allows taking into account together the quantity (number) of the arrows in the local places and their quality (lengths of projections). This is consistent with our much better results in the 3D distributions for 5x5x5 or 4x4x4 grids with a criterion based on length of bars (fig.20). It allowed us to increase a frequency in simulated trading with a much greater number of open positions in section 5, than in the previous method, based on circles in subcubes in section 2. Future challenges include introduction of deeper relations between learning and testing periods beyond the ratio of their lengths, and the implementation of the method in a trading platform and expanding to other investment tasks. This paper illustrates the potential of a new emerging joint research and application area of n-D visual discovery and investment strategies to boost the creativity of both scientists and practitioners.
In general, in the investment domain we want to solve a two-criteria task: max of profit, p, and min of risk, r. It is obvious that these criteria contradict each other quite often if not all the time. Thus, this is a mathematically ill-posed problem. The common ways in multi-objective optimization to resolve this
issue is to find a Pareto frontier or to combine two criteria to one criterion. Calmar ratio implements the second option with an intuitive idea behind it as follows. The component that must be maximized must be a dividend and the component that must be minimized must be a divisor. In this way if we have two pairs (p1,r1) and (p2,r2) such that p1> p2 and r1<r2 then Calmar ratio of (p1,r1) will be greater
than it is for (p2,r2). In this case Calmar ratio is consistent with Pareto frontier. However if p1> p2 and
r1>r2 then Calmar ratio of (p1,r1) can or cannot be greater than it is for (p2,r2). It will depend of actual
values of these 4 numbers. In essence Calmar ratio sets up the order in the Pareto frontier that can be questionable. It can be resolved by analysis of differences of actual pairs (pi,ri) from the Pareto
frontier. It is commonly done by visualizing the Pareto frontier in this 2-D case of two criteria. In fact a 2-D case is quite limited and exploration of Pareto frontier in higher dimensions will lead to deeper models. Parallel Coordinated (a special case of GLC) are commonly used to visualize the multidimensional Pareto frontier, but they quickly lead to high occlusion. General Line Coordinates (GLC) are especially promising way to accomplish such Pareto frontier analysis when the number of criteria is more than 2. It will be useful to explore these issues in the future research.
This paper illustrates the potential of a new emerging joint research and application area of n-D visual discovery and investment strategies to boost the creativity of both scientists and practitioners.
The authors thank Professor Andrzej Piegat for his kind support.
This research did not receive any specific grant from funding agencies in the public, commercial, or not-for-profit sectors.
References
1. Bingham, N.H. (2014), "Modelling and prediction of financial time series", Communications in Statistics - Theory and Methods, vol. 43, no. 7, pp. 1351-1361.
2. Cheng, C., Xu, W. & Wang, J. (2012), "A comparison of ensemble methods in financial market prediction", Proceedings of the 2012 5th International Joint Conference on Computational Sciences and Optimization, CSO 2012, pp. 755.
3. Ellis, C. A., & Parbery, S. A. (2005). Is smarter better? A comparison of adaptive, and simple moving average trading strategies. Research in International Business and Finance, 19(3), pp. 399-411.
4. Fama, E. F. (1998). Market efficiency, long-term returns, and behavioral finance. Journal of financial economics, 49(3), pp. 283-306.
5. Fong, W. M., & Yong, L. H. (2005). Chasing trends: recursive moving average trading rules and internet stocks. Journal of Empirical Finance, 12(1), pp. 43-76.
6. Guo, Z., Wang, H., Liu, Q. & Yang, J. 2014, "A feature fusion based forecasting model for financial time series", PLoS ONE, vol. 9, no. 6.
7. Hellwig Z. On the measurement of stochastical dependence. Applicationes Mathematicae 10 (1), 233-247.
8. Hoffman, A.J. (2014), "Combining different computational techniques in the development of financial prediction models", NCTA 2014 - Proceedings of the International Conference on Neural Computation Theory and Applications, pp. 276.
9. Keim D., Mansmann F., Schneidewind J., Thomas J., Ziegler H. Visual analytics: Scope and challenges. In: Visual Data Mining, pp.76-90, 2008.
10. Kovalerchuk B., (2014) Visualization of multidimensional data with collocated paired coordinates and general line coordinates, In: SPIE Visualization and Data Analysis 2014, Proc. SPIE 9017, 90170I, 15 p.
11. Kovalerchuk, B., (2016) Super-intelligence Challenges and Lossless Visual Representation of High-Dimensional Data, International Joint Conference on Neural Networks (IJCNN), pp. 1803-1810, IEEE 2016
12. Kovalerchuk B., Vityaev, E., (2000) Data Mining in Finance: Advances in Relational and Hybrid Methods, Kluwer/Springer, 325 p.
13. Kovalerchuk B., Perlovsky L., Wheeler G., (2012) Modeling of Phenomena and Dynamic Logic of Phenomena, Journal of Applied Non-classical Logics, 22(1): pp. 51-82
14. Krutsinger J. (1997) Trading Systems: Secrets of the Masters. New York: McGraw-Hill, p.242.
15. Li, X., Deng, Z., & Luo, J. (2009). Trading strategy design in financial investment through a turning points prediction scheme. Expert Systems with Applications, 36(4), 7818-7826.
16. Lian, W., Talmon, R., Zaveri, H., Carin, L., & Coifman, R. (2015). Multivariate time-series analysis and diffusion maps. Signal Processing, 116, 13-28.
17. Main R. (2015), Evaluating Traders’ Performers with the Calmar Ratio, www.proptradingfutures/the-calamr-ratio/ . Access January 2017
18. Martin, A. D. (2001). Technical trading rules in the spot foreign exchange markets of developing countries. Journal of Multinational Financial Management, 11(1), 59-68.
19. Mehta, K., & Bhattacharyya, S. (2004). Adequacy of training data for evolutionary mining of trading rules. Decision support systems, 37(4), 461-474.
20. Metghalchi, M., Chang, Y. H., & Marcucci, J. (2008). Is the Swedish stock market efficient? Evidence from some simple trading rules.
21. Nekrasov, V., Kelly Criterion for Multivariate Portfolios: A Model-Free Approach (September 30, 2014). Available at SSRN: https://ssrn.com/abstract=2259133 access January 2017
22. Pasche R. How Many Pips Should We Target Per Day? DailyFX, July 8, 2014, www.dailyfx.com access January 2017
23. Wichard, J. D., & Ogorzalek, M. (2004, July). Time series prediction with ensemble models. In Neural Networks, 2004. Proceedings. 2004 IEEE International Joint Conference on (Vol. 2, pp. 1625-1630). IEEE.
24. Wilinski A., Bera A. , Nowicki W., and Blaszynski P., (2014) “Study on the Effectiveness of the Investment Strategy Based on a Classifier with Rules Adapted by Machine Learning,” ISRNArtificial Intelligence, vol. 2014, Article ID 451849, 10 pages, 2014. doi:10.1155/2014/451849
25. Wilinski A., Zablocki M. (2015) The Investment Strategy Based on the Difference of Moving Averages with Parameters Adapted by Machine Learning. Advanced in Intelligent Systems and Computing vol. 342, Springer, Cham Heidelberg New York, pp.207-227
26. Young W.T. (1991) Calmar Ratio: A Smoother Tool, Futures (magazine), October 1991.
http://dx.doi.org/10.1016/j.cogsys.2017.04.004
View publication stats View publication stats