Australian Council for Educational Research (ACER) Australian Council for Educational Research (ACER)
ACEReSearch
ACEReSearch
OECD Programme for International Student
Assessment (PISA) National and International Surveys
4-2012
Print and digital reading in PISA 2009 : comparison and contrast
Print and digital reading in PISA 2009 : comparison and contrast
Juliette Mendelovits ACER, [email protected] Dara Ramalingam ACER, [email protected] Tom Lumley ACER, [email protected]Follow this and additional works at: https://research.acer.edu.au/pisa
Part of the Educational Assessment, Evaluation, and Research Commons
Recommended Citation Recommended Citation
Mendelovits, J., Ramalingam, D., & Lumley, T. (2012). Print and digital reading in PISA 2009 : comparison and contrast. https://research.acer.edu.au/pisa/6
This Article is brought to you by the National and International Surveys at ACEReSearch. It has been accepted for inclusion in OECD Programme for International Student Assessment (PISA) by an authorized administrator of ACEReSearch. For more information, please contact [email protected].
1
Print and Digital Reading in PISA 2009: Comparison and
Contrast
Juliette Mendelovits, Dara Ramalingam and Tom Lumley
1 Australian Council for Educational ResearchIntroduction
PISA was administered for the fourth time in 2009. Since in each administration, one of reading, maths or science is chosen as the major domain, the 2009 survey marked the first time that a domain (in this case, reading) was revisited as the major focus of the assessment. This allowed a full review of the framework for reading literacy and the inclusion of new elements to reflect the way that reading has changed since 2000 (OECD, 2009). One such change is the increasing prevalence of digital texts. The assessment of digital reading in the PISA 2009 cycle, undertaken by 19 of the 67 countries and economies administering PISA 2009, represented the first large scale international assessment of digital reading.
PISA’s digital reading assessment (DRA) is an assessment of reading in the digital medium, as opposed to a computer-delivered assessment of reading in the print medium. While many of the skills needed to read a digital text are similar to those needed to read a print text, differences between print and electronic environments require readers to develop new skills. The nature, form and blurred boundaries of digital texts mean that readers typically construct their own path within a text – more so than in printed texts, which have a physical order and physical boundaries. Digital texts also offer different opportunities for readers to engage with the text by directly influencing the content: for example by responding to an e-mail message or adding a comment to a blog.
The 19 countries and partner economies that participated in the optional DRA also
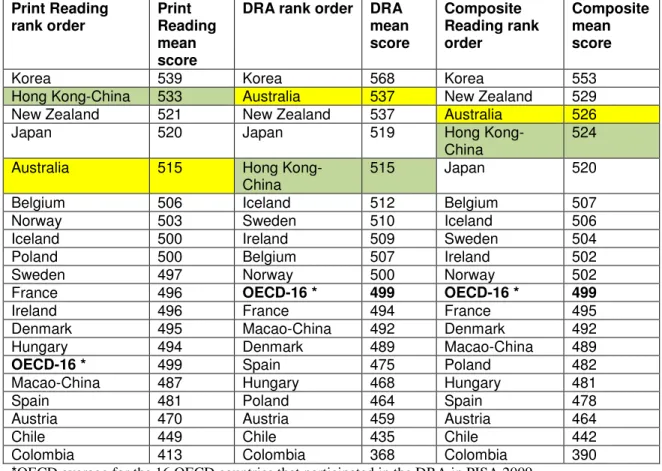
participated in the PISA paper-based assessment; the students sampled in the DRA were a subset of those who were administered the paper-based assessment. It was therefore possible to construct a robust comparison of performance in reading in the two media at the country level. The reading results were reported on three scales of interest in this context: a print reading scale, a digital reading scale, and a composite scale for digital and print reading. Ranking and mean scores (all scaled to the same metric, based on a mean of 500 and a standard deviation of 100 for OECD countries in PISA 2000) is shown in Table 1 (see (OECD, 2011). The countries and economies shown in Table 1 are those that participated in the DRA.
1
The authors wish to thank Alla Berezner and Louise Wenn, colleagues at ACER, for their assistance with the analysis of PISA data for this paper, and the Hong Kong PISA National Centre for information and discussion about the Hong Kong-China experience of the PISA DRA in 2009.
2
Table 1 Print, digital and composite reading performance for 19 countries and partner economies, PISA 2009 Print Reading rank order Print Reading mean score
DRA rank order DRA mean score Composite Reading rank order Composite mean score
Korea 539 Korea 568 Korea 553 Hong Kong-China 533 Australia 537 New Zealand 529 New Zealand 521 New Zealand 537 Australia 526 Japan 520 Japan 519 Hong
Kong-China
524
Australia 515 Hong Kong-China
515 Japan 520
Belgium 506 Iceland 512 Belgium 507 Norway 503 Sweden 510 Iceland 506 Iceland 500 Ireland 509 Sweden 504 Poland 500 Belgium 507 Ireland 502 Sweden 497 Norway 500 Norway 502 France 496 OECD-16 * 499 OECD-16 * 499
Ireland 496 France 494 France 495 Denmark 495 Macao-China 492 Denmark 492 Hungary 494 Denmark 489 Macao-China 489
OECD-16 * 499 Spain 475 Poland 482
Macao-China 487 Hungary 468 Hungary 481 Spain 481 Poland 464 Spain 478 Austria 470 Austria 459 Austria 464 Chile 449 Chile 435 Chile 442 Colombia 413 Colombia 368 Colombia 390 *OECD average for the 16 OECD countries that participated in the DRA in PISA 2009
It can be seen that Australia’s and Hong Kong’s mean performances are significantly above the OECD average of 499 in all three scales. On the composite reading scale, their
performance is almost identical. However, their positions are reversed for performance in print and digital reading.
The results raise policy and pedagogical questions for these two entities, for different
reasons. Australia, while remaining a high performing country, has seen a significant decline in print reading performance as measured by PISA from 2000 to 2009 (by 13 points). There are now several2 PISA countries or economies performing more strongly than Australia, while in 2000 there was only one, Finland. But the digital reading result for Australia can be seen as encouraging, in that it puts Australia at a relatively high level on the scale, both absolutely and in ranking.
Hong Kong-China’s reading profile is somewhat different. In print reading, only one entity – Shanghai-China – performed significantly better than Hong Kong-China in PISA 2009. There has been an improvement in Hong Kong’s reading performance from 2000 to 2009, although it is not statistically significant. Nevertheless, as for Australia, the performance of boys in reading indicates some cause for concern. There has been a strong and significant
2
Six countries and economies rank above Australia in PISA 2009 print reading: Shanghai-China, Korea, Finland, Hong Kong-China, Singapore and Canada.
3
improvement in girls’ performance since PISA 2000 (17 points); on the other hand, boys’ performance has remained unchanged since 2000. Thus the gender gap has widened in print reading. Table 2 summarises the changes in print reading proficiency for Australia and Hong Kong-China from 2000 to 2009, with the average of the 26 OECD countries with comparable results over the same period provided for reference. Figures in bold indicate statistically significant differences between boys’ and girls’ performance in each of the two years. Figures in bold+italics indicate statistically significant changes between 2000 and 2009 (OECD, 2010).
Table 2 Mean print reading performance in PISA 2000 and PISA 2009, for all and by gender
PISA 2000 Print reading PISA 2009 Print reading
All Boys Girls Diff (B-G)
All Boys Girls Diff (B-G) Australia 528 513 546 -33 515(-) 496(-) 533 -37
Hong Kong-China 525 518 533 -15 533 518 550(+) -33
OECD-26 * 496 480 512 -32 496 477 516 -38
* This OECD average is for 26 OECD countries with comparable results.
Comparing PISA 2000 and PISA 2009 results for print reading, the gap between girls and boys has widened significantly across the 26 OECD countries, with boys’ performance declining and girls’ improving. There has also been a widening of the gender gap in both Australia and Hong Kong. In Australia, this is the result of a small (non-significant) decline for girls and a significant decline for boys. In Hong Kong, boys’ performance has remained the same, while girls have improved significantly.
The wide gender gap in print reading is not repeated in the digital reading results. The gap is still there (for all but one country, Colombia), but it is smaller. Table 3 shows the results for print reading and digital reading in PISA 2009. Figures in bold indicate statistically
significant differences between boys’ and girls’ performance in the two reading media (OECD, 2011).
Table 3 Mean print and digital reading performance in PISA 2009, for all and by gender PISA 2009 Print reading PISA 2009 Digital reading All Boys Girls Diff
(B-G)
All Boys Girls Diff (B-G) Australia 515 496 533 -37 537 522 550 -28 Hong Kong-China 533 518 550 -33 515 511 519 -8 OECD-16* 499 480 518 -38 499 487 511 -24
* The OECD average is for the 16 OECD countries that participated in the DRA.
Table 3 shows that while there was a significant difference between boys’ and girls’ performance across the 16 OECD countries that participated in the DRA, as well as in both Australia and Hong Kong, the gender gap for digital reading in all cases is narrower than for print reading. For Hong Kong-China, the gap is remarkably narrower.
4
To investigate the question of why Australian students performed better in digital reading than in print reading while Hong Kong-China students performed worse in digital reading than in print reading, data from PISA 2009 are explored from several angles. In particular, this paper examines the data in relation to:
1. Performance on items with different formats in the digital and print reading assessments
2. Students’ access to computers and the Internet at home and at school
3. Amount and type of use of computers and the Internet at home and at school. Data sources that have been used for these investigations include the PISA 2009 cognitive assessment data for print and digital reading, the PISA 2009 student background
questionnaire and the ICT familiarity questionnaire.
Performance on items with different formats in the digital and
print reading assessments
In the PISA DRA, as in other cognitive domains in PISA, a variety of item formats was employed. Just over 60% of the score value of the instrument comprised items with selected response formats (typically multiple-choice items, where students were required to click on a radio button or similar), and just under 40% of the score value of the instrument comprised constructed response items, for which the students needed to input text.
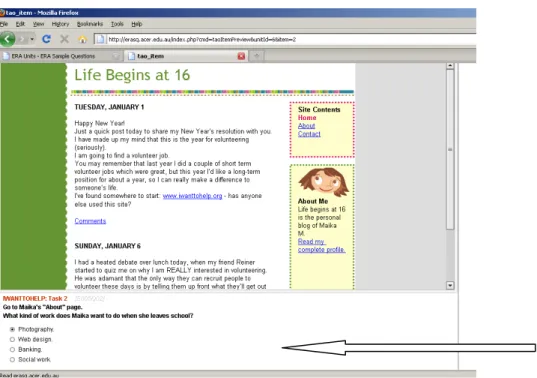
Figure 1 and Figure 2 show, respectively, examples of selected response and constructed response tasks from the DRA. The arrows show where the responses are entered in each case.
5
Figure 1 shows a multiple choice item. The student responds by clicking on a button in the task area.
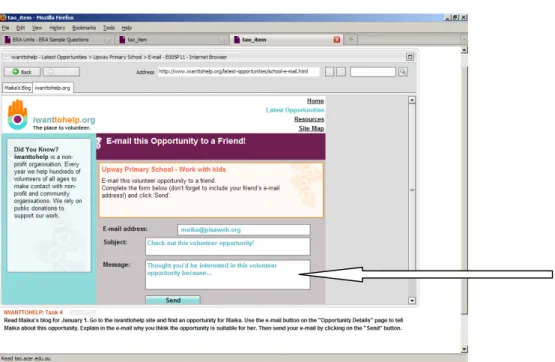
Figure 2 Example of a constructed response item from the PISA 2009 DRA
Figure 2 shows a constructed response item. For this kind of item, students enter their response in the form of text, either in the task area or the browser area (depending on the item). In this example, the response is given as a simulated e-mail message, in a text box in the browser area.
For countries testing in English (and countries testing in most other languages) the text input method for items like that shown in Figure 2 was very similar to standard keyboard use. By contrast, the text input methods for responding to constructed response items that were available for Chinese-tested Hong Kong-China students were not those that were most familiar to students, according to the Hong Kong-China national centre for PISA. It has been reported that the available text input systems were not just unfamiliar but also awkward for students to use (personal communication, Hong Kong-China National Project Manager). It has been suggested therefore that the relatively weak performance of Hong Kong-China students in digital reading was simply a consequence of this test artefact.3
If this were the case, it would be reasonable to predict that Hong Kong-China students would perform relatively well on selected response items, in which the text input system would not affect responses, and relatively poorly on constructed response items, which would be affected by the text input system. Accordingly, the cognitive reading data for Hong Kong, Australia and OECD-16 were inspected, with the items categorised according to item format
3
In Hong Kong-China in PISA 2009 about 97% of the students sampled were tested in Chinese, with the other 3% tested in English. Unless otherwise stated, the figures for Hong Kong-China in this section relate to the Chinese-tested students only.
6
(selected response and constructed response). Table 4 shows the aggregated average percentage correct of each item format category, for each group and for each reading medium.
Table 4 DRA percentage correct on selected-response and constructed-response items, for Austalia, Hong Kong-China and OECD-16
Location/language Average percentage correct, selected response items Average percentage correct, constructed response items Australian/English 72.37 56.35 Hong Kong/Chinese 68.51 48.11 OECD-16 69.37 48.12
Table 4 shows that, on average across the OECD-16 and in both Australia and Hong Kong, students found the selected response items easier on average than constructed response items. It also shows that Australian students performed more strongly than either Hong Kong-China students or the OECD-16 in both formats. Moreover, there is a wider gap between
performance on the two formats for Hong Kong-China students and for the OECD-16, compared to Australian students. Given that the performance of Hong Kong-China students in this respect is similar to that of the OECD-16, these data by themselves would not lead to the conclusion that Hong Kong-China students were disadvantaged by the text input method (although it appears that Australian students performed notably well on constructed response items in the digital medium). However, this result should be considered in the context of performance on the two item types in the print medium, as shown in Table 5.
Table 5 Print reading percentage correct on selected-response and constructed-response items, for Austalia, Hong Kong-China and OECD-16
Location/language Average percentage correct, selected response items Average percentage correct, constructed response items Australian/English 60.85 60.64 Hong Kong/Chinese 64.70 68.92 OECD-16 58.50 57.38
If we take the OECD-16 figure as a proxy for the difficulty of the assessment, it can be seen that the selected- and constructed-response items in the print reading instrument were of approximately similar difficulty. This result is reflected in the Australian performance on the two item formats, but not in the Hong Kong-China performance, where students performed somewhat better on the constructed-response items. This information, together with the digital reading percentages correct, implies that the Hong Kong students performed less well than might be expected on the constructed-response items in the DRA.
7
Taking all these data into account, then, the data on digital reading performance analysed in relation to item format tend to support the hypothesis that the text input methods available to Hong Kong-China students interfered with their performance.
Another way of investigating the text input disadvantage hypothesis is to look at missing data in the DRA. If students were frustrated by the text input system, they might express their frustration by not responding to items (called “missing items”), especially constructed-response items, as they encountered them in the course of the assessment; or by failing to complete the assessment (items in this category are called “not-reached items”). Conversely, one explanation for the relatively strong performance of Australian students (especially boys) is that they were more highly motivated to complete items in the DRA assessment than in the paper-based assessment.4
We first consider not-reached items. For both Australia and Hong Kong-China there was a low rate of not-reached items overall. On average, in both Australia and Hong Kong-China, less than one item was not reached at the end of the paper-based assessment, and an even lower proportion of items, on average, was not reached by students in these two locations in the DRA (OECD, forthcoming). These results suggest that Australian and Hong-Kong students generally had enough time, and the motivation, to complete the assessments in both paper-based and digital media.5
The rate of missing items – items scattered through the assessment that were not completed by students – was, obviously, higher in both locations than not-reached items. The
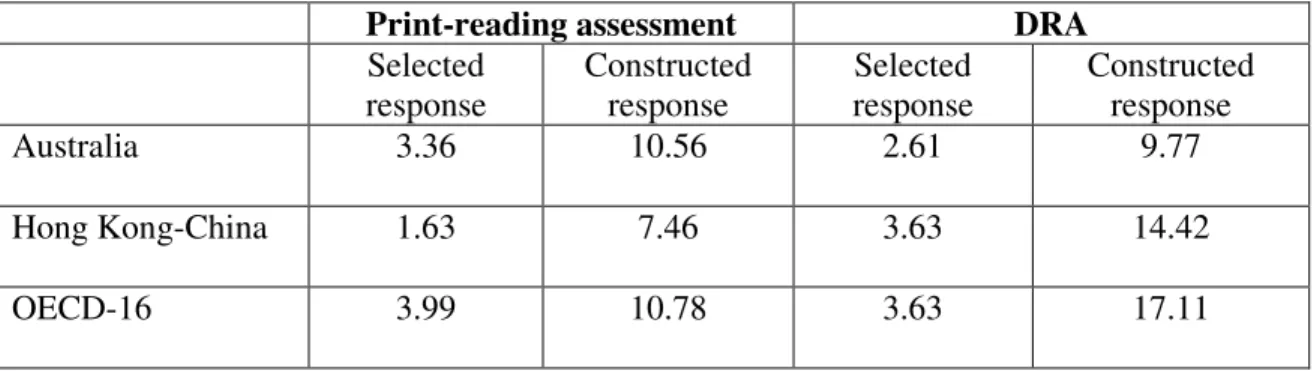
percentages of missing responses for the print and digital reading assessment were calculated, for items in the two formats and overall. Results are shown in Table 6.
Table 6 Mean percentages of missing items by item format for Australia, Hong-Kong-China and OECD-16
Print-reading assessment DRA
Selected response Constructed response Selected response Constructed response Australia 3.36 10.56 2.61 9.77 Hong Kong-China 1.63 7.46 3.63 14.42 OECD-16 3.99 10.78 3.63 17.11
For print reading, Australian students were very similar to the OECD average in attempting items, both for selected-response and constructed-response items. Hong Kong-China students
4
The term “paper-based assessment” rather than “print reading” is used in the context of not-reached analysis, because the PISA booklets comprised mathematics and science as well as print reading
assessment material. However, the majority of the contents (7/13) was reading, and every booklet included some reading.
5
The general conclusion that student motivation for the print reading assessment in Australia and Hong Kong was quite adequate for reliable measurement is supported by Butler and Adams’ study, which found that Australian and Hong Kong students took the paper-based assessment quite seriously, and with a similar level of seriousness, in PISA 2003. (Butler & Adams, 2007)
8
tested in Chinese were more likely, in this testing medium, to respond to both selected-response and constructed-selected-response items than the OECD average. In the DRA, Australian students missed fewer items in both selected response and constructed response format than the OECD average. In the case of constructed-response items, Australian students were much more likely to "have a go" than Hong Kong-China students, and there is an even wider disparity for the OECD total. One could infer from these data that Australian students were relatively highly engaged (as well as relatively successful) in completing the digital reading tasks, whether in selected-response or constructed-response format.
By contrast with their behaviour in the print-reading assessment, students in Hong Kong-China were more likely to omit both selected-response and constructed-response items than their Australian counterparts. Again, these data support the hypothesis that the Hong-Kong-Chinese students were less motivated to respond in the DRA than in the print assessment. A more detailed look at the percentages of missing responses by gender throws further light on the behaviour and, by inference, the motivation of Australian and Hong Kong-Chinese students.
Table 7 Percentage of missing items by item format for all, boys and girls in the print reading assessment
Selected response items Constructed response items
All Boys Girls All Boys Girls
Australia 3.36 4.02 2.74 10.56 12.81 8.4
Hong Kong-China
1.63 2.02 1.20 7.46 9.41 5.28
In the print reading assessment, both Australian and Hong Kong-China boys were more likely than girls not to attempt an item, whether selected response or constructed response: generally, boys were about one and a half times more likely to miss an item than girls, in this medium; in the case of Hong Kong-China, boys were nearly twice as likely as girls not to respond to constructed-response items. A number of research studies have found that girls tend to perform better than boys on tasks that involve writing, both in PISA (Lafontaine & Monseur, 2006; Routitsky & Turner, 2003), and more broadly across assessments
(Willingham & Cole, 1997). In this context, the data for the DRA on missing responses (one way of receiving no credit) are particularly noteworthy, as shown in Table 8.
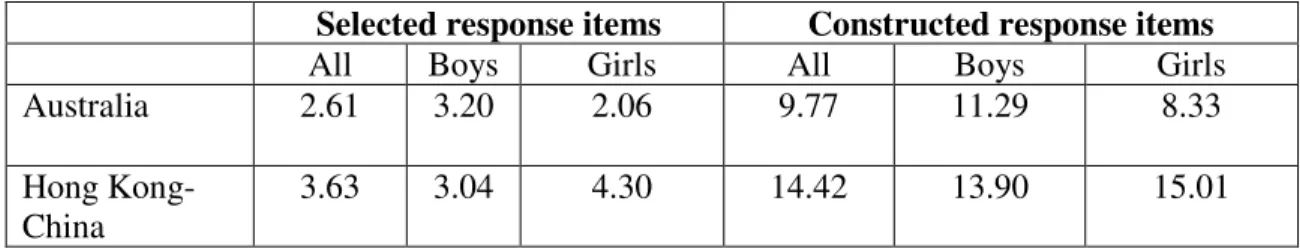
Table 8 Percentage of missing items by item format for all, boys and girls in the DRA
Selected response items Constructed response items
All Boys Girls All Boys Girls
Australia 2.61 3.20 2.06 9.77 11.29 8.33
Hong Kong-China
9
Table 8 shows that for digital reading, as for print reading, Australian boys are about one and a half times as likely as Australian girls not to respond to both selected-response items and constructed-response items (though the absolute percentage of missing items is much higher for constructed-response than for selected-response items). Thus in Australia, the gender pattern with regard to missing responses is similar in print and in digital reading. However, in the DRA, Hong China girls are almost one and a half times as likely as Hong Kong-China boys to miss items that call for a selected response – reversing the usual trend of a higher attempt rate by girls than by boys. Perhaps even more remarkably, Hong Kong-China girls were more likely not to respond at all to constructed-response items than Hong Kong-China boys. Here we find some more detail to account for the very large difference in performance between the print and digital reading assessment performance for Hong Kong-China girls. As shown in Table 3, the drop in Hong Kong-China boys’ performance between print and digital reading was only 7 scale points, while the difference between the girls’ performances was 31 points. It would appear then that if the text input system disadvantaged Hong Kong-China students, the impact, as shown in the missing data for constructed
response items, was far greater on girls than on boys.
In summary, for Australian students, test behaviour was quite similar in terms of gender for the print and digital reading assessments. By contrast, Hong Kong-China students’ behaviour by gender was markedly different in the two reading assessments, with girls much less likely to attempt constructed response items than boys in the digital medium compared with the print medium, and students of both sexes performing more poorly than might have been expected on constructed-response items, considering their strong performance on such items in the print medium.
These results support the hypothesis that at least part of Hong Kong-China China’s relatively weak performance in the digital compared with the print reading assessment is associated with the test artefact of an unfamiliar text input system.
The results do not, of course, explain Australia’s relatively strong performance in digital reading. On the composite reading scale, in which print and digital reading proficiency are reported in combination, Australia appears to have returned to its PISA 2000 level of reading proficiency, and this is entirely attributable to the digital reading performance, offsetting a more-or-less steady decline in print reading performance after PISA 2000.
To what extent can these results, for both locations, be associated with access to and use of computers, both at home and at school? An investigation of this aspect of the PISA 2009 results will also provide some further suggestions for explaining Hong Kong-China’s and Australia’s reversed performances in the digital and print reading assessments.
Students’ access to and use of computers and the Internet at home
and at school
One superficially appealing response to questions about comparing performance in print and digital reading is to attribute any difference to students’ ICT skills, and as a concomitant to their access to computers and other digital devices. PISA has offered an optional survey of ICT familiarity as an adjunct to the student background questionnaire that is administered to all PISA students in each administration since PISA 2000, and both Hong Kong-China and
10
Australia have participated in this option at each opportunity. Forty-five countries and partner economies took part in this optional survey in PISA 2009, the results of which are reported comprehensively in Volume VI of the report on the PISA 2009 results, Digital Technologies and Performance (OECD, 2011).
A series of questions in the ICT familiarity survey asked students whether they had access to a computer and to the Internet, both at home and at school. In PISA 2009, in both Australia and Hong Kong, 99% of students reported having a computer at home; 96% and 98%
respectively reported having access to the Internet at home. The percentages of students with access to computers and to the Internet at school were similar, and also very high: at least 98% for both Australia and Hong Kong-China students, for both computer and Internet access.
While access to computers both at home and at school is high for Australian and Hong Kong-China students, the further question is whether the students actually use the computers. Again, the vast majority of students in both locations report using computers at home (95% and 97% respectively); but there is an interesting and perhaps important difference in reports of using computers at school: 93% of Australian students but only 83% of students in Hong Kong-China report using computers at school. The figures are very similar for Internet use. This is consistent with the comparative ratio of computers available per student in schools: there is almost one computer per five students in Australian schools, while there is only a little over one computer per 10 students in Hong China schools – and in Hong Kong-China the ratio has fallen since 2000. Thus it appears that, while there is almost universal access to computers at schools in Australia and Hong Kong-China, computers are effectively less available to students in Hong Kong-China because of the lower ratio of computers per student. At the same time, availability of computers in schools appears to be a lower administrative priority in Hong Kong-China than in Australia. Whereas 29% of Australian school heads reported that there was a shortage of computers at their school, only 12% of Hong Kong-China school heads did so.
Amount and type of use of computers and the Internet at home and
at school
Overall, the analysis of the PISA 2009 data has suggested that proficiency in digital reading across the participating countries is not just about access to computers and the Internet, or amount of use, but about kind of use. The ICT familiarity survey asked students about whether, and how much, they used computers for leisure activities; for doing schoolwork at home; and for doing schoolwork at school.
For the first of these kinds of activities, use of computers at home for leisure activities (such as playing games, social activities, or looking for information), on average students who do not use computers at home at all generally perform worse in digital reading than those who do use computers at home for such activities. However, for those who sometimes use computers at home for leisure activities, increased use is not necessarily associated with better digital reading performance. The results vary according to the type of leisure activity. In the case of playing games (both one-player and collaborative), those who spend no time or only a moderate amount of time on the activities are likely to read digital texts with greater proficiency than those who spend a lot of time playing games. Students who never use the
11
Internet for the leisure activities of sending e-mails and chatting on line have the lowest levels of reading proficiency, but among students who do engage in these activities, the amount of use does not appear to have any impact on proficiency. By contrast, the
relationship between using the Internet to look for information (for fun) and digital reading performance does appear to be fairly linear: that is, the more information searching is done at home, the greater the proficiency in digital reading. This makes sense, in that digital reading, as operationalised in the DRA, places a strong emphasis on students’ capacity to find, integrate and evaluate text-based information in a digital environment.
Another set of questions in the ICT familiarity survey asked about use of computers at home for doing schoolwork. Questions were asked about a number of different activities (for example, using mail to collaborate with other students, contacting teachers for help by e-mail, using the school website or the Internet to look for information). The most frequently identified activity across countries was using the Internet at home to browse for information for schoolwork. For both Australia and Hong Kong, there was a linear relationship between the amount of school-related use of computers at home to search for information on line, and digital reading proficiency. In Australia the percentage of students who reported searching for information on line at home, for schoolwork, at least once a week, was 68%. This was the highest percentage among the 45 countries that participated in the ICT familiarity survey. The percentage of Hong Kong-China students who reported searching for information on the Internet at home, for schoolwork, was 44% – close to the OECD average of 46%. These data suggest that Australian students have, relatively, a lot of practice at home in schoolwork-focused searching for information on line.
A third set of questions asked about the use of computers at school. Students were asked whether they used computers at school for nine different kinds of activities. Across OECD countries the activities most frequently engaged in were browsing the Internet for schoolwork (39% of students reported that they did this at least once a week); using computers for group work and communication with other students (22%); and using e-mail at school (19%). The first and third of these activities are closely aligned with the kind of digital reading assessed in the PISA DRA. Australian students were much more likely to engage in these two kinds of activities at school than the OECD average. By contrast, students in Hong Kong-China were less likely than those in OECD countries, on average, to look for information on line at school, and about as likely as students in OECD countries to use e-mail at school.
It is not necessarily the case that Australian students are provided with any instruction or guidance at school in effectively using computers for searching, integrating and evaluating information on line; but habituation, in an instructional environment, at the very least seems likely to have some impact on proficiency. Moreover, curriculum and resourcing initiatives in Australia over the last decade make it reasonable to connect Australia’s relatively strong performance in digital reading, for both boys and girls, with the emphasis on ICT proficiency in Australian education. Starting in 2005, Australia has been measuring ICT literacy in a national sampling program for Year 6 and Year 10 students every three years. ICT is one of only three areas to receive such attention (ACARA, 2011). In the federal election campaign that brought a change of government to Australia in late 2007, the soon-to-be elected Prime Minister, Kevin Rudd, promised to devote AUD1 billion to giving every Year 9 to Year 12 student (14- to 17-year-olds) access to a computer at school, and this policy was reiterated in the election campaign of 2010 (http://www.alp.org.au/federal-government/). Since the turn of the century, Australian state-based education departments have emphasised the importance of
12
ICT literacy in their official curriculum statements. The new Australian national curriculum, which is currently being rolled out to replace the state-based curricula, includes seven
“general capabilities”, of which ICT capability is one, that are to be developed and integrated with discipline-based learning across the curriculum (ACARA, 2012). In the PISA 2009 ICT familiarity survey, Australian 15-year-olds’ reported frequent use of computers for and at school for learning-related activities implies that this aspect of the national agenda for education is being implemented.
Conclusion
The PISA reading framework and the implemented assessment in 2009 make the case that reading in the 21st century demands proficiency in dealing with both print and digital texts. It is clear that, around the world, boys’ performance in print reading is cause for concern. There is a wide gap between boys’ and girls’ proficiency, and the gap appears to be widening. Finding some way to harness the reading interests and strengths of boys would have great benefits for national yield as well as for individuals’ social, economic and personal lives. In the digital medium, girls are still performing relatively well as readers in comparison with boys in almost all countries and economies, but the gap is narrower.
This paper has focused on performance in print and digital reading in two of the countries and economies that participated in both the print and digital reading assessments in PISA 2009. In general terms, Australia and Hong Kong-China reflect similar reading proficiencies: composite reading (print and digital combined) are at almost exactly the same level. In both locations, also, girls perform more strongly than boys in print reading and in digital reading, but the gap is narrower in the latter. At the same time, there may be some concern about the capacity of girls in Hong Kong-China to fully participate in the digital medium. While Hong Kong-China girls are on average highly proficient readers in the print medium, their
proficiency as digital readers is not of the same calibre. Even if much of their relatively weak performance on the DRA is attributable to a test artefact – the available text input systems – this obstacle appears to have been much less of a handicap for Hong Kong-China boys.
The PISA DRA data shows that, on average, students who spend substantial amounts (but not excessive time) at home or at school browsing the Internet for information, and using e-mail, are likely to be more proficient digital readers than those who spent no time or very little time on these activities. These are the types of activities most closely aligned with the PISA digital reading tasks. However, Hong Kong-China students spend much less time than Australian students doing these activities at school. Australian students have substantially greater access to and use of computers at school. 15-year-olds in Australian schools are far more likely than Hong Kong-China students to use the Internet for browsing for schoolwork and for sending e-mails than Hong Kong-China students.
Given the differential performance in both locations between boys and girls in print reading, and the smaller differential in digital reading, it would seem sensible to concentrate
pedagogical efforts on developing the skills of reading via digital texts – especially taking into account the intimate interaction between text processing and navigation that will be explored further in the following paper.
13
More guided experience at school in digital reading tasks such as finding information on line and exchanging information by e-mail would be likely to support girls in particular to attain the levels of digital reading proficiency commensurate with their print reading performance.
At a more general level, analysing the variables associated with performance of Hong Kong-China students in print reading, and of Australian students in digital reading, may help stakeholders in both locations – and elsewhere – to find possible ways of supporting improved proficiency in reading.
References
ACARA. (2011). National Assessment Program. Retrieved 18 March 2012, from http://www.nap.edu.au/
ACARA. (2012). ICT capability across the curriculum. Retrieved 18 March 2012, from
Australiancurriculum.edu.au/GeneralCapabilities/Information-and- Communication-Technology-capability/Introduction/ICT-capability-across-the-curriculum
Butler, J., & Adams, R. J. (2007). The impact of differential investment of student effort on the outcomes of international studies. Journal of Applied Measurement, 8(3), 279-304.
Lafontaine, D., & Monseur, C. (2006). Impact of Test Characteristics on Gender Equity Indicators in the Assessment of Reading Comprehension. University of Liège. OECD. (2010). PISA 2009 Results: Learning Trends (Volume V). Paris: OECD
Publishing.
OECD. (2011). PISA 2009 Results: Digital Technologies and Performance (Volume VI). Paris: OECD Publishing.
OECD. (forthcoming). PISA 2009 Technical Report. Paris: OECD.
Routitsky, A., & Turner, R. (2003). Item format types and their influences on
cross-national comparisons of student performance. Paper presented at the annual
meeting of the American Educational Research Association (AERA). Willingham, W. W., & Cole, N. S. (Eds.). (1997). Gender and Fair Assessment.