FINANCIAL REPORTING: A COMPREHENSIVE EVALUATION OF ACCOUNTING METHODS AND APPLICATIONS
by Parker Hunt Morgan
A thesis submitted to the faculty of The University of Mississippi in partial fulfillment of the requirements of the Sally McDonnell Barksdale Honors College.
Oxford, MS May 2019
Approved by:
___________________________ Advisor: Dr. Victoria Dickinson ___________________________
ii © 2019 Parker Hunt Morgan ALL RIGHTS RESERVED
iii ABSTRACT
PARKER MORGAN: Financial Reporting: A Comprehensive Evaluation of Accounting Methods and Applications
(Under the direction of Dr. Victoria Dickinson)
This paper serves as a collection of the case studies assigned by Dr. Victoria Dickinson throughout the Professional Research and Development Thesis Program. Each of the twelve case studies presented within this thesis pertains to a different topic or problem regarding the application of accounting standards, financial reporting, or accounting methods. Additionally, this report displays the application of accounting problems to real-life situations, thus incorporating various subjects, such as investments, economics, accounting, and risk advisory. By promoting the use of group-related assignments, this course stimulated teamwork and classroom collaboration. Because of this, students were able to enhance their communication and networking skills, as well as their ability to learn from criticism. Following the conclusion of this course, students were equipped for the role of a public accountant because of their new knowledge pertaining to U.S.
TABLE OF CONTENTS
LIST OF FIGURES AND APPENDICES...v
CASE STUDY 1: Glenwood Heating, Inc. Analysis...1
CASE STUDY 2: Profitability and Earnings Persistence...14
CASE STUDY 3: Pearson Accounts Receivable...20
CASE STUDY 4: Transactional Accounts Receivable...29
CASE STUDY 5: Property, Plant, & Equipment...33
CASE STUDY 6: Research & Development Costs...42
CASE STUDY 7: Splunk, Inc. Data Analytics Summary...51
CASE STUDY 8: Long-Term Debt...59
CASE STUDY 9: Stockholder’s Equity...69
CASE STUDY 10: Marketable Securities...76
CASE STUDY 11: ZAGG, Inc. Deferred Income Taxes...84
v LIST OF FIGURES AND APPENDICES
CASE STUDY 1: Glenwood Heating, Inc. Analysis
Figure 1-1 Glenwood Heating, Inc. Income Statement...3
Figure 1-2 Glenwood Heating, Inc. Balance Sheet...4
Appendix A-1 Glenwood Heating, Inc. Statement of Retained Earnings ...5
Appendix A-2 Eads Heating, Inc. Statement of Retained Earnings ...6
Appendix A-3 Eads Heating, Inc. Income Statement ...6
Appendix A-4 Eads Heating, Inc. Balance Sheet ...7
Appendix A-5 Glenwood Heating, Inc. Chart of Accounts ...8
Appendix A-6 Glenwood Heating, Inc. Transactions for 20X1...9
Appendix A-7 Eads Heating, Inc. Chart of Accounts ...10-11 Appendix A-8 Eads Heating, Inc. Transactions for 20X1 ...12-13 CASE STUDY 3: Pearson Accounts Receivable Figure 3-1 Pearson’s 2009 Provision for Bad and Doubtful Debts...25
Figure 3-2 Pearson’s 2009 Provision for Sales Returns ...27
Figure 3-3 Pearson’s 2009 Trade Receivables ...28
CASE STUDY 5: Property, Plant, & Equipment Figure 5-1 Straight-Line Depreciation Chart...38
Figure 5-2 Double-Declining-Balance Depreciation Chart...38
CASE STUDY 6: Research & Development Costs Figure 6-1 Product and Software Development T-Account...46
vi
Figure 6-3 Volvo’s Research and Development Expenditures Table...48 Figure 6-4 Volvo’s Sales and Assets Table...48 CASE STUDY 8: Long-Term Debt
Figure 8-1 Effective Interest Rate Method Amortization Schedule...66 Figure 8-2 Straight-Line Method Amortization Schedule...68 CASE STUDY 9: Stockholder’s Equity
Figure 9-1 Merck& Co. Dividend Related Ratios ...74 Figure 9-2 Merck& Co. Dividend Related Activities...75
1
2
CASE STUDY 1: Glenwood Heating, Inc. Analysis Introduction
The following report was written to analyze the financial information of two different companies, Glenwood Heating, Inc and Eads Heating, Inc. Both are two heating companies with similar purposes, but because of varying asset management, one company is a better investment.
Although each company operates under similar economic conditions and has identical operations during the year, each manager makes different accounting choices and applications of GAAP principles. Glenwood uses a FIFO inventory valuation, while Eads uses LIFO. In addition to this, Glenwood decided to rent the equipment needed for its daily work, but Eads decided to lease equipment. Decisions like these, as well as others, caused discrepancies between the two companies. These discrepancies are analyzed in the following comparison.
Comparison
According to the data collected, Glenwood is clearly the superior company when it comes to essential operations and overall profitability. While Eads can collect their receivables at a quicker pace and can sell their inventory quicker, their profits are minimalized based on their valuation methods.
The Income Statement is an important indicator of a company’s profitability during a set time period. As shown by Figure 1-1, Glenwood reported a net income of $92,472 for the year 20X1, which shows that the company efficiently allocated their borrowed funds to generate a profit. This should point investors to the fact that the company will likely report a net profit in the future.
3
Figure 1-1: Glenwood Heating, Inc. Income Statement
The Balance Sheet displays the company’s assets, liabilities, and equity at a fixed point in time. It shows what the company owns and owes, while also showing the overall make-up of a company. The total assets owned by Glenwood Heating, Inc. is $642,632, as seen in Figure 1-2. This total is perfectly equal to the total liabilities and stockholders’ equity. One thing to note is the quick inventory turnover, which is identified by the $62,800 in remaining inventory. This points to the remaining $177,000 of inventory being sold during the year. This is beneficial in showing how quickly inventory is turned over throughout a single period to investors and other external users. Although Glenwood Heating’s inventory will never spoil, it is
Net Sales
$398,500
Cost of Goods Sold
(177,000)
Gross Profit
221,500
Rent Expense
(16,000)
Other Operating Expenses
(34,200)
Depreciation Expense
(19,000)
Interest Expense
(27,650)
Bad Debt Expense
(994)
Pre-Tax Net Income
123,656
Income Tax
(30,914)
Post-Tax Net Income
$92,742
Glenwood Heating, Inc.
Income Statement
4
important to see that their business process does not allow for high inventory totals. This indicates a healthy first-year company.
Figure 1-2: Glenwood Heating, Inc. Balance Sheet
Current Assets
Cash $426
Accounts Receivable 99,400
Allowance for Bad Debts (994)
Inventory 62,800
Total Current Assets 161,632
Property, Plant, and Equipment
Land 70,000
Building 350,000
Accumulated Depreciation- Building (10,000)
Equipment 80,000
Accumulated Depreciation- Equipment (9,000)
Total Property, Plant, and Equipment 481,000
Total Assets $642,632
Current Liabilities
Accounts Payable 26,440
Accrued Interest 6,650
Total Current Liabilities 33,090
Long Term Liabilities
Note Payable 380,000
Total Long Term Liabilities
Total Liabilities 413,090
Stockholder's Equity
Common Stock 160,000
Retained Earnings 69,542
Total Stockholder's Equity 229,542
Total Liabilities and Stockholder's Equity $642,632
Glenwood Heating, Inc. Balance Sheet As of December 31, 20X1
Assets
5
Glenwood has a higher net income than Eads despite having paid the same number of dividends. This allows them to have more retained earnings despite their lower overall cash in hand. Both companies have their strengths and weaknesses. Even though Eads Heaters is being less risky and more future-cautious than
Glenwood, Glenwood is doing a better job of turning what they do have into a profit. Based on the performance of both companies over their first year of operations and this data analysis, I would recommend investing in or lending money to Glenwood over Eads.
Appendices- Case Study 1: Glenwood Heating, Inc.
The following figures were used in determining the balances and conclusions used in the body of the proposal.
Appendix A-1: Glenwood Heating, Inc. Statement of Retained Earnings
Beginning Retained Earnings
Net Income $92,742
Dividends (23,200)
End Retained Earnings $69,542
Glenwood Heating, Inc. Statement of Retained Earnings
6
Appendix A-2: Eads Heating, Inc. Statement of Retained Earnings
Appendix A-3: Eads Heating, Inc Income Statement Beginning Retained Earnings
Net Income $70,515
Dividends (23,200)
End Retained Earnings $47,315
Eads Heating, Inc.
Statement of Retained Earnings For Year End 12/31/20X1
Net Sales $398,500
Cost of Goods Sold (188,800)
Gross Profit 209,700
Other Operating Expenses (34,200)
Depreciation Expense (41,500)
Interest Expense (35,010)
Bad Debt Expense (4,970)
Pre-Tax Income 94,020
Income Tax (23,505)
Post-Tax Net Income $70,515
Eads Heating, Inc. Income Statement For The Year End 12/31/20X1
7 Appendix A-4: Eads Heating, Inc. Balance Sheet
Cash $7,835
Accounts Receivable 99,400
Allowance for Bad Debts (4,970)
Inventory 51,000
Total Current Assets 153,265
Land 70,000 Building 350,000 Accumulated Depreciation- Building (10,000) Equipment 80,000 Accumulated Depreciation- Equipment (20,000) Leased Equipment 92,000 Accumulated Depreciation- Leased Equipment (11,500)
Total Property, Plant, and
Equipment 550,500
Total Assets $703,765
Current Liabilities
Accounts Payable 26,440
Accrued Interest-N/P 6,650
Total Current Liabilities 33,090
Long-Term Liabilities
Lease Payable 83,360
Note Payable (20 year, 7%) 380,000
Total Long-Term Liabilities 463,360
Stockholder's Equity
Common Stock 160,000
Retained Earnings 47,315
Total Stockholder's Equity 207,315
Total Liabilities and
Stockholder's Equity $703,765
Liabilities and Stockholder Equity
Eads Heating, Inc. Balance Sheet As of December 31, 20X1
Assets
Current Assets
8
Appendix A-5: Glenwood Heating, Inc. Chart of Accounts
Transaction Cash
Accounts
Receivable Inventory Land Building Equipment
Accounts Payable No. 1 $160,000.00 No. 2 400,000 No. 3 (420,000) 70,000 350,000 No. 4 (80,000) 80,000 No. 5 239,800 239,800 No. 6 398,500 No. 7 299,100 (299,100) No. 8 (213,360) (213,360) No. 9 (41,000) No. 10 (34,200) No. 11 (23,200) No. 12 Balances $47,340 $99,400 $239,800 $70,000 $350,000 $80,000 $26,440 Transaction Note Payable Interest Payable Common Stock Retained Earnings Revenue Other Operating Expenses Dividends Interest Expense No. 1 $160,000.00 No. 2 400,000 No. 3 No. 4 No. 5 No. 6 398,500 No. 7 No. 8 No. 9 (20,000) 21,000 No. 10 34,200 No. 11 23,200 No. 12 6,650 6,650 Balances $380,000 $6,650 $160,000 $313,450 $398,500 $34,200 $23,200 $27,650
9
Appendix A-6: Glenwood Heating, Inc. Transactions for 20X1
Transaction Cash
Accounts Receivable
Allowance for Bad
Debts Inventory Land Building
Balance: Part A $47,340 $99,400 $239,800 $70,000 $350,000
Part B (1) Bad Debts 994
Part B (2) COGS (177,000) Part B (3) Depreciation Building Equipment Part B (4) Equipment Rental Payment (16,000) Part B (5) Income Tax (30,914)
Balances: $426 $99,400 $994 $62,800 $70,000 $350,000 Transaction Accumulated Depreciation Building Equipment Accumulated Depreciation Equipment Accounts Payable Interest Payable Note Payable Common Stock Balance: Part A $80,000 $26,440 $6,650 $380,000 $160,000
Part B (1) Bad Debts Part B (2) COGS Part B (3) Depreciation Building 10,000 Equipment 9,000 Part B (4) Equipment Rental Payment Part B (5) Income Tax
Balances: $10,000 $80,000 $9,000 $26,440 $6,650 $380,000 $160,000 Transaction Retained Earnings Bad Debt Expense Cost of Goods Sold Depreciation Expense Building Depreciation Expense Equipment Rent Expense Income Tax Payable Balance: Part A $313,450
Part B (1) Bad Debts (994) 994
Part B (2) COGS (177,000) 177,000 Part B (3) Depreciation Building (10,000) 10,000 Equipment (9,000) 9,000 Part B (4) Equipment Rental Payment (16,000) 16,000
Part B (5) Income Tax (30,914) 30,914
10
Appendix A-7: Eads Heating, Inc. Chart of Accounts
Transaction Cash
Accounts
Receivable Inventory Land Building Equipment
No. 1 $160,000 No. 2 400,000 No. 3 (420,000) 70,000 350,000 No. 4 (80,000) 80,000 No. 5 239,800 No. 6 398,500 No. 7 299,100 (299,100) No. 8 (213,360) No. 9 (41,000) No. 10 (34,200) No. 11 (23,200) No. 12 Balances $47,340 $99,400 $239,800 $70,000 $350,000 $80,000 Transaction Accounts Payable Note Payable Interest Payable Common Stock Retained Earnings No. 1 $160,000.00 No. 2 400,000 No. 3 No. 4 No. 5 239,800 No. 6 No. 7 No. 8 (213,360) No. 9 (20,000) No. 10 No. 11 No. 12 6,650 Balances $26,440 $380,000 $6,650 $160,000 $313,450
11
Appendix A-8: Eads Heating, Inc. Transactions for 20X1 Transaction Revenue Other Operating Expenses Dividends Interest Expense No. 1 No. 2 No. 3 No. 4 No. 5 No. 6 398,500 No. 7 No. 8 No. 9 21,000 No. 10 34,200 No. 11 23,200 No. 12 6,650 Balances $398,500 $34,200 $23,200 $27,650 Transaction Cash Accounts Receivable Allowance for Bad
Debts Inventory Land Building
Balance: Part A $47,340 $99,400 $239,800 $70,000 $350,000
Part B (1) Bad Debts 4,970
Part B (2) COGS (188,800) Part B (3) Depreciation Building Equipment Part B (4) Equipment Lease Lease Payment (16,000) Depreciation
Part B (5) Income Tax (23,505)
12 Transaction Accumulated Depreciation Building Equipment Accumulated Depreciation Equipment Leased Equipment Accumulated Depreciation Leased Equipment Accounts Payable Balance: Part A $80,000 $26,440
Part B (1) Bad Debts Part B (2) COGS Part B (3) Depreciation Building 10,000 Equipment 20,000 Part B (4) Equipment Lease 92,000 Lease Payment Depreciation 11,500
Part B (5) Income Tax
Balances $10,000 $80,000 $20,000 $92,000 $11,500 $26,440 Transaction Interest Payable Note Payable Common Stock Retained Earnings Bad Debt Expense Cost of Goods Sold Depreciation Expense Leased Equipment Balance: Part A $6,650 $380,000 $160,000 $313,450
Part B (1) Bad Debts (4,970) 4,970
Part B (2) COGS (188,800) 188,800 Part B (3) Depreciation Building (10,000) Equipment (20,000) Part B (4) Equipment Lease Lease Payment (11,500) Depreciation (7,360) 11,500
Part B (5) Income Tax (23,505)
13 Transaction Depreciation Expense Equipment Depreciation Expense Building Lease Payable Interest Expense Income Tax Payable Balance: Part A Part B (1) Bad Debts Part B (2) COGS Part B (3) Depreciation Building 10,000 Equipment 20,000 Part B (4) Equipment Lease 92,000 Lease Payment (8,640) Depreciation 7,360
Part B (5) Income Tax 23,505
14
15
CASE STUDY 2: Profitability and Earnings Persistence
IntroductionThe following report was written in regard to Molson Coors Brewing Company. Their financial statements include many extra items not considered to be part of the company’s central operations. Below are a series of questions and answers regarding the concepts, process, and analysis of company.
Case Analysis
a) What are the major classifications on an income statement?
The major classifications on an income statement include the operating section, nonoperating section, income tax, discontinued operations,
noncontrolling interest, and earnings per share. The operating section would include sales or revenue, cost of goods sold, selling expenses, and
administrative expenses. Likewise, the nonoperating section of the income statement encompasses other revenue, gains, expense and losses.
Discontinued operations refer to the material gains or losses from the elimination of a component of the business. Noncontrolling interest is the allocation of income to noncontrolling shareholders.
b) Explain why, under U.S. GAAP, companies are required to provide “classified” income statements.
16
A classified balance sheet consists of three sections: the gross margin, operating expense, and non-operating expense sections. The gross margin section is useful for determining the amount of profit created from the sale of goods. The operating and non-operating categories allow for the company to summarize the costs that are lowering the margins of profit for the company. U.S. GAAP requires businesses to provide classified statements because a classified income statement categorizes information better than a single-step income statement, where revenue and expense items are simply recorded in sequence, with no effort to present sub-totals. Also, a classified income statement follows the full disclosure principle, leaves less room for dishonesty, and makes it easier to comprehend. According to the full disclosure principle, companies have to disclose information that is of
sufficient importance to sway a user’s opinion, in regard to a financial report.
c) In general, why might financial statement users be interested in a measure of persistent income?
Financial statement users are interested in some measure of persistent income because cash flows are more dependable when income is steadier, and it also increases yearly comparability. Users, like any other human being, appreciate being told the truth. Therefore, potential investors/creditors value this information more because it shows the fundamental quality of relevance.
17
d) Define comprehensive income and discuss how it differs from net income. Comprehensive income recognizes the items that are not included on the income statement because they have not been realized. This includes items like an unrealized holding gain or loss from available for sale securities and foreign currency translation gains or losses. On the other hand, net income only includes the earnings that are left over after all expenses are deducted.
e) The income statement reports “Sales” and “Net sales.” What is the difference? Why does Molson Coors report these two items separately?
Although sales and net sales sound quite similar, these two are not the same item. Net sales are the residual amount after sales returns and sales discounts are removed from sales revenue. The sales account does not take into report these deductions. Molson Coors reports these two separately for this reason of transparency.
f) Consider the income statement item “Special items, net” and information in Notes 1 and 8. In general, what types of items does Molson Coors include in this line item? Explain why the company reports these on a separate line item rather than including them with another expense item. Molson Coors classifies these special items as operating expenses. Do you concur with this classification? Explain.
18
Molson Coors includes infrequent or unusual items, impairment or asset abandonment-related losses, restructuring charges and other atypical employee related costs, and fees on termination of significant operating agreements and gains (losses) on disposal of investments. Special items are separated out from other categories, such as income and expenses and instead reported on the income statement, so investors can more precisely compare the company's numbers across accounting periods. The special items are brought about through one-time occurrences that for the most part have to do with operating expenses. The only exceptions to this rule are acts of god, such as the tornados, hurricanes, etc. However, currently the operating expense is the best definition under GAAP, unless and ETIF has been released
concerning the event.
g) Consider the income statement item “Other income (expense), net” and the information in Note 6. What is the distinction between “Other income (expense), net” which is classified a nonoperating expense, and “Special items, net” which Molson Coors classifies as operating expenses?
Other income expenses do not directly affect the operating portion of the income statement, which is why they are incorporated on the nonoperating portion of the income statement. Items like interest expense and interest revenue would be included in other income expenses. However, special items are directly impact operating activates of Molson Coors, so they are depicted in the operating section.
19
h) What is the amount of comprehensive income in 2013? How does this amount compare to net income in 2013? What accounts for the difference between net income and comprehensive income in 2013? In your own words, how are the items included in Molson Coors’ comprehensive income related?
The amount of comprehensive income in 2013 is $760.2 (millions). Net income in 2013 comes in at a much lower amount at $567.3 (millions). The items causing this vast difference between these two totals are foreign currency translation adjustments, unrealized gain (loss) on derivative instruments, reclassification of derivative loss to income, pension and other postretirement benefit adjustments, amortization of net prior service cost and net actuarial loss to income, and ownership share of unconsolidated
subsidiaries’ other comprehensive income. These items cause this change because they cannot be presented on the income statement.
i) What is Molson Coors’ effective tax rate in 2013?
The effective tax rate is 12.83%. Here is the calculation used to attain this answer.
Effective Tax Rate = "#$%&' )*+ ,+-'#.'/0'1)*+ "#$%&'
= 2,455,555 674,555 =12.83%
20
21
CASE STUDY 3: Pearson Accounts Receivable
IntroductionPearson, PLC is an international company with businesses in education, business information and consumer publishing. This report was written to analyze the different accounts receivable terminology and to assess the use of contra accounts for the uncollectible accounts and sales returns by referring to Pearson’s financial reports and footnotes for the year 2009. An account receivable is a claim held against
customers for cash, merchandise, or services. Each individual has a specific accounts receivable in the ledger, while the sum of all of the accounts receivable is reported on the balance sheet. Below are a series of questions and answers regarding the concepts, process, and analysis of Pearson, PLC.
Case Analysis
a) What is an account receivable? What other names does this asset go by? Accounts receivable refers to the account that encompasses the money that a company will receive because it had previously provided customers with goods or services or both. Alternate names for accounts receivable include receivables and trade receivables. Receivables are comprised of both note receivables and accounts receivable, but trade receivables and accounts receivables are nearly interchangeable.
22
b) How do accounts receivable differ from notes receivable?
The fundamental difference between notes receivable and accounts receivable is that accounts receivable is the amount owed by the clients, while notes receivable is a written promise by a supplier agreeing to pay a sum of money in the future. Another difference is notes receivables earn interest while accounts receivables do not.
c) What is a contra account? What two contra accounts are associated with Pearson’s trade receivables? What types of activities are captured in each of these contra accounts? Describe factors that managers might consider when deciding how to estimate the balance in each of these contra
accounts.
A contra account is a general ledger account that is intended to have its balance be the opposite of the normal balance for that account classification. “Allowance for doubtful accounts” and “allowance for sales returns and allowances” are the two contra accounts affecting Pearson’s trade receivables. Allowance for doubtful accounts estimates the value of the receivables that will be uncollectable due to the customer not being able to pay. At the end of the period, the manager will estimate this amount based on their customers’ history of paying during past periods.
Allowance for sales returns and allowances estimates the amount of merchandise that the company expects to be returned by a customer and the allowances granted to a customer because the seller shipped defective
23
merchandise. At the end of the period, the manager will estimate this amount based on their customers’ history of returning goods and the company’s history of shipping defective products.
d) Two commonly used approaches for estimating uncollectible accounts receivable are the percentage-of-sales procedure and the aging-of-accounts procedure. Briefly describe these two approaches. What
information do managers need to determine the activity and final account balance under each approach? Which of the two approaches do you think results in a more accurate estimate of net accounts receivable?
Percentage of sales method, also known as the income statement approach, is a financial forecasting method that businesses use to predict their sales growth on an annual basis. This includes taking the amount of either total sales or credit sales and multiplying it by a percentage to estimate uncollectable debt. The aging of accounts procedure is a more complicated method. In this approach, the company separates its receivables based on if and how long a receivable is overdue.
To determine if a receivable will not be collected, it analyzes
receivables based on the time period that they are uncollectable. The longer a debt is outstanding, the more likely it is going to be uncollected. Despite not matching costs and revenues, the aging of receivables still produces a more accurate estimate of net accounts receivable than percentage of sales.
24
e) If Pearson anticipates that some accounts will be uncollectible, why did the company extend credit to those customers in the first place? Discuss the risks that managers must consider with respect to accounts
receivable.
Even though Pearson anticipated that some accounts would be
uncollectable, the company extended these customers the credit because they are taking a calculated risk. In the long term, this calculated risk could hurt their future cash flows if the company is not able to collect on enough of these uncollectable accounts. However, by weighing the cost versus the benefit of these accounts, Pearson was more than prepared to receive an increase in revenue for even the remote chance of increasing their figures.
f) Note 22 reports the balance in Pearson’s provision for bad and doubtful debts and reports the account activity during the year ended December 31, 2009. Note that Pearson refers to the trade receivables contra account as a “provision.” Under U.S. GAAP, the receivables contra account is typically referred to as an “allowance” while the term provision is used to describe the current-period income statement charge for uncollectible accounts.
i. Use the information in Note 22 to complete a T-account that shows the activity in the provision for bad and doubtful debts account during the year.
25
In Figure 3-1 shown below, the credited items include the £26 million for income statement movements, or bad debt expense, and £3 million from a bad debt that occurred from a business acquisition.
The £25 million debit is the sum of the charges in overdue accounts from 2008 to 2009, which include: £5 million caused by the difference in exchange rates between currencies, and £20 million for accounts that were utilized.
Figure 3-1: Pearson’s 2009 Provision for Bad and Doubtful Debts
ii. Prepare the journal entries that Pearson recorded during 2009 to capture bad and doubtful debts expense for 2009 and the write-off of accounts receivable during 2009. *(Note: All answers are in £ millions)
Bad Debt Expense (B/S) 26
Allowance for Doubtful Accounts (I/S) 26 Allowance of Doubtful Accounts (I/S) 20
26
The bad debt expense account is a selling, general, &
administrative expense, which makes it an operating expense. The receivables account and its matching allowance account both appear on the balance sheet.
iii. Where in the income statement is the provision for bad and doubtful debts expense included?
The allowance of doubtful accounts is not its own separate entity on the income statement. However, bad debt expense is included in “income statement movements” and is reported under operating expenses.
g) Note 22 reports that the balance in Pearson’s provision for sales returns was £372 at December 31, 2008 and £354 at December 31, 2009. Under U.S. GAAP, this contra account is typically referred to as an “allowance” and reflects the company’s anticipated sales returns. Answers are in £ millions).
i. Complete a T-account that shows the activity in the Allowance for sales returns and allowances account during the year. Assume Pearson estimated that returns relating to 2009 Sales to be £425 million. Two types of journal entries are required, one to record the estimated sales returns for the period and one to record the amount of actual book returns.
27
Figure 3-2: Pearson’s 2009 Provision for Sales Returns
Sales Returns and Allowances (I/S) 425
Allowance for Sales Returns (B/S) 425 Allowance for Sales Returns (B/S) 443
Receivables (I/S) 443
The £425 million estimated sales returns appear in the “Sales” account of the 2009 consolidated income statement, which represents the net amount Pearson expects to sale after removing sales returns and allowances.
h) Create a T-account for total or gross trade receivables (that is, trade receivables before deducting the provision for bad and doubtful debts and the provision for sales returns). Analyze the change in this T-account between December 31, 2008 and 2009. Assume that all sales in 2009 were on account. That is, they are all “credit sales.” Prepare the journal entries to record the sales on account and accounts receivable collection activity in this account during the year. *(Note: All answers are in £ millions)
28
Figure 3-3: Pearson’s 2009 Trade Receivables
Trade Receivables 5,624
Sales 5,624
Cash 5,679
29
30
CASE STUDY 4: Transactional Accounts Receivable
IntroductionIn this assignment, I was tasked with walking a student through a challenging problem in intermediate accounting. For this, I chose a problem dealing with the journal entries of accounts receivable.
The Problem
Notes receivable $36,000
Accounts Receivable 182,100
Less: Allowance for Doubtful Accounts 17,300 $200,800
a) Accounts receivable of $138,000 were collected including accounts of $60,000 on which 2% sales discounts were allowed.
In order to correctly journalize this transaction, you must multiply the account of $60,000 by the 2% sales discount. Next you will deduct this discount from the account receivable of $138,000. By doing this, you take the sales discount out of the cash that you are receiving from the transaction.
Cash 136,800
Sales Discounts 1,200
31
b) $5,300 was received in payment of an account, which was written off the books as worthless in 2016.
This problem is going to take two different journal entries. When an account receivable is written off as a worthless account, you are crediting account receivable to get the account off of your books. To correct this action, you have to increase your account receivable by the amount that was previously written off, and then credit your Allowance for Doubtful Accounts. Next, you have to recognize the cash that is paid by this client and decrease your accounts receivable to show the
transaction.
Accounts Receivable 5,300
Allowance for Doubtful Accounts 5,300
Cash 5,300
Accounts Receivable 5,300
c) Customer accounts of $17,500 were written off during the year.
This transaction is very similar to the previous problem because you are writing off an account that is not expected to be collected from this client. By debiting the allowance for doubtful accounts, you are writing this
32
Allowance for Doubtful Accounts 17,500
Accounts Receivable 17,500
d) At year-end, Allowance for Doubtful Accounts was estimated to need a balance of $20,000. This estimate is based on an analysis of aged accounts receivable.
For this transaction, Bad Debt Expense will be debited, and Allowance for Doubtful Accounts will be credited. These journal entries are used because both of these accounts are estimates. They are estimating the amount of cash from receivables that could not be collected. To find out the amount of expense is estimated you will take the 17,300 balance of Allowance for Doubtful Accounts (from the chart at the top) and you will add the amount from transaction 2 and deduct the amount from transaction 3. After doing this, you will get a balance of $5,100 ($17,300 + $5,300 - $17,500 = $5,100). Next, you take this balance of $5,100 and you will subtract this from the targeted $20,000 year-end balance. After this step, you get $14,900 ($20,000 - $5,100 = $14,900), which is the estimate of the expense from the accounts that will be uncollected.
Bad Debt Expense 14,900
33
34
CASE STUDY 5: Property, Plant, & Equipment
IntroductionThis case was written to examine the property, plant, and equipment accounts for the year 2007 of the company Palfinger AG. This examination was done in order to be able to analyze their fixed asset and depreciation transactions, understand why their costs are capitalized, and calculate their gains and losses on sales. Below are a series of questions and answers regarding the concepts, process, and analysis of Palfinger AG.
Case Analysis
a) Based on the description of Palfinger above, what sort of property and equipment do you think the company has?
Palfinger AG reports the plant, property, and equipment of land and equipment; underdeveloped buildings, plant and machinery, etc. The reported equipment in the notes to financial statements points to all the equipment used by Palfinger to manufacturer the cranes and any other construction equipment that they offer.
b) The 2007 balance sheet shows property, plant, and equipment of €149,990. What does this number represent?
The 149,990 number represents the December 2007 value for property, plant, and equipment that is used in operations by Palfinger AG. This number
35
has also taken into account the depreciation deducted from the various plant equipment items.
c) What types of equipment does Palfinger report in notes to the financial statements?
In the notes to the financial statements, Palfinger reports that it owns three different groups of property plant and equipment. First, it reports addition to buildings and the company also claims investments in third party buildings. In addition to the buildings, Palfinger reports that it owns plant and machinery and other fixtures, fittings, and equipment.
d) In the notes, Palfinger reports “Prepayments and assets under
construction.” What does this sub- account represent? Why does this account have no accumulated depreciation? Explain the reclassification of €14,958 in this account during 2007.
Prepayments and assets under construction represent the items and projects that have already been paid for and assets that are in the process of being completed. It is an asset that is listed in “prepayments and assets under construction” on the balance sheet until it transfers over to the specific asset once received. This account has no accumulated depreciation because these assets are not yet in use by Palfinger AG. The 14,958, which is reclassified during 2007, arises from the allocation of depreciation from the recently completed projects that just started being used.
36
e) How does Palfinger depreciate its property and equipment? Does this policy seem reasonable? Explain the trade-offs management makes in choosing a depreciation policy.
Palfinger uses the straight-line depreciation method to depreciate its property and equipment. The company owns many types of assets with an allocation of 3-50 years between all relevant assets. This method seems unreasonable because there is a short 8-year building useful life; also, since straight-line is the most consistent, the machinery will depreciate the same amount, even if the machinery does not get used a serviceable amount in a down year. In this case, the machinery would be under-utilized, but over-depreciated.
f) Palfinger routinely opts to perform major renovations and
value-enhancing modifications to equipment and buildings rather than buy new assets. How does Palfinger treat these expenditures? What is the
alternative accounting treatment?
Renovations and value enhancing modifications are capitalized and depreciated over either the new or the original useful life. An alternate method for recording renovations and value enhancing investments would be to charge the modifications made to accumulated depreciation. This choice would be used when the useful life of the PPE is extended and therefore the company would debit the expenditures to accumulated depreciation because the company recaptures some of the past depreciation.
37
g) Use the information in the financial statement notes to analyze the activity in the “Property, plant and equipment” and “Accumulated depreciation and impairment” accounts for 2007. Determine the following amounts:
i. The purchase of new property, plant and equipment in fiscal 2007. Palfinger’s total purchase of PPE in the fiscal year 2007 is 61,444. This number includes the additions for all land, building, equipment, and other PPE.
ii. Government grants for purchases of new property, plant and equipment in 2007. Explain what these grants are and why they are deducted from the property, plant, and equipment account.
The governmental grants are the 733 from both land and
buildings tiers. Palfinger subtracts the amount of the grant from the carrying value of the asset. These grants are withdrawn when the grant is recognized as income over the period necessary to match them with any related costs.
iii. Depreciation expense for fiscal 2007.
Depreciation expense for 2007 is 12,557. This number is the sum of the deprecation expenses from land and buildings, plant and machinery, and other PPE.
38
iv. The net book value of property, plant, and equipment that Palfinger disposed of in fiscal 2007.
The net book value of PPE that Palfinger AG disposed of in 2007 is 1,501 (13,799-12,298). The net value of the 1,501 was computed by taking the net value of acquisitions, 13,799, and deducting the net value from accumulated depreciation, 12,298.
h) The statement of cash flows (not presented) reports that Palfinger received proceeds on the sale of property, plant, and equipment amounting to €1,655 in fiscal 2007. Calculate the gain or loss that Palfinger incurred on this transaction. Hint: use the net book value you calculated in part g iv, above. Explain what this gain or loss represents in economic terms.
Palfinger would incur a gain of 154, since the net book value of PPE is 1,501 but the sale of PPE was 1,655. The gain shown represents the additional money that Palfinger accrues from the sale, since the PPE was sold at a rate above the initial market rate.
i) Consider the €10,673 added to “Other plant, fixtures, fittings, and equipment” during fiscal 2007. Assume that these net assets have an expected useful life of five years and a salvage value of €1,273. Prepare a table showing the depreciation expense and net book value of this
39
equipment over its expected life assuming that Palfinger recorded a full year of depreciation in 2007 and the company uses.
Figure 5-1: Straight-Line Depreciation Chart Year Beginning Balance Depreciation Expense Accumulated Depreciation Ending Balance 1 10,673 1,880 1,880 8,793 2 8,793 1,880 3,760 6,913 3 6,913 1,880 5,640 5,033 4 5,033 1,880 7,520 3,153 5 3,153 1,880 9,400 1,273
Figure 5-2: Double-Declining-Balance Depreciation Chart Year Beginning Balance Depreciation Expense Accumulated Depreciation Ending Balance 1 10,673 4,269 4,269 6,404 2 6,404 2,562 6,831 3,842 3 3,842 1,537 8,368 2,305 4 2,305 922 9,290 1,383 5 1,383 110 9,400 1,273
40
j) Assume that the equipment from part i. was sold on the first day of fiscal 2008 for proceeds of €7,500. Assume that Palfinger’s accounting policy is to take no depreciation in the year of sale.
i. Calculate any gain or loss on this transaction assuming that the company used straight-line depreciation. What is the total income statement impact of the equipment for the two years that Palfinger owned it?
To calculate the loss from the sale of the equipment from part i, you take the ending balance from year one and deduct the proceeds from the sale (8,793-7,500). This gives you a loss from using straight-line method of 1,293. You then add the disposal loss from the depreciation expense of year one of 1,880 to the 1,293. This results in a total income statement impact of 3,173.
ii. Calculate any gain or loss on this transaction assuming the company used double-declining- balance depreciation. What is the total income statement impact of this equipment for the two years that Palfinger owned them?
When using the double-declining balance method, the first year ending balance of 6,404 is removed from the proceeds from the sale, which results in a gain of 1,096 on the disposal. After this
41
is subtracted from the previous year's depreciation expense 4,269, you get an overall income statement impact of 3,173.
iii. Compare the total two-year income statement impact of the equipment under the two depreciation policies.
The total income statement impact is exactly the same for both depreciation methods. The results turn out to be identical because both methods compute the initial cost of the asset of 10,673, minus the proceeds from the sale 7,500, which gives you 3,173. Perception happens to be the main difference in between the methods. One method reports a gain on disposals, while the other gives a loss.
42
43
CASE STUDY 6: Research & Development Costs
IntroductionThis case was written to examine the research and development costs incurred by Volvo Group and the effects their capitalization has on the balance sheet, the income statement, and the statement of cash flows. Volvo Group supplies commercial vehicles including trucks, buses, construction equipment, engines and drive systems as well as aircraft engine components. Below are a series of questions and answers regarding the concepts, process, and analysis of Volvo Group.
Case Analysis
a) The 2009 income statement shows research and development expenses of SEK 13,193 (millions of Swedish Krona). What types of costs are likely included in these amounts?
The costs that Volvo Group is likely to include in its research and development expense line represent expenditures where the enterprise cannot distinguish the research phase from the developmental of internal project to create an intangible asset. These expenditures would probably include development of new products, production systems and software. Also, these expenses are the type of expense that would most likely include various operating expenses that can be deducted as such on a business tax return. Per IAS-38, an example of a research activity would be the search for alternatives for materials, devices, products, etc. While an example of a development activity would be testing of prototypes and models according to IAS-38.
44
b) Volvo Group follows IAS 38—Intangible Assets, to account for its
research and development expenditures. What factors does Volvo Group consider as it decides which R&D costs to capitalize?
When deciphering whether to expense or capitalize R&D costs Volvo Group has to consider if it is in the industrialization phase or not. In most cases, this means that expenditures are capitalized only during the
industrialization phase of a product development project. If the research and development expenses are incurred outside this industrialization phase, then they are charged to income as incurred. If expenditure has a high degree of certainty that they will result in future benefits for the company, then they are considered for capitalization. If this is not true, then the expenditure is
expensed.
c) The R&D costs that Volvo Group capitalizes each period are amortized in subsequent periods, similar to other capital assets such as property and equipment. Notes to Volvo’s financial statements disclose that capitalized product and software development costs are amortized over three to eight years. What factors would the company consider in determining the amortization period for particular costs?
The acquisition value for such intangible assets shall be amortized over the estimated useful life of the assets. In order for these development expenditures to be reported as assets, it must be possible to prove the technical functionality of a new product or software prior to its development being
45
reported as an asset. In determining the useful life of the asset, the Volvo would most likely base it off of the number of periods they would expect to receive future benefit from the asset. The company would also consider and compare the asset to the industry accepted periods for similar types of intangibles.
d) Under U.S. GAAP, companies must expense all R&D costs. In your opinion, which accounting principle (IFRS or U.S. GAAP) provides financial statements that better reflect costs and benefits of periodic R&D spending?
Because IFRS intangible asset guidelines can be extremely subjective when considering what part of R&D can be development, it is in my belief that GAAP provides financial statements that better reflects costs and benefits of periodic R&D spending since GAAP guidelines capture costs in the period in which they occur. This proves the faithful representation of GAAP better recognizes the matching principle.
e) Refer to footnote 14 where Volvo reports an intangible asset for “Product and software development.” Assume that the product and software development costs reported in footnote 14 are the only R&D costs that Volvo capitalizes.
i. What is the amount of the capitalized product and software
46
2009? Which line item on Volvo Group’s balance sheet reports this intangible asset?
The amount of capitalized product and software development costs, net of accumulated depreciation at end of fiscal 2009 would be found by deducting the value of accumulated depreciation and amortization (SEK 25,148) by the value of Intangible assets, acquisition costs (SEK 13,739). This would get you net carrying value in balance sheet of SEK 11,409 for the year 2009. Volvo reports this number in line 2 on the consolidated balance sheet. It is included in intangible assets.
ii. Create a T-account for the intangible asset “Product and software development,” net of accumulated amortization. Show entries in the T-account that record the 2009 capitalization and amortization.
Figure 6-1: Product and Software Development T-Account
Beg. Bal Amounts Capitalized Amortization 448 Adjustment End Bal
Product and Software Development (In SEK 12,381
11,409
3,126
47
f) Refer to Volvo’s balance sheet, footnotes, and the eleven-year summary. Assume that the product and software development costs reported in footnote 14 are the only R&D costs that Volvo capitalizes.
i. Complete the table below for Volvo’s Product and software development intangible asset.
Figure 6-2: Volvo’s Product and software development intangible asset table
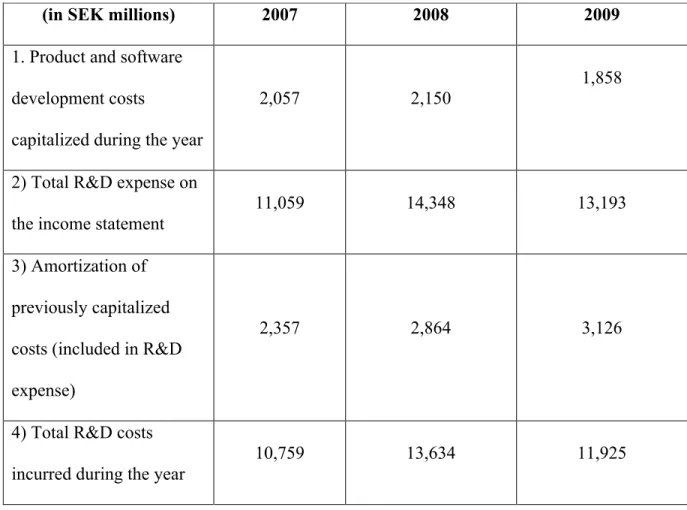
ii. What proportion of Total R&D costs incurred did Volvo Group capitalize in each of the three years?
(in SEK millions) 2007 2008 2009
1. Product and software development costs
capitalized during the year
2,057 2,150 1,858
2) Total R&D expense on the income statement
11,059 14,348 13,193
3) Amortization of previously capitalized costs (included in R&D expense)
2,357 2,864 3,126
4) Total R&D costs incurred during the year
48
To find these proportions, Volvo group took their product and software development costs capitalized during the year and divided it by their total R&D costs incurred during the year.
2007=:5,97;8,579 = 0.1912 or 19.12%
2008=:<,6<48,:75 = 0.1577 or 15.77%
2009=:,272
::,;87 = 0.1558 or 15.58%
g) Assume that you work as a financial analyst for Volvo Group and would like to compare Volvo’s research and development expenditures to a U.S. competitor, Navistar International Corporation. Navistar follows U.S. GAAP that requires that all research and development costs be expensed in the year they are incurred. You gather the following information for Navistar for fiscal year end October 31, 2007 through 2009. (in US $ millions).
i. I used information from Volvo’s eleven-year summary to
49
Figure 6-3: Volvo’s Research and Development Expenditures Table
Figure 6-4: Volvo’s Sales and Assets Table
h) Calculate the proportion of total research and development costs incurred to net sales from operations (called, net sales from
manufactured products, for Navistar) for both firms. How does the proportion compare between the two companies?
To find these proportions, Navistar and Volvo took their total R&D costs incurred during the year, expensed on the income statement and divided those by their net sales of manufactured products. Volvo group appears to be increasing their R&D spent in proportion to its net sales by approximately 1% per year for three consecutive years. Navistar, on the other hand, has increased
(in US $ million) 2007 2008 2009
Total R&D costs incurred during the year, expensed on the income statement
375 384 433
Net sales, manufactured
products 11,910 14,399 11,300
Operating income before
tax (73) 191 359
(in SEK millions) 2007 2008 2009
Net sales, industrial operations 276,795 294,932 208,487 Total assets, from balance sheet 321,647 372,419 332,265
50
their spending by a little over 0.5% over three years. Although net sales dropped off in 2009, we note that there is still an increase in spending for both companies. Navistar Group: 2007=::,;:5<97 = 0.0315 or 3.15% 2008=:4,<;;<24 = 0.0267 or 2.67% 2009=::,<554<< = 0.0383 or 3.83% Volvo Group: 2007=896,97;:5,97; = 0.0389 or 3.89% 2008=8;4,;<8:<,6<4 = 0.0453 or 4.53% 2009=852,429::,;87 = 0.0572 or 5.72%
51
52
CASE STUDY 7: Splunk, Inc. Data Analytics Summary
IntroductionIn this case, I was tasked with finding a new upstart data analytics software company that could apply to the accounting world. With the rise in technology use in business over the past few years, Data analytics has grown to become a major part of everyday business life. Because of this, I think the major firms in the accounting world should adapt Splunk. Splunk, as I will explain into much more detail later, is a software platform that gathers and consolidates data for its user. Most people in the business world have heard of Splunk, but could they describe what it does for a colleague in a few sentences? Probably not. Splunk, as a product, does not fit in any of the traditional categories but somehow stands apart from the pack.
Case Analysis
a) Identify the history and purpose of this tool and describe, in general, how it is used to make business decisions. Be specific about what kind of technology platform it uses, etc. and other resources that need to be in place to fully utilize the functionality of the tool.
Splunk, Inc. is an American corporation founded in San Francisco, California. Started by current CEO Michael Baum, Erik Swan, and Rob Das, Splunk’s original purpose was to dramatically improve the process of cataloging log file data. Michael Baum’s previous job of running Yahoo’s e-commerce applications for over 12,000 servers, spurred him to create Splunk. He came to
53
this understanding after realizing the amount of time and resources weeding through log file date with primitive tools took.
Splunk, as a product, is a software platform used to make machine data accessible across the organization by diagnosing problems, providing intelligence, identifying patterns, etc. Splunk has a variety of different uses, some of which include application management, web security, and web analytics. Specifically, Splunk collects and indexes high volumes of machine data, regardless of their format or location, so that it can do the data processing for you. Once it processes and extracts the relevant data, Splunk allows you to be able to easily trace where and what the problems were. Splunk gathers and summarizes this data from all of the sources making up a firm's IT infrastructure, including websites, applications, sensors, and devices.
b) What special skills are needed to use this tool to aid in business decision making? How might a student like yourself gain those skills?
Individuals, who intend to use Splunk, are not required to have extensive knowledge of data analytics or technology in order to successfully use Splunk software. Barb Darrow of GIGAOM says it best when she says that one of the main advantages that Splunk has to offer is that, “a mere mortal — not a data scientist — can work with Splunk to put that data into an easily understood visual format (Darrow).” However, while Splunk can be easy to operate and maintain, the users must have a few modest skills to operate it, such as simple knowledge of Splunk and the time to get familiar with their software. This is primary reason that
54
Splunk is used by 85 of the Fortune 100 companies. Because of this, there is no reason a mere student like me cannot add Splunk to my particular set of skills. Any user of this software will only need to have knowledge about their specific firm, so that they can efficiently arrange the data in a way that will be convenient for those making decisions within the firm.
c) How, specifically, would you use the tool in the following business settings? Create at least three specific scenarios for each category in which the tool would lead to more efficiency and/or better effectiveness.
A. Auditing
First off, imagine a scenario where an individual is working tirelessly to finish his internal audit of a company’s employee behavior. Attaining this information will lead to a greater managerial efficiency within the firm, and Splunk can help to obtain and assemble this raw data about employees and turn it into information suitable for use by the auditor. Splunk offers several features that the auditor could use to present and communicate their outcomes. After using this data for the audit, the auditor could then pass this information along to managers so that the firm can be made more efficient.
Secondly, consider a scenario where an individual is performing an external audit on a given company. This could be a grocery store with a large inventory or sales volume, where large amounts of data are being produced each day. While using the real-time data plug-in associated with Splunk, the external auditor would be able to accomplish a more efficient
55
audit by having more appropriate samples of data from which to evaluate. This information can also allow for more useful and significant data for potential investors or customers.
Lastly, take into consideration a scenario where an individual is performing an IT audit on a company. These audits are quite important because without them, a company would not be able gauge the
effectiveness of the IT infrastructural controls in place at the firm. With the use of Splunk, an IT auditor can assess the security of the firm’s IT infrastructure, while also evaluating the effectiveness of the firm’s IT network.
B. Tax Planning
First, imagine a scenario where an individual is gathering the information required to perform tax work for a firm with a large volume of payroll expenses. The use of Splunk in this process comes into play with the filing of paperwork to IRS. This software will be able to assist in this filing by sifting through large amounts of data from employees and vendors and identifying the various individuals to file forms.
Secondly, consider a scenario where an accountant is researching for new and improved ways to reduce taxes for firms. By using Splunk, the tax accountant can use real-time data to find specific trends and improve results. This software will allow for increased efficiency in the
56
firm by way of cutting expenses and stimulating short-term and long-term growth.
Lastly, Splunk could be used in a scenario where an accountant is doing tax work for a large establishment with multiple separate holdings. Splunk’s software would be able to pull from all areas of the firm to conglomerate it into one place. Thus, this allows the accountant to use the various features Splunk offers to organize the information in a way that is beneficial to the accountant.
C. Financial Statement Analysis/ Valuation/ Advisory
Firstly, consider a scenario where a consultant to a firm is trying to improve the relations to the firm’s clients. In order to gather this
information in a way that is beneficial to the firm, the consultant can use Splunk’s software. This software would allow for a more tangible way to improve the company to customer relationship.
Secondly, imagine a scenario where a company is working to gather information on a certain good for a company, such as specific buying and selling trends, cost of the goods sold, etc. For example, if a manufacturing firm wanted to check to see how the fluctuation of the price of a raw material could affect the price of that finished good, Splunk would allow for the firm to view this data without having to collect and calculate it themselves. This can allow the firm to make more accurate
57
predictions about the future revenues and the expenses associated with them, which allows the company to operate more efficiently.
Lastly, consider a scenario where an accountant operating in an advisory position is working with a firm to prevent a fraudulent situation from occurring. To investigate the company, this accountant would have to analyze every one of the company’s ethics, compliance programs, employees. With Splunk, the raw data on employees and programs would be found and pooled together into a place where the information is now beneficial to the accountant. This allows for greater efficiency in time management and more proficient results.
d) Write a few paragraphs to your future public accounting partner explaining why your team should invest in the acquisition of and training in this tool.
Our team should invest in the acquisition of Splunk in addition to our existing IT software because implementing this software has the potential to improve efficiency within the firm. In addition to this, the software gives its employees an additional resource to provide insight into how we obtain the information that influences the decision making of our investors and customers. Splunk, as a product, can offer something to improve every aspect of our company, from Auditing to Taxation to Advisory services. If our firm can find that the cost of implementing Splunk is manageable, then it will see that the benefits greatly outweigh the cost of applying it to your daily lives. Because of the internal and external benefits previously listed, I highly recommend that the company invest in Splunk.
58
Compared to any other software platform, Splunk stands out because of its ability to improve efficiency through organization of real-time data. Technology has obtained an ever-growing role in the business world today, and with the application of Splunk to the company, we would be able to tap into the benefits technology offers. The widespread impact that this could have on the accounting field is astounding. Auditors could provide more accurate information to clients with an even greater quantity in less the time because of Splunk’s ability to quickly sift through information. I would highly encourage looking into this program.
59
60
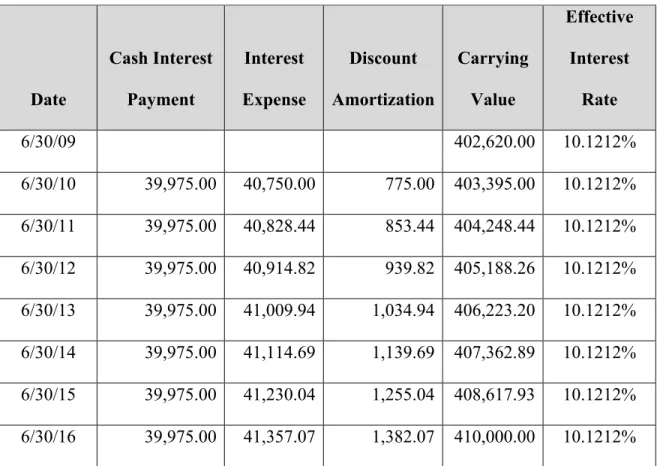
CASE STUDY 8: Long-Term Debt
IntroductionThis case was written to grasp a better understanding of long-term debt accounting and the different ways of reporting debt. Rite Aid Corporation, the third largest retail pharmacy in the United States, sells a wide assortment of products and merchandise, including over-the-counter medications, health and beauty aids, household items, and convenience foods. To get to this position in the pharmacy industry, Rite Aid had to utilize a very important way of acquiring capital and funding… long-term debt. Long-term debts are liabilities that will not be paid off in the current year or operating cycle, whichever is longer. The balance sheet of Rite Aid Corporation offers some great examples of the different kinds of long-term debts that they utilize. Below are a series of questions and answers regarding the concepts, process, and analysis of Rite Aid.
Case Analysis
a) Explain the difference between Rite Aid’s secured and unsecured debt. Why does Rite Aid distinguish between these two types of debt?
The difference between Rite Aid’s secured and unsecured debt is that the secured debt has assets attached to it as collateral, which the creditor will receive in the case that Rite Aid cannot pay off its account. Unsecured means that there is no collateral committed to it to guarantee the note gets paid in some shape or form. These two different forms are distinguished by Rite Aid because if Rite Aid is not able to pay, the users of the financial sheet would want to know how much of their debt is guaranteed by assets. If Rite Aid was to file for bankruptcy, the
61
secured creditors would be entitled to the collateral that guaranteed the loan in the first place.
b) What does it mean for debt to be “guaranteed”? According to note 11, who has provided the guarantee for some of Rite Aid’s unsecured debt?
A guaranteed debt is a loan that is guaranteed by a third party in the event that the person who borrowed the money cannot pay their debt. It means that in the event that the borrower cannot pay, the third party promises to assume the remaining debt obligation. Rite Aid’s Wholly owned subsidiaries are their third-party guarantors.
c) What is meant by the terms “senior,” “fixed-rate,” and “convertible”? In Note 11, Rite Aid uses the terms “senior,” “fixed-rate,” and
“convertible,” but does not go into much detail about them. Senior means that the debt holders own the highest priority to get paid should the firm fall into
bankruptcy. Fixed-rate denotes that the interest rate is consistent throughout the life of the debt. Convertible is a type of bond that allows bondholders to convert their bond into common stock when certain conditions are met.
d) Speculate as to why Rite Aid has many different types of debt with a range of interest rates.
Rite Aid has many different types of debt and interest rates, like secured and unsecured debt and guaranteed debts. They do this because they may need
62
different sources of financing so that they can fund the many assets of the firm. Rite Aid could not realistically attach all debts to assets because of the varying risk profile between the different types of debt.
e) Consider note 11, Indebtedness and Credit Agreement. How much total debt does Rite Aid have at February 27, 2010? How much of this is due within the coming fiscal year? Reconcile the total debt reported in note 11 with what Rite Aid reports on its balance sheet.
Rite Aid has $6,370,899 worth of total debt as of February 27, 2010. You get this total debt by summing the long-term debt, lease financing obligations, and current maturities of long-term debt accounts that are found on the Balance Sheet (6,185,633,000+133,764,000+51,502,000). $51,502,000 is due within the
upcoming fiscal year.
f) Consider the 7.5% senior secured notes due March 2017. i. What is the face value of these notes?
The face value of the note is $500,000. It was issued at par value since there is no change between 2009 and 2010.
ii. Prepare the journal entry that Rite Aid must have made when these notes were issued.
Dr. Cash 500,000