Investor Sentiment and Cross-Sectional
Stock Returns
Wenjie Ding
Department of Accounting and Finance of Cardiff Business School,
Cardiff University
A Thesis Submitted in Partial Fulfillment of the Requirements for the
Degree of Doctor of Philosophy of Cardiff University
Declaration
Wenjie Ding November 2018
Acknowledgements
I would like to express my utmost gratitude to my first supervisor Dr Qingwei Wang, for his invaluable supervision of this dissertation and for his generous support throughout my PhD program. I benefit tremendously from his ideas, experience and expertise in finance. He imparts his knowledge and enthusiasm in academic research to me. I am fortunate to have him as my mentor. Without his support, I would never have experienced all the sweets and joys in conducting research on this topic that I personally find very intriguing.
My utmost gratitude also goes to my second supervisor, Prof Khelifa Mazouz. He generously gives me diligent and helpful comments on my dissertation and shared his experience in pursuing an academic career with me. He has continuously encouraged me to fulfill my potential and to be confident. I could not be more grateful for his trust in my competence.
I would also like to thank my co-author, Prof Owain ap Gwilym, for his consistent support and help. My gratitude also goes to Prof Dylan Thomas, who offered enlightening comments on my papers. I have learned a lot from interactions with them. I am grateful to Prof Longbin Xu, who led me into the academic world, inspired my interest in Behavioural Finance, and thoroughly trained me to be prepared for my doctoral research.
I am grateful to all the conference and seminar audiences that have contributed towards shaping this thesis. I am indebted to Prof Malcolm Baker, Prof Jason Xiao, Dr Woon Sau Leung, Dr Danial Hemmings, Prof Nick Tylor, Dr Nikolaos Karampatsas, Prof Darren
vi
Duxbury, Dr Apostolos Kourtis, Dr Patrycja Klusak, Dr Huong Vu, Dr Vu Tran, and many other audiences, for their critical comments and constructive suggestions.
This thesis is dedicated to my parents, Mr Fenggui Ding and Ms Hongzhen Feng. I could never achieve my goal without their support. I would also like to thank my husband, Dr Xiaobo Cheng, for encouraging me to further my education and for fighting along my side for the whole time.
My work was funded by a joint scholarship from Cardiff University and China Scholarship Council (CSC).
Abstract
This thesis consists of three essays on investor sentiment and the cross-section of stock returns.
The first essay extends Delong, Shleifer, Summer and Waldmann’s (1990) noise trader risk model into a model with multiple risky assets to show the asymmetric effect of sentiment in the cross-section. Guided by my model, I also find that the effect of investor sentiment can be decomposed into long- and short-run components. The empirical tests in the first essay of the thesis present a negative relationship between long-run sentiment component and subsequent stock returns and a positive association between the short-run sentiment and contemporaneous stock returns.
The second essay explores a previously unexamined sentiment channel through which technical analysis can add value. I construct a daily market TA sentiment indicator from a spectrum of commonly used technical trading strategies. I find that this indicator significantly correlates with other popular sentiment measures. An increase in TA sentiment indicator is accompanied by high contemporaneous returns and predicts high near-term returns, low subsequent returns and high crash risk in the cross-section. I also design trading strategies to explore the profitability of my new TA sentiment indicator. My trading strategies generate remarkable and robust profits.
The third essay focuses on exploring the profitability of trading strategies based on Implied Volatility indicator (VIX) from the sentiment perspective. My trading strategies
viii
involve holding sentiment-prone stocks when VIX is low and sentiment-immune stocks when VIX is high. This shifting asset allocation strategies are based on Abreu and Brunnermeier’s (2003) delayed arbitrage theory and the asymmetric effect of investor sentiment in the cross-section. I find sentiment-prone stocks have larger one-day forward returns following high sentiment and vice versa. My trading strategies generate substantial higher returns than benchmark portfolios, and the excess returns are not subsumed by well-known risk factors or transaction costs.
Thesis Supervisor: Dr. Qingwei Wang
Table of contents
List of figures xiii
List of tables xv
1 Preface 1
1.1 Background . . . 1
1.2 Motivations . . . 6
1.2.1 Asymmetric Effect of Sentiment in the Cross-Section . . . 6
1.2.2 Technical Analysis: Mumbo Jumbo or A Crystal Ball . . . 7
1.2.3 Profitability of Exploring Sentiment-Driven Momentum . . . 10
2 Literature Review 13 2.1 Investor Sentiment Measures . . . 14
2.1.1 Survey-Based Sentiment Indicators . . . 14
2.1.2 Textual-Analysis Sentiment Indicators . . . 15
2.1.3 Market-Based Sentiment Indicators . . . 16
x Table of contents
2.2 Investor Sentiment and Stock Returns . . . 20
2.2.1 Effect on Aggregate Market and Cross-Sectional Returns . . . 20
2.2.2 Momentum and Reversal Effects of Sentiment on Returns . . . 23
2.3 Technical Analysis and Investor Sentiment . . . 26
2.3.1 The Efficiency of Technical Analysis . . . 26
2.3.2 Theoretical Explanations for the Use of Technical Analysis . . . 27
2.3.3 Connections between Sentiment and Technical Analysis . . . 32
3 New Theory and Decomposed Effects of Sentiment 35 3.1 Introduction . . . 35
3.2 A Cross-Sectional Noise Trader Risk Model . . . 39
3.3 Data . . . 47
3.3.1 Portfolio Construction . . . 47
3.3.2 Decomposition of Investor Sentiment . . . 52
3.4 Empirical Results . . . 58
3.4.1 Decomposed Sentiment and Cross-Sectional Returns . . . 58
3.4.2 Robustness Checks . . . 66
3.5 Conclusion . . . 70
4 Technical Analysis Sentiment and Stock Returns 71 4.1 Introduction . . . 71
4.2 Data and Sample Construction . . . 76
Table of contents xi
4.2.2 Portfolio Construction . . . 85
4.3 Empirical Tests . . . 88
4.4 Simple TA Trading Strategies . . . 100
4.4.1 Implementation on Cross-sectional Long-short Portfolios . . . 100
4.4.2 Implementation on Decile Portfolios . . . 113
4.4.3 Tradability of TA Trading Strategies . . . 120
4.5 Conclusion . . . 126
5 Profitability of VIX-Based Sentiment Trading Strategies 127 5.1 Introduction . . . 127
5.2 Related Literature . . . 132
5.3 Research Design and Data Sources . . . 135
5.4 Empirical Results . . . 137
5.4.1 Predictive Regressions . . . 137
5.4.2 Two-Way Sorts . . . 143
5.5 VIX-Based Trading Strategies . . . 145
5.5.1 Robustness Checks . . . 152
5.6 Conclusion . . . 156
6 Conclusion 159
References 165
xii Table of contents
Appendix B Sentiment-Prone Level Measures 179
Appendix C Details of the Wild Bootstrap Procedures 181
Appendix D Description of Technical Trading Rules Employed in Constructing
TA Sentiment 183
D.1 Filter Rules (FR) . . . 183
D.2 Moving Average Rules (MA) . . . 184
D.3 Support and Resistance (SR, or Trading Range Break) Rules . . . 186
D.4 Channel Breakout Rules (CBO) . . . 187
Appendix E Some Robustness Tests 189 E.1 Robustness Tests for Chapter 3 . . . 189
E.2 Robustness Tests for Chapter 4 . . . 196
E.2.1 Validate TA Sentiment by Predicting Future Crash Risk . . . 196
E.2.2 Robustness Tests on Predictive Regression . . . 200
E.2.3 Construct TA Sentiment (Returns) with Different Methods . . . 207
E.2.4 Robustness Tests on Profitability of TA Sentiment . . . 214
List of figures
3.1 Moving Average Based Decomposition of BW Sentiment Index . . . 55
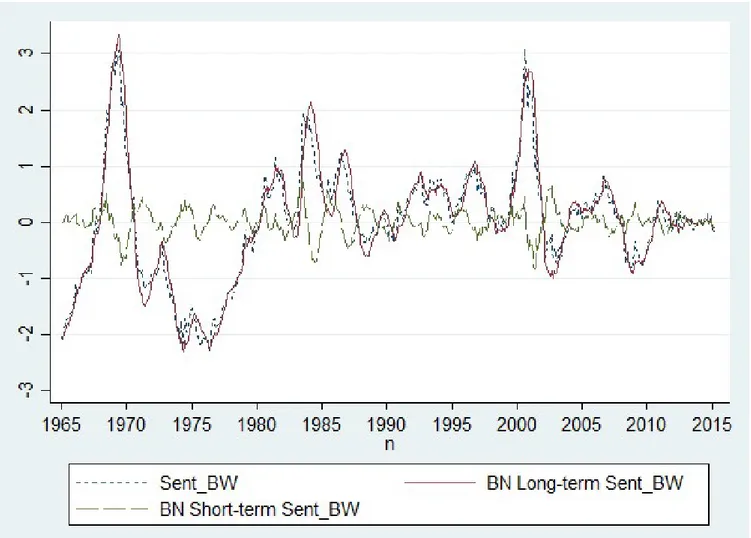
3.2 Beveridge-Nelson Decomposition of BW Sentiment Index . . . 56
4.1 TA Sentiment Index and NBER-Dated Recession . . . 79
4.2 TA Sentiment Index and Bull-Bear Spread . . . 80
4.3 TA Trading Strategy Profit over Time . . . 109
4.4 Impulse Response of Long-Short Portfolio Returns to TA Sentiment . . . . 110
4.5 Statistics of Decile Portfolio Sentiment Timing Performance . . . 114
5.1 Two-Way Sorts: One-Day Forward Returns Sorted on VIX Levels and Sentiment-Exposure . . . 144
E.1 TA Trading Strategy Profit Compared with Momentum Returns . . . 215
E.2 TA Trading Strategy Profit Compared with S&P 500 Index Returns . . . 216
List of tables
1.1 A Brief Summary of Research Topics in This Thesis . . . 5
3.1 Summary Statistics . . . 51
3.2 Regressions of Monthly Cross-Sectional Returns on Decomposed Sentiment 60 3.3 Decile Portfolio Returns and Decomposed Sentiment . . . 64
3.4 Time-Varying Market Betas . . . 68
4.1 Summary Statistics of the Sentiment Indicators . . . 82
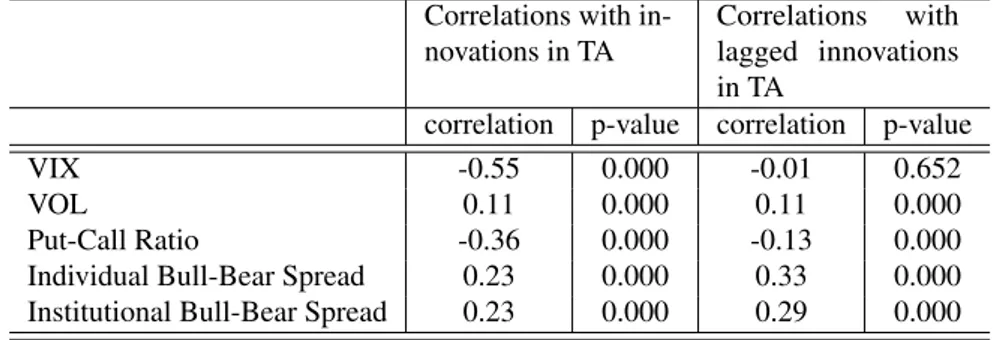
4.2 Correlations of Innovations in Sentiment Indicators . . . 84
4.3 Contemporaneous Regressions of Portfolio Returns on TA Sentiment Changes 89 4.4 Predictive Regressions of Portfolio Returns . . . 92
4.5 Conditional Market Beta Loadings . . . 95
4.6 Profitability of TA Trading Strategies . . . 102
4.7 Market Timing Tests for TA Trading Strategy Profit . . . 106
4.8 Summary Statistics of Timing Decile Portfolios . . . 116
xvi List of tables
4.10 Trading Frequency and Holding Time . . . 121
4.11 Profits and BETCs with Alternative Horizons for TA Timing Signals . . . . 123
5.1 Regressions of Portfolio Returns on Lagged VIX . . . 141
5.1 Regressions of Portfolio Returns on Lagged VIX (Continued) . . . 142
5.2 Summary Statistics of the Profitability of VIX-Based Trading Strategy . . . 146
5.3 Abnormal Alphas of RVIX . . . 148
5.4 Market Timing Tests On VIX Based Trading Strategy . . . 151
5.5 Returns and BETCs on Different VIX Trading Signal Horizons . . . 153
B.1 Definitions of Sentiment-Prone Level Measures . . . 180
E.1 Regressions of Monthly Cross-Sectional Returns on Other Decomposed Sentiment Measures . . . 191
E.2 Regression Results when Long-Run Sentiment Measured with Different Horizons . . . 192
E.3 Regression Results during High/Low Sentiment Periods . . . 193
E.4 Effects of Decomposed Investor Sentiment after Controlling for Investor Attention . . . 194
E.5 Regressions of Monthly Value-Weighted Returns on Decomposed Sentiment 195 E.6 Forecasting Cross-Sectional Crash Risk . . . 199
E.7 Predictive Regressions of Portfolio Returns on More TA lags . . . 202
E.8 Predictive Regressions of Portfolio Returns on TA Sentiment Controlled for Macroeconomic Variables . . . 203
List of tables xvii
E.9 Predictive Regressions of Portfolio Returns Controlled for Liquidity . . . . 204
E.10 Predictive Regressions of Portfolio Returns Controlled for VIX . . . 205
E.11 Predictive Regressions of Portfolio Returns on Orthogonalized TA lagged Terms . . . 206
E.12 Predictive Regressions of Portfolio Returns on DJIA-Based TA Sentiment . 208 E.13 Profitability of DJIA-Based TA Trading Strategies . . . 209
E.14 Predictive Regressions of Portfolio Returns on Performance-Weighted TA Sentiment . . . 210
E.15 Profitability of Performance-Weighted TA Trading Strategies . . . 211
E.16 Predictive Regressions of Value-Weighted Returns on TA Sentiment . . . . 212
E.17 Profitability of TA Trading Strategies on Value-Weighted Portfolio . . . 213
E.18 Regressions of Portfolio Returns Controlled for Controlled for Macroeco-nomic Variables . . . 219
E.19 Regressions of Portfolio Returns Controlled for Liquidity . . . 220
E.20 Profitability of VXO Trading Strategies . . . 221
E.21 Profitability of VXN Trading Strategies . . . 222
E.22 Profitability of VXD Trading Strategies . . . 223
E.23 Profitability of VIX Trading Strategy on Value-Weighted Portfolios . . . . 224
E.24 Returns and BETCs with Different Thresholds to Define High VIX . . . 225
E.25 VIX Timing Strategy on Cross-Sectional Long-Short Portfolios . . . 226
Chapter 1
Preface
This thesis explores the effect of investor sentiment on the US market cross-sectional stock return. My focus is on 1) demonstrating the asymmetric effect of investor sentiment in the cross-section as stocks have different sentiment-prone level, 2) investigating not only the reversal effect of investor sentiment on future return in the long-run but also the momentum effect of investor sentiment in the short-run based on the delayed arbitrage theory, and 3) testing the profitability of the short-run momentum caused by investor sentiment and delayed arbitrage. This thesis aims at contributing to existing literature on investor sentiment and asset pricing.
1.1
Background
"I could calculate the motions of the heavenly bodies, but not the madness of the people."
The quote may have or have not been uttered by Issac Newton but the story that he pocketed massive profit during the South Sea Bubble and suffered a greater loss during the
2 Preface
following burst of that bubble is grounded in truth. Even one of the greatest physicists in human history found it hard to be entirely rational and form an unbiased belief on asset prices.
Traditional finance models assume agents are rational. Rational investors have the correct belief on asset pricing following Bayes’ Law and make decisions on Savage’s notion of Subjective Expected Utility. Though traditional finance models deliver appealingly clear and straightforward message, they do not match with data in reality very well. Prof. Richard Thaler, the laureate of 2017 Nobel Memorial Prize in Economic Sciences, once said that "When an economist says the evidence is ’mixed’, he or she means that the theory says one thing and the data says the opposite". The most striking anomalies that traditional finance models fail to explain include the Equity Premium Puzzle (i.e., the stock market generates a substantial excess return), the Volatility Puzzle (i.e., the stock market returns are more volatile than expected in models), and the Return Predictability Puzzle (i.e., the stock returns are predictable, which does not fit the Efficient Market Hypothesis).
Behavioural Finance relaxes the assumption on investor rationality, allowing some agents to be not fully rational. Another important founding block of behavioural finance is the concept of limit on arbitrage. The traditional finance campus may argue that rational agents will push irrational ones out of the market through arbitrage action in an economy without market friction. However, a series of theoretical and empirical studies show that limits on arbitrage exist in the market (e.g., Shleifer and Vishny, 1997), which enables irrational investors to be long-lived and have an essential impact on asset prices.
Irrationality arises when people form beliefs and arises on people preferences. Ample experiments compiled by cognitive psychologists demonstrate extensive evidence that in-vestors can have biased belief, such as Overconfidence, Representativeness, Conservatism, Anchoring, Belief Perseverance, and so on (see Barberis and Thaler (2003) for a more detailed description). The following are some examples of biased behaviour. One kind of
1.1 Background 3
Overconfidence is that investors place more weight on the private information they work hard to obtain. A typical example of Representativeness behaviour is that people expect a small sample reflect the properties of the whole population. Conservatism means the tendency of investors underweight new information compared with the prior information. The irrationality assumption better fits the reality.
The two cornerstones for behavioral finance is the investors’ irrationality and the limit of arbitrage. The first core argument of behavioural finance is that the market is not perfect and investors are not always rational. Irrational investors matter when there is limit on arbitrage. The irrational bullish/bearish belief can leads to overprice/underprice, and the mispricing persists when arbitragers fail to effectively bet against irrational investors.
The limit of arbitrage is a theory that price could remain in a non-equilibrium state for protracted periods due to the restrictions on the rational investors’ capital to arbitrage away the mispricing. Different from the textbook definition, arbitrage in reality requires capital and entails risk. The restrictions on arbitrage comes from several sources1. For example, arbitragers might be forced to liquidate their position when the asset price move against them; short-selling are costly and not always available; the arbitragers fund managers has short investment horizon as their performance are evaluated frequently by their creditors/investors.
To better understand the effect of agents’ irrationality on asset prices, this thesis investi-gates the effect of investor sentiment on stock market returns in the first essay. The other two essays focus on a certain kind of limit of arbitrage, i.e. the delayed arbitrage action due to the lack of coordination among arbitragers. I show that sentiment-induced mispricing can deepen in the short-run because of the delayed arbitrage.
Broadly defined, investor sentiment is a biased belief about future cash flows and in-vestment risk. When there is a limit to arbitrage, investor sentiment pushes asset prices away from fundamental values. The link between investor sentiment and asset returns has
4 Preface
received considerable attention in the past two decades. The concept of investor sentiment is repeatedly mentioned in the studies of bubbles and crashes. Investor sentiment has been demonstrated to have a vital influence on the stock market. For instance, Datst (2003) shows that the effect of investor sentiment on stock return far exceeds the effect of fundamental factors during the extreme low or high sentiment periods.
This thesis consists of three essays on the relationship between investor sentiment and the cross-section of stock returns. This research on investor sentiment is of essential importance to better understand the patterns in the stock market and of practical value in forming investment decisions. In short, I theoretically demonstrate how sentiment-sensitivity leads to stronger predictability of investor sentiment in the cross-section than on the aggregate market in the first essay. The second essay shows that the usefulness of technical analysis could be connected with investor sentiment. Combining the delayed arbitrage theory with the effect of investor sentiment, I find a strongly profitable sentiment-induced return momentum in the cross-section. Table 1.1 gives a map road of this thesis.
T able 1.1 A Brief Summary of Research T opics in This Thesis Fisrt Essay Second Essay Third Essay Research issues What is the theoretical support for the ef fect of in v estor sentiment in the cross-section? Can in v estor sentiment explain the v alue of technical analysis? Is it profitable to ride the sentiment-induced short-run momenutm? Where we stand Empirical lit erature find extensi v e evidence of in v estor sentiment in the cross-section and in-conclusi v e evidence on the aggre g ate mark et. Ho we v er , pre vious models on in v estor senti-ment are all applica b le for explaining the ef fect of in v estor sentiment on the aggre g ate mark et. Most papers on technical analysis focus on testing the profitablity of technical trading rules. Only a fe w theoretical studies ex-plain the usefulness of technical analysis through the fundamental channel; it tak es time for the mark et to incorporate funda-mental information into price and techni-cal analysis helps capture the fundamental information. Ample paper s look into the long-run re v ersal ef fect of in-v estor sentiment and deem in v estor sentiment as a contrar -ian indicator of future returns. The beha v orial econom ists who act as fund managers also claim that their trading ph ylosoph y is to benefit from the return re v ersal p redicted by in v estor sentiment.Abreu and Brunnermeier (2003) propose that lack of coordination among arbitragers lead to dela y e d arbitrage act ions, which im p lies that b ubbles persist when in v estors are b ullish. Y et empirical studies ha v e paid little attention on the profitability of sentiment-induced momentum. What I do My contrib ution is to extend the DSSW noise trader risk model by introducing another risk y asset and dif ferentiate the tw o risk y assets by assigning them with dif ferent sentiment-prone le v el to the o v erall mark et sentiment and id-iosyncratic sentiment component. This addi-tional assumpition directly depicts the intuiti v e observ ation of Bak er and W ur gler (2006) that stocks v aries in their sentiment-prone le v el. I ar gue that techincal analysis captures in-v estor sentiment in the mark et. T o support our ar gument, I propose a ne w mark et-wide sentiment measure based on the forecasts of a wide spectrum of technical trading rules. I v erify my T A sentiment inde x by sho wing its correlation with other sentiment indicators and its pre-dictability on the sentiment-induced future return momentum and re v ersal. I use the daily VIX, a widely-accepted "fear guage", to time the mark et and shift asset allocation across stocks. The trading strate gy is to hold sentiment-immune stocks when VIX is substantially high and to hold sentiment-prone stocks o therwise. My in v estment ph ylosoph y com-bines the delaged arbitrage theory with the flight-to-quality ar gument to benefit from the sentiment-dri v en b ubble and to dodge the sentiment-induced crash. My find-ings 1) My model deri v ations captures well that sentiment has asymmetric ef fect on the assets with dif ferent sent iment-le v el, and asset that are more sentiment-prone aslo tend to ha v e higher noise trader risk. 2) The extended model gi v es a ne w h ypothesis that both long term and short in v estor sentiment jointly af fect cross-section stock returns and my empirical tests confirms long-term sentiment componet ne g-ati v ely predicts return while short-term senti-ment posti v ely v aries with return. My T A inde x, the forecasts of technical trading rules on the o v erall mark et, signfi-cantly correlates with other sentiment in-dicators. T A inde x has a short-run mo-mentum ef fect and long-run re v erasl ef-fect on future returns just as a sentiment indicator has. Furthermore, this T A indi-cator performs well in profiting fr om the sentiment-induced return premium in the cross-sectional stock mark et. The annualized returns of VIX trading strate gies range from 22.05% to 42.38%. VIX-based trading strate gies generally outperform the benchmark portfolios by o v er 17%, and the excess abnormal returns adjusted for well-kno wn pricing factors are all signficantly higher than 10%. The returns of VIX trading strate gies survi v e the trans-action test and could not be totally explained by mark et microeconomic or microstructure factors. In short, VIX is strongly profitable when seen as a sent iment indicator to benefit from the sentiment-induced momentum.
6 Preface
1.2
Motivations
1.2.1
Asymmetric Effect of Sentiment in the Cross-Section
There are some interesting gaps in the existing literature on investor sentiment. For instance, empirical studies predominately show that investor sentiment has a strong predictive effect in the cross-section but little effect on the aggregate market level, despite almost all investor sentiment models containing only one risky assets. With one risky asset in the model setting, the model provides propositions for the aggregate market rather than the cross-sectional market. Whatever conclusion holds in the aggregate market does not necessarily hold in the cross-section in the existing theoretical models. Therefore, Chapter 3 presents the first rigorous and parsimonious model demonstrating the effect of sentiment on the cross-sectional return of a sentiment-prone asset over a sentiment-immune asset.
Why is it essential to look into the cross-sectional stock market for the effect of in-vestor sentiment? The reason is that stocks differs in their sensitivity to inin-vestor sentiment. Sentiment-prone stocks are more attractive to speculative demands and more difficult to arbitrage. This thesis extends the DSSW model by introducing multiple risky assets that differ in their exposure to market-wide sentiment. Suppose that there are two risky assets, A and B, and that irrational investors’ beliefs are biased more upwards (downwards) to-wards A than B when market sentiment is high (low). Thus, asset A has higher exposure to market-wide sentiment (more sentiment prone) than asset B. When investor sentiment is unpredictable, this assumption also implies that the equilibrium returns of asset A will fluctuate more with the shifts in market sentiment, hence posing higher noise trader risk to rational arbitrageurs, than those of asset B. My extended model effectively captures the intuitive observation that stocks more prone to investor sentiment are also more difficult to arbitrage (Baker and Wurgler, 2006). It also predicts that market-wide sentiment leads to relatively higher contemporaneous returns and lower subsequent returns for stocks more
1.2 Motivations 7
prone to sentiment and difficult to arbitrage.
Guided by my extended noise trader risk model, I also find that the effect of investor sentiment could be decomposed into long- and short-run components. Prior studies has investigated the relationship between investor sentiment and short-run return and long-run returns, but the effect of long-run investor sentiment and short-run sentiment on the future return are not explicitly clarified. In reality, investor sentiment could be persistently bullish for several periods; hence, decomposing investor sentiment into the long-run component and the short-run shock is of essence. Empirical studies either show that stock return is positively related to contemporaneous investor sentiment changes or that it is negatively associated with the previous investor sentiment level. By decomposing investor sentiment into the short-term incremental component and the long-term average component, I integrate the opposite effect of the two decomposed components. The empirical evidence shows that long-run sentiment negatively predicts cross-sectional returns while short-run sentiment contemporaneously correlates with the returns.
1.2.2
Technical Analysis: Mumbo Jumbo or A Crystal Ball
Technical analysis is a method of forecasting the direction of price movement through study-ing past price (volume) pattern. Long deemed as ’mumbo jumbo’ by financial economists, technical analysis (TA) has been puzzlingly popular among experienced traders over hundreds of years.
Financial economists generally have unbalanced views on technical analysis. The most prevailing view is that technical analysis is of no value. Traditional academic wisdom posits that publicly available information such as past prices or trading volumes, which serve as the basis of technical analysis, should have already been incorporated into current asset prices, with any attempt to predict future returns based on technical analysis having to "share a
8 Preface
pedestal with alchemy" (see Page 157 in Burton G. Malkiel (1973)). A less popular view is that technical analysis is an effective means of extracting useful fundamental information (Lo et al., 2000). Despite the lack of supporting theories for technical analysis, majority of empirical tests favor technical analysis. However, one may cast doubt on the strong empirical evidence on technical analysis because of publication bias or data snooping bias (Sullivan et al., 1999).
The financial industry, on the other hand, sees technical analysis as a crystal ball. Tech-nical analysis has been part of industrial practice over many years: it was first documented in Dutch markets in the 17th century, and in Japan in the early 18th century. Technical analysis is popular among practitioners; according to the survey conducted by Taylor and Allen (1992), 90% of experienced traders place some weight on it during costly trading activities. It is also widely discussed in media and commonly covered in education. Even someone transferring from academia to practice admitted that "overcoming the prejudice against technical analysis was the most important lesson he had to learn when moving from the ivory tower into the laboratory of real-life experience as a trader" (Sushil Wadhwani, an LSE academic, a central banker and later a fund manager, said in an interview by Financial Times)2.
To solve this conundrum, I argue that technical analysis captures investor sentiment. Chapter 4 is the first attempt to bridge the gap between academic finance and industry practice through the sentiment channel. The connection between investor sentiment and technical analysis is indicated in the previous literature. For instance, Menkhoff (1997) states that "technical analysis is a means of processing non-fundamental information". Technical analysis, especially positive feedback trading, is also a prominent example of biased belief in investor sentiment models, for instance, De Long et al. (1990b). To quote Zhou (2017),
"In technical analysis, there are many over-bought and over-sold indicators,
1.2 Motivations 9
which are precisely designed to capture the unsustainable levels of optimism and pessimism".
I propose and validate a market-wide sentiment measure based on forecasts of a broad spectrum of technical trading rules. I apply 2,127 technical trading rules on S&P 500 Index every day, assign values to the forecasts of those 2,127 technical trading rule (buy forecast=1, sell forecast=-1, neutral=0), and then calculate the average of 2,127 forecast as the daily TA sentiment indicator.
The theoretical motivation is that equilibrium price is a function of cross-generation sentiment and current sentiment level in De Long et al. (1990a) model. Accordingly, current sentiment could also be valued through current equilibrium price and historical equilibrium prices. Combining past prices and current price potentially allows more accurate investor sentiment inferences. Some of those who use technical trading rules to make investment decisions believe that the forecasts actually give signals about how optimistic the investors in the market are. A broad spectrum of technical trading rules provide more information on the investor sentiment level.
In Chapter 4, there are two ways to validate that this TA indicator captures sentiment. The first way is to show that this sentiment measure significantly correlates with other sentiment indicators. The second way is to test whether this TA indicator could predict the returns in the same pattern that a sentiment indicator does. I find that high TA sentiment indicator indicates the returns of more sentiment-prone stocks relative to sentiment-immune stocks are contemporaneously higher, subsequently remain higher due to the delayed arbitrage theory before they eventually reverse. High TA indicator also indicates higher future crash risk, and this predictability is stronger among sentiment-prone stocks than among sentiment-immune stocks. In this way, I connect technical analysis with investor sentiment to demonstrate that technical analysis has value in capturing investor sentiment.
10 Preface
1.2.3
Profitability of Exploring Sentiment-Driven Momentum
One of the contributions of this thesis is to look into the momentum effect of investor sen-timent on short-run returns. Most prior studies use monthly investor sensen-timent to predict monthly returns and therefore only capture the reversal effect. I find that not only investor sentiment can predict long-term return reversal but also can predict short-term return momen-tum. A high-frequency investor sentiment indicator enables the test the momentum effect of investor sentiment on short-run returns. I find that investor sentiment positively relates to the short-run return before the return reverses, and this return momentum is due to the lack of coordination among arbitrageurs. Both Chapter 4 and Chapter 5 rely on the hypothesis of the momentum effect of investor sentiment from the delayed arbitrage model.
Mispricing arises from the irrational bias and limit on arbitrage. Abreu and Brunnermeier (2003) propose the delayed arbitrage model to show how mispricing persists due to the lack of coordination among arbitrageurs. In their model setting, sentiment-driven overpricing emerges, and arbitrageurs become sequentially aware of it but do not know their sequence or their peers’ opinions. For a bubble to burst, a critical mass of rational arbitrageurs need to agree on coordinated arbitrage actions. In actuality, rational arbitrageurs face performance evaluations in short horizon and care about the resale price and liquidation risk. Hence, instead of arbitraging right after realizing there has been mispricing, they become reluctant to arbitrage at an early stage and try to forecast their peers’ action. Some rational arbitrageurs may even jump on the bandwagon, ride the bubble, and try to "beat the gun" before it collapses. With them switching sides from the rational to the irrational group, the mispricing could be enlarged by an increase in sentiment-induced trading. The lack of coordination among arbitrageurs leads to delayed arbitrage actions that make the bubble persist. If the investor sentiment become more extreme or the arbitrageurs decide to ride the bubble, the bubble may even grow bigger. Eventually, the bubble becomes prominent enough to trigger coordinated arbitrage actions and the return reverses. Hence, high investor sentiment has a
1.2 Motivations 11
momentum effect on the return before the reversal effect starts to take place.
While Chapter 4 focuses on explaining the predictability and profitability of technical analysis through an investor sentiment channel, Chapter 5 focuses on two things: to better predict future return and to profit from the predictive power of investor sentiment. I find that not only investor sentiment predicts long-term return reversal but it also predicts short-term return momentum. However, the predictive power of a factor does not necessarily guarantee its strong profitability. Therefore, I implement the investor sentiment in trading and test the profitability of investor sentiment.
Due to existing literature generally seeing investor sentiment as a contrarian indicator of future return, the trading strategies based on sentiment in existing literature are mostly contrarian trading strategies that aim to profit from the return reversal predicted by investor sentiment. The predictive power of a factor does not necessarily guarantee its strong prof-itability. After demonstrating the predictability of investor sentiment on the short-run return, I test the profitability of the momentum effect of investor sentiment caused by delayed arbitrage. I design trading strategies that aim at benefiting from the momentum effect of investor sentiment.
Every trading strategy has to answer two key questions: when to buy/sell and what to buy/sell. Chapter 4 and Chapter 5 answer the first question with a similar method using two different sentiment indicators, a newly-proposed TA sentiment indicator and VIX indicator. However, the two chapters differ in their answer to the second question. Unlike Chapter 4, Chapter 5 chooses to shift asset allocation among stocks to generate higher profitability and avoid short-selling constraints and high short-selling costs.
This shifting asset allocation strategy is based on delayed arbitrage theory and the asymmetric effect of investor sentiment in the cross-section. My trading strategies involve holding sentiment-prone stocks when VIX is low and sentiment-immune stocks when VIX
12 Preface
is high. I also find that following low sentiment periods the sentiment-immune stocks outperform the sentiment-prone stocks. I test the robustness of the profitability of my trading strategy and also demonstrate that this profitability is not subsumed by the well-known risk factors and can survive transaction costs.
In summary, this thesis contributes to existing literature in three aspects. Initially, the first essay provides the first theoretical model illustrating the asymmetric effect of investor sentiment on cross-sectional stock returns. Second, the second essay connects technical analysis with investor sentiment and provide evidence on the value of technical analysis as a sentiment indicator from a behavioural finance perspective. Third, the last two essays emphasize the momentum effect of investor sentiment and the profit opportunity provided by sentiment-induced return momentum, which has not been thoroughly tested in previous research. The profitability of my sentiment-based trading strategies demonstrates a practical significance for studying investor sentiment.
Chapter 2
Literature Review
This section summarizes the findings and gaps in the previous literature. In short, strong empirical evidence of the predictability of investor sentiment has been found in the cross-sectional stock market. Almost all theoretical models looks into an economy with only one risky asset. Such a gap in the literature motivates me to build a two-risky-asset model to demonstrate the asymmetric effect of investor sentiment rigorously. Empirical studies also focus on the reversal effect of investor sentiment on future returns, and therefore most papers test the contrarian trading strategies based on investor sentiment.
This session also sums up the research related to the delayed arbitrage model proposed by Abreu and Brunnermeier (2003) to draw attention to the momentum effect of investor sentiment. The delayed arbitrage theory inspires me to test the momentum effect of investor sentiment and to investigate the profitability of exploring the momentum caused by investor sentiment and delayed arbitrage.
Finally, I review the literature on the connections between investor sentiment and technical analysis. I briefly sort out the opinions of the academia on the effectiveness of technical analysis and use existing research to support my attempt to explain technical analysis from a
14 Literature Review
sentiment channel.
2.1
Investor Sentiment Measures
The literature on investor sentiment measures answers two key questions: 1) how to measure investor sentiment; 2) how to tell it is a good proxy or not. Generally speaking, the choice the sentiment index should be based on the economic logic and theoretical rationale. Apart from the theoretical reasoning, there are practically three ways to validate the performance of sentiment index. First is to see whether the high and low sentiment period matches with anecdotal bubbles and crashes history. Second is to calculate and test the correlation of any new sentiment index with sentiment-related macroeconomic variables and other widely-acknowledged sentiment indicators. More importantly, those papers use the remarkable performance of a sentiment index in explaining or predicting the equity premium as validity evidence of the index.
Investor sentiment measures fall into three categories, namely the survey-based sentiment, textual analysis based sentiment, and market-based sentiment.
2.1.1
Survey-Based Sentiment Indicators
The survey-based measures include University of Michigan Consumer Sentiment Index, Conference Board Consumer Confidence Index, Investors’ Intelligence Index, the institutional (individual) Bull-Bear spread surveyed by the American Association of Individual Investor, etc.
Different types of interviewees of the survey make the sentiment indicator measure the sentiment of different groups of people. University of Michigan Consumer Sentiment Index is a retail-based sentiment measure (Fisher and Statman, 2003). Conference Board
2.1 Investor Sentiment Measures 15
Consumer Confidence Index (CCI) is a more widely employed survey-based sentiment indicator. Investor Intelligence Index is a measure of institutional sentiment, as it represents the bullish/bearish expectation of over 120 market newsletters. This sentiment proxy could either be the percentage difference or the ratio of bullish and bearish newsletters (e.g., Brown and Cliff, 2005; Kurov, 2010; Lee et al., 2002).
The complex index could also be constructed from the several survey-based sentiment indicators. Ho and Hung (2009) use all three survey indexes and create an index containing the common component of those three indexes to examine the role of investor sentiment in conditional asset-pricing models.
2.1.2
Textual-Analysis Sentiment Indicators
The textual analysis sentiment measures are not the mainstream, yet it is attracting attention. Different types of text content one analyses measure the sentiments of different agent groups. Most textual analysis on sentiment digs into the corporate filings and disclosures to gauge corporation-expressed sentiment. For example, Jiang et al. (2017) construct managers’ sentiment from the textual analysis of financial reports, earning disclosure conference, and they show that the overall market managers’ sentiment performs very well as a contrarian predictor of future aggregate stock market returns. Tetlock (2007), Garcia (2013) and Engelberg et al. (2012), among many others, point out the importance of media-expressed sentiment. Those papers analyses the tones in major newspapers the Wall Street Journal, the New York Times, and the Dow Jones News Service.
This thesis is more interested in the Internet-based sentiment from textual analysis, which measures the mood of investors all over the market. Da et al. (2014) create a market-wide sentiment measure called Financial and Economic Attitudes Revealed by Search (FEARS) index by aggregating the US household Google Trend search volume of negative words such
16 Literature Review
as "bankruptcy", "unemployment", "recession". Da et al. (2014) find that their FEARS index is a contrarian measure of investor sentiment; high FEARS index indicates low investor sentiment and vice versa. Sun et al. (2016) provide an intraday sentiment measure from textual analysis and find their half-hour lagged sentiment measure strongly predicts the hourly return of S&P 500 index.
2.1.3
Market-Based Sentiment Indicators
The market-based sentiment indicators include retail investor trades; mutual fund flows; trading volume; premium on dividend-paying stocks; closed-end fund discounts; option implied volatility; first-day returns on initial public offerings; number of initial public offerings; new equity issues; insider trading; complex index constructed from several market-based indexes.1
Retail Investor Trades. Retail investors’ intention to buy or sell proxies investor sen-timent. (Barber et al., 2008; Kumar and Lee, 2006) find that retail investors tend to buy or sell stocks in concert, and their behavior pattern is consistent with the systematic sentiment. Ritter and Welch (2002) conjecture that the bullish investor sentiment among retail investors explains the IPOs’ high first day return and low future return. Greenwood and Nagel (2009) find that inexperienced retail investors tend to hold more stocks during the peak of the Internet Bubble than the sophisticated institutional investors. In addition, retail investors are more likely to be sentiment-prone than sophisticated investors. A series of papers support this argument by showing that retail investors prefer sentiment-prone stocks more than sophisticated investors. Qiu and Welch (2004) see the retail investors demand as a proxy for sentiment-prone level and build cross-sectional portfolios based on the characteristics representing retail investors’ demand. Stocks held disproportionately by retail investors (such as young and small stocks) are more sentiment-prone than stocks held by institutional
2.1 Investor Sentiment Measures 17
investors. In addition, they argue that the reason closed-end fund discount captures investor sentiment is due to the fact that closed-end funds are predominately held by retail investors.
Mutual fund flows. Neal and Wheatley (1998) use the closed-end fund discount, the ratio of odd-lot sales to purchases, and net mutual fund redemptions to measure the investor sentiment level, and they find mutual fund redemption predictive for the small premium. Similar to the net mutual fund redemption, Liao et al. (2011) employ net mutual fund purchase to proxy for sentiment. Brown and Cliff (2004) argue that net purchases by mutual funds positively indicate the optimistic magnitude in the stock market. Investors tend to buy when they are bullish about the market and prefer to sell when lack of confidence or in a bad mood. Ben-Rephael et al. (2012) use aggregate net exchanges of equity funds, the monthly shift between bond funds and equity funds, to gauge investor sentiment. They find it weakly correlates with sentiment the measures used in Lemmon and Portniaguina (2006), but it works well in explaining contemporaneous excess return especially for small and growth stocks. Frazzini and Lamont (2008) use mutual fund flow to measure the sentiment of individual stocks.
Trading Volume. Liquidity measures such as trading volume, market turnover and bid-ask spread can predict future return on the firm- and market-level (Baker and Stein, 2004). When irrational investors overreact to private signals, both negative and positive sentiment shock tend to boost the liquidity in a market without short-selling constraints. However, irrational investors are usually kept out of the market in face of the short-selling constraints when sentiment is negative. Baker and Stein (2004) build a mathematical model to demonstrate that an increases in trading volume implies higher participation of bullish irrational investors in the market, and hence high trading volume indicates bullish investor sentiment. Another line of studies demonstrate that innovations in trading volume proxy for the divergence of opinion among investors (Chen et al., 2001; Hong and Stein, 1999), and hence Scheinkman and Xiong (2003) and Baker and Wurgler (2007) point out that the
18 Literature Review
aggregate trading volume level measures the bullishness of investors when short-selling is difficult. However, with the development of high-frequency trading algorithm in the stock market, turnover is no longer suitable for capturing investor sentiment. Therefore, Jeffrey Wurgler leave the turnover out of the construction of the latest version of Baker-Wurgler Sentiment.
Option Implied Volatility. VIX is, by definition, a measure of market expectation of stock return volatility implied from the supply and demand of S&P index options over the next 30 calendar days. The Chicago Board Options Exchange’s implied volatility index (VIX) is first introduced by Whaley (2000) as a premier barometer of investor sentiment by scholars and practitioners (Bekaert and Hoerova, 2014; Da et al., 2014; Giot, 2005). The Wall Street Journal and many other major media assigned VIX the nickname "the fear gauge" or "the sentiment index". Fleming et al. (1995) show that though VIX is a good predictor for future volatility, it contains misperception. Low (2004) argues that VIX is a collective best guess of all option traders on the S&P index options and therefore regardless of its forecast accuracy VIX encompasses the bias and exuberance of a sample of sophisticated, well-informed professional market participants.
Closed-End Fund Discount. A strand of research presents a very intriguing and heated debate on whether closed-end fund discount (CEFD) associates with investor sentiment (Chen et al., 1993; Chen and Miller, 1993; Chopra et al., 1993a,b). Lee et al. (1991) infer that CEFD proxy for investor sentiment and the changes in CEFD highly correlates with returns of stock stocks. Elton et al. (1998) consider CEFD as an indicator of investor mood of individual investors because closed-end funds are disproportionately held by retail investors. A more prominent discount value means a more bearish investor sentiment. Neal and Wheatley (1998) find the net redemption captures investor sentiment in CEFD.
Complex Index.Baker and Wurgler (2006) use principal component analysis to extract the common component of six measures of investor sentiment, which are the closed-end
2.1 Investor Sentiment Measures 19
fund discount, the number and the first-day returns of IPOs, NYSE turnover, the equity share in total new issues, and the dividend premium. They provide a detailed illustration on the relation of each measure with sentiment. They also compare the fluctuation of the BW sentiment index with anecdotal history from 1961 to 2002 and find it consistent with reality. Huang et al. (2015) point out a potential problem of using principal component analysis: the six indexes all contain approximation error and those errors contribute partially to their variations, thus the first principal component of the six indexes may also contain the common component of approximation errors which has no explanatory power on the future return. They use partial least square method (PLS) to gather the common component of those six proxies that most aligned with the aggregate market return. They consider PLS index a better proxy, as it has better performance in predicting the future aggregate market return and it highly correlates with macroeconomic variables.
2.1.4
Comparison of the Three Categories of Sentiment Measures
The survey-based sentiment indicators are the most direct measures for sentiment and quite often serve as the benchmark indicator in the validation of other sentiment measures. The correlations with the direct survey-based sentiment indicators have been widely used to test the validity of other market-based or textual-based sentiment measures. For instance, Lemmon and Portniaguina (2006) argue that consumer confidence measures are good proxies for sentiment as they are highly correlated to the Bull-Bear spread. Qiu and Welch (2004) also argue that correlations of a new measure with direct survey indicators provide a more convincing validation because direct survey indicators directly show opinions of investors.
Previous literature points out two disadvantages of survey-based indicators. First, those measures are usually in low frequency. Second, Singer et al. (2002) cast doubts on the quality of survey-based indicators due to the lack of incentives for interviewees to truthfully and
20 Literature Review
carefully answer the survey questions, especially when the questions are sensitive.
The advantage of textual sentiment indicator is that it could be measured in different frequency and have easier access than the survey-based sentiment indicator. However, the quality of textual analysis based sentiment indicator, to a large extent, relies on finding the right and comprehensive negative and positive words dictionary.
The advantage of market-based sentiment indicators is their availability and high-frequency availability relative to survey-based sentiment indicator. The disadvantage is that the market-based sentiment indicators are the equilibrium of many economic forces other than investor sentiment. Also, it faces a problem pointed out by Qiu and Welch (2004) succinctly: "How does one test a theory that is about input→outputs with an output measure?". This is why current literature mostly verify a market-based sentiment indicator by testing its correla-tion with survey-based sentiment indicator. To better address this issue, future research should contribute more on designing a better framework or finding a better test-field for the validation of market-based sentiment indicators.
2.2
Investor Sentiment and Stock Returns
2.2.1
Effect on Aggregate Market and Cross-Sectional Returns
Theoretical Models
Models like Grossman and Stiglitz (1980), Black (1986), Shleifer and Vishny (1997), Daniel et al. (1998), among others, are designed to illustrate the effect of sentiment on asset returns from the aspect of limits on arbitrage. Another strand of theoretical works illustrates the effect of investor sentiment on asset price with belief-based models. For instance, Barberis et al. (1998) propose a model which measures investors’ attention on the strength and the
2.2 Investor Sentiment and Stock Returns 21
statistical weight of information; they prove investors’ overreaction or underreaction to information cause cross-section return premium. They argue that investors wrongly allocate their attention on the strength and the statistical weight of information, and therefore their biased perceptions will lead to cross-section return disparity between stocks. Barberis et al. (1998) incorporate the conservatism and representativeness bias in this belief-based model. Daniel et al. (2001) model the effect of overconfidence in private information on asset prices.
Instead of capturing only a few aspects of biased belief, De Long et al. (1990a) propose a noise trader model to incorporate all kinds of biased belief into one parameter and theoreti-cally relate prices to sentiment level and returns to sentiment changes. The selling point of DSSW model is that the uncertainty of stochastic investor sentiment create noise trader risk can prevent rational investors to eliminate the mispricing with limits on arbitrage entirely, and investor sentiment can drive a wedge between the price and the fundamental value. This model also shows that current sentiment change positively varies with current return and the lagged sentiment negatively predicts returns.
Aggregate market and Cross-Sectional Returns
Almost all theories of investor sentiment including De Long et al. (1990a) apply most appropriately to market portfolios since there is only one risky asset in the models (Huang et al., 2015), yet empirical literatures suggest that the role of sentiment is at best controversial at the aggregate market level (Baker et al., 2012; Brown and Cliff, 2004; Elton et al., 1998; Solt and Statman, 1988). Instead, there is ample evidence that market sentiment helps explain the asset returns in the cross-section (Baker and Wurgler, 2007, ,among others.).
Why is the effect of investor sentiment is stronger in the cross-section than in the aggregate market? The answer is that stocks may have asymmetric sensitivities to investor sentiment (Baker and Wurgler, 2006; Zhou, 2017). Baker and Wurgler (2007) explain with a see-saw
22 Literature Review
graph to show that the predictive effect of investor sentiment weakens if the sentiment-immune stocks possibly have opposite response to a sentiment shock compare with the sentiment-prone stocks due to "flight to quality".
Sentiment often acts at the level of categories (Barberis and Shleifer, 2003; Barberis et al., 2005). Cohen and Lou (2012) find when facing up with the same information, complicated firms are more difficult to categorise, and therefore they are less likely to be affected by investor sentiment which acts at the categorical level. Baker and Wurgler (2006) indicate that sentiment-prone stocks tend to be small, young, volatile, unprofitable, non-dividend-paying, distressed or with extreme growth potential and contains relatively high percentage of intangible assets, because this kind of stocks is more difficult to evaluate and more likely to be misperceived by sentiment-biased investors. Berger and Turtle (2012) look into whether stocks with those characteristics are sentiment prone. They use each characteristic to construct ten decile portfolios and calculate the average sentiment sensitivity measured by sentiment beta in the asset pricing regression. They conclude that investor sentiment sensitivities are significantly correlated with those categorisation measures in the cross-section, and greater extent of opacity means higher sentiment sensitivities. Therefore, it is practical to divide the stocks into categories based on its sensitivity to investor sentiment and check how they react differently to investor sentiment.
Long-Run and Short-Run Effect
Shleifer and Vishny (1997), who illustrate that the agency problem, arbitrage cost, long liquidation risk and funding constraints of rational investors will prevent them from taking long-term positions against mispricing. If investors are not sophisticated enough to under-stand a money manager’s strategies, they will use short-term returns as a way of judging his competence and withdraw funds after a poor performance, which threatens arbitrageurs to take a short-term view. The holding cost of counteracting the mispricing is high for the
long-2.2 Investor Sentiment and Stock Returns 23
run holding period, especially for short selling. Arbitragers may even be forced to liquidate their positions at a loss when running out of capital. However, the mutually-exclusive effects of long- and short-term sentiment on predicting future return have so far not been emphasised in the literature. Most researchers focus on the short-term relation between sentiment and return, while few look into how long-term and short-term investor sentiments affect either long-term or short-term return. For example, Brown and Cliff (2005) prove that short-term sentiment will have a stronger predictive power on long-term future return than on short-term future return. It is of essential importance to look at the effect of investor sentiment in both the long and the short run.
2.2.2
Momentum and Reversal Effects of Sentiment on Returns
In short, previous empirical studies on the link between investor sentiment and stock re-turns generally show two findings: first, investor sentiment is negatively related to future stock returns; second, the predictive power of investor sentiment on stock returns is more pronounced in the cross-section. The contrarian predictive power of investor sentiment on future returns is usually tested with low-frequency data. Most of the commonly used investor sentiment measures, such as mutual fund flow, consumer confidence index, closed-end fund discount, Baker Wurgler index, are in monthly frequency (Baker and Wurgler, 2007; Brown and Cliff, 2005; Neal and Wheatley, 1998, among many others.). Those papers look into the predictability of those monthly sentiment level on monthly, quarterly or longer-term future return. They argue that bullish investor sentiment pushes current price high and the mispricing will be corrected in the future which means lower future return, and vice versa.
It has come to my attention that the negative relationship between investor sentiment and future returns may not hold in the short run with high-frequency data. A strand of studies demonstrates the prominent profitability of trading strategies that capture the return
24 Literature Review
momentum induced by the news-based sentiment (Huynh and Smith, 2017; Sun et al., 2016; Uhl, 2017). Even without using intraday data, Lee et al. (2002) show the positive short-term relationship between investor sentiment and stock return with weekly data. Recently, more empirical works show that investor sentiment also predicts short-term momentum (see, e.g., Chou et al., 2016; Han and Li, 2017).
Mispricing arises due to uninformed demand and limit of arbitrage. Investor sentiment indicates how far the price is away from the fundamental value. Assume the sentiment-induced momentum comes through the uninformed demand channel. Liang (2016) argue that the momentum effect of sentiment shock may come from the underreaction of sentiment-driven investors, i.e. the persistent high return after a positive shock is due to the delayed reaction of sentiment-driven investors. However, the under reaction proposition does not explain the future return reversal. In another word, bubbles exist in a market where some investors are biased and arbitrage trading is constrained.
Consider the momentum comes from the limit of arbitrage channel. Limit of arbitrage comes from various sources, namely fundamental risk, noise trader risk, implementation costs, short-selling constraints and synchronisation risk. One source of limit on arbitrage, synchronisation risk, could serve well in explaining the momentum effect of investor senti-ment. Abreu and Brunnermeier (2003) argue that arbitrageurs may fail to coordinate their betting against the mispricing due to the dispersion of strategies to find the market turning points. Rational arbitrageurs may even choose to capture the momentum gains and ride the bubble, and they correct mispricing until a sufficient mass of arbitrageurs takes synchronised actions.
A series of empirical works support the argument that rational arbitrageurs delay arbitrage. McQueen and Thorley (1994) assume the probability to predict the end of a sentiment episode is low at the beginning and this probability increases when coming to the end of a sentiment episode. Multiple anecdotal studies have contended that institutional investors managerially
2.2 Investor Sentiment and Stock Returns 25
ride the bubble and exacerbate mispricing (Brunnermeier and Nagel, 2004; DeVault et al., 2014; Griffin et al., 2011; Xiong and Yu, 2011). Rather than selling to bring the price back to fundamental value, some institutional investors choose to buy, knowing that positive feedback will attract more irrational traders, leading to a higher price where they can exit a profit. The market timing behaviour of institutional investors makes the mispricing sustaining for the more extended consecutive period before correction. This mispricing component accumulates till the point that it becomes attractive enough for sophisticated investors to counteract the mispricing (Berger and Turtle, 2015).
Previous studies on the behaviour of individual investors versus institutional investors justify this thesis using delayed arbitrage theory to explain the profitability of technical analysis. Empirical findings show sophisticated investors ride the bubbles and benefit from chasing the trend, while individual investors are the contrarian traders. In line with Abreu and Brunnermeier (2003) model, Griffin et al. (2011) find that during tech bubble period institutional investors were the major buyers of technology stocks and they were also the dominant selling force when bubble crashed. Brunnermeier and Nagel (2004) report hedge funds ride the technology bubble by heavily investing in technology stocks. In the same vein, Temin and Voth (2004) present through a case study that one sophisticated investor knowingly invested in the South Sea bubble and earned profits from riding the bubble. Since no short-selling constraints or agency problems exist for this sophisticated investor, Temin and Voth (2004) argue that it is synchronisation problem among rational investors that lead to the bubble and the subsequent crash.
26 Literature Review
2.3
Technical Analysis and Investor Sentiment
2.3.1
The Efficiency of Technical Analysis
Earlier empirical works about the efficiency of technical analysis are inconclusive. Generally speaking, evidence of the profitability of technical analysis is much stronger in foreign exchange markets (Allen and Taylor, 1990; Lui and Mole, 1998; Narayan et al., 2015; Neely and Weller, 2003; Osler, 2003; Qi and Wu, 2006; Taylor and Allen, 1992). With regard to other asset classes, Goh et al. (2013) find that technical indicators have salient forecasting power on bond risk premium. Lukac et al. (1988) find supporting evidence in the commodity futures market. Glabadanidis (2014) shows the predominate profitability of applying the Moving Average trading rule on REIT indexes.
Efficacy of technical analysis in the stock market is much weaker relative to futures markets or foreign exchange markets during the 1960s and 1970s. One of the earliest work, Cowles (1933), shows that Hamilton’s forecasts based on Dow Theory over 1904 to 1929 only have a success rate of 55%. Fama and Blume (1966) find the Filter Rules was not profitable over 1956-1962. Allen and Taylor (1990) see little profitability of generic algorithms in the stock market. Sullivan et al. (1999) find profitability of technical analysis vanishes after adjusting for data-snooping bias2. Their finding indicates that profits of technical analysis are not due to fundamental changes but rather driven by sentiment.
There are also various studies supporting the effectiveness of technical trading rules in stock markets. Take some recent papers for instance, Brock et al. (1992) present evidence that uptrend signals of technical analysis indicators made by DJIA consistently predict higher subsequent returns than downtrend signals. Nagel (2012) strengthens the liquidity
2Data-snooping bias arises when a set of data is over-reused for the purposes of model selection or making
inference. When data is used repeatedly, there is always a chance that the satisfactory results are obtained due to pure-luck rather than to any underlying economic rationale. In a case of data-snooping bias, the significant statistical tests results are overvalued and does not show merit.
2.3 Technical Analysis and Investor Sentiment 27
explanation with proof that both the short-term reversal strategies and trend factors do well during recessions because of evaporating liquidity. Ülkü and Prodan (2013) show that return persistence is a principal determinant of trend-following rules’ profitability, and return volatility will also contribute to the profitability. Antoniou et al. (2013) test specific technical rules in isolation. Consistent with the informational diffusion model, Han et al. (2016) construct a pricing factor from trend-following strategy and find it performs better when information is more uncertain.
Park and Irwin (2007) point out the difficulty of proving the efficiency of technical analysis lies in statistical methodology. The riskiness of technical trading rules should be taken into consideration; the trading rule profits should be adjusted for data snooping biases and be tested for its statistical significance. Data-snooping bias occurs when a given set of data is used more than once for the purpose of inference or model selection. Sullivan et al. (1999) test 7846 trading rules that belongs to five commonly used classes, namely the Filter Rules, Moving Averages, Support and Resistance, Channel Breakouts and On-balance Volume Averages. They find that during the 1987 to 1996 technical trading rules are of little value after applying Bootstrap Reality Check methodology to account for the data-snooping bias. There is also a possibility that certain technical analysis rules may perform well due to pure luck. The universe of technical trading rules should be set up to show the profitability of technical trading strategies is artificial by data-mining and picking out the trading strategies that work well.
2.3.2
Theoretical Explanations for the Use of Technical Analysis
Typical theoretical explanations for the use of technical analysis include the following three groups. The first group argue technical analysis users are not fully rational. The second group argues that technical analysis is valuable in processing information of fundamental
28 Literature Review
influences on price. The third group proposes that technical analysis exploit information of the non-fundamental impacts on price.
Irrational Action. Some argue that using technical analysis is an unreasonable action. Technical analysis challenges the Efficiency Markets Hypothesis, which indicates technical analysis is of no value when information on past prices has been embedded into the current price (Fama and Blume, 1966; Jensen and Benington, 1970). However, the consistent popularity of technical analysis does not fit EMH. The Efficient Market Hypothesis suggests that irrational investors will be forced out of the market after making losses to rational investors. Some hold the opinion that technical analysis users have suboptimal behaviour. For instance, Ebert and Hilpert (2016) point out that even when technical analysis is not profitable it is still attractive due to investors’ preference for positive skewness return, and technical analysis induces lottery-like returns that is more right-skewed. De Long et al. (1990b) propose that technical analysis users may underestimate the asset risk. Some claim that financial intermediaries promote technical analysis as its forecasts generate fee and commission.
However, many economists do not agree with the irrational behavioural explanation and insist that technical analysis is of value in making investment decisions. Technical analysis is still appealing and popular among financial practitioners, including a large part of sophisticated investors who are from the buy-side and are not likely to have suboptimal behaviour or underestimate the risk. For example, Lo and Hasanhodzic (2010) and Schwager (2012) find in their interviews that many top traders and fund managers believe in and employ technical analysis to make decisions accordingly. Their interviewees see technical analysis at least as critical as fundamental analysis. Menkhoff (2010) finds technical analysis is the most important form of analysis among fund managers at a forecasting horizon of weeks, and it is more popular in smaller asset management firms.
2.3 Technical Analysis and Investor Sentiment 29
for individual investors relative to institutional investors. Smith et al. (2016) demonstrate that hedge fund managers who use technical analysis have superior performance, lower risk and better market-timing ability than the non-users during high sentiment periods, and those advantages disappear and even reverse in low sentiment periods. However, individual technical analysis users have poor performance. Neely (1997) points out that it is much less useful for individual investors in foreign exchange market due to higher transaction cost, the opportunity cost of time and the risk entailed in the trading strategy. Hoffmann and Shefrin (2014) show that individual technical analysis users are disproportionately less capable of earning higher returns. These findings are all consistent with the predictions in Abreu and Brunnermeier (2003), that when unsophisticated investors sentiment is predictable to some extent, rational speculators profit from riding the bubble supported by inexperienced investors.
Fundamental Explanation.The second group sees technical analysis as an approach to obtain information of fundamental influences on price. The notion that the process towards equilibrium prices could be time-consuming throws a lifeline to the efficacy of technical analysis. In an economy where investors receive information at different times, past prices are useful in assessing whether the information has been incorporated into current price (Brown and Jennings, 1989; Hellwig, 1982; Treynor and Ferguson, 1985). Even if investors receive information at the same time, when investors are heterogeneously informed or process information at different speeds, past price are also valuable to help investors to make more price inferences about the signals contained in the information (Brown and Jennings, 1989; Grundy and McNichols, 1989).
Technical analysis is valuable in analysing the information that reveals in a sequence of security prices rather than a single price. Treynor and Ferguson (1985) argue that the value of technical analysis is to evaluate whether the non-public information has been priced into current price, so it is the non-public information that creates profit opportunity rather than