DISCUSSION PAPER SERIES
Forschungsinstitut zur Zukunft der Arbeit Institute for the Study of Labor
What Do We Work For?
An Anatomy of Pre- and Post-Tax Earnings Growth
IZA DP No. 5298November 2010 Anders Frederiksen Timothy Halliday Alexander K. Koch
What Do We Work For? An Anatomy of
Pre- and Post-Tax Earnings Growth
Anders Frederiksen
Aarhus School of Business, Aarhus University, CCP and IZATimothy Halliday
University of Hawaii at Mānoaand IZA
Alexander K. Koch
Aarhus University, CCPand IZA
Discussion Paper No. 5298
November 2010
IZA P.O. Box 7240 53072 Bonn Germany Phone: +49-228-3894-0 Fax: +49-228-3894-180 E-mail: iza@iza.orgAny opinions expressed here are those of the author(s) and not those of IZA. Research published in this series may include views on policy, but the institute itself takes no institutional policy positions. The Institute for the Study of Labor (IZA) in Bonn is a local and virtual international research center and a place of communication between science, politics and business. IZA is an independent nonprofit organization supported by Deutsche Post Foundation. The center is associated with the University of Bonn and offers a stimulating research environment through its international network, workshops and conferences, data service, project support, research visits and doctoral program. IZA engages in (i) original and internationally competitive research in all fields of labor economics, (ii) development of policy concepts, and (iii) dissemination of research results and concepts to the interested public. IZA Discussion Papers often represent preliminary work and are circulated to encourage discussion. Citation of such a paper should account for its provisional character. A revised version may be available directly from the author.
IZA Discussion Paper No. 5298 November 2010
ABSTRACT
What Do We Work For?
An Anatomy of Pre- and Post-Tax Earnings Growth
*Promotions and cross-firm mobility provide substantial gains in earnings – a well established finding based on gross income data. Yet, what matters for incentives is how much an individual can consume or save after taxation. We show that net and gross income growth patterns may differ substantially when a progressive tax system allows for deduction opportunities. Exploiting unique matched employer-employee data with information on tax payments and employee mobility, we find that gross income gains from promotions and cross-firm mobility do not translate into significantly higher net income growth, because employees adjust their tax-shielded consumption and savings (in particular, deductible private pension contributions and mortgage-financed housing) to maintain constant net income growth.
JEL Classification: M51, J6, C33, H31
Keywords: earnings growth, promotions, mobility, taxable income,
dynamic panel data models, matched employer-employee data
Corresponding author: Alexander K. Koch
School of Economics and Management Aarhus University Building 1322 8000 Aarhus C Denmark E-mail: akoch@econ.au.dk
1
Introduction
Earnings growth and employee mobility are central themes in labor economics. Pay raises triggered by promotions are a key source of incentives for employees in a range of models in personnel economics (e.g., Lazear and Rosen 1981; see the survey by Gibbons and Waldman 1999a). And, according to models of job search, earnings gains for job switchers are to a large extent the fruits of employees’ efforts to find more productive employment matches (e.g., Burdett and Mortensen 1998; Jovanovic 1979). These models are complemented by a large body of empirical research that analyzes earnings growth. For instance, Topel and Ward’s (1992) influential study attributes more than one-third of the wage growth of white men in the U.S. during their first decade in the labor market to pay increases experienced when moving to new employers.1 Further, Baker, Gibbs and Holmstr¨om (1994a, 1994b) and
other studies employing data sets from particular firms or occupations find that promotions are important drivers of long-run compensation growth.2 All these empirical studies consider gross earnings. However, from the employee’s perspective, what matters most is the amount that he or she can actually spend or save. In fact, while employees see the paycheck in their bank account after tax and social security contributions have been deducted, they may not even know what their exact gross salary is.3
How much does the distinction between gross and net earnings matter? One might expect that a progressive tax schedule simply attenuates after-tax income growth rates relative to pre-tax income growth rates. As gross income is taxed at an increasing rate, a larger and larger share is eaten up by taxes, therefore dampening the growth of after-tax income. However, matters are not that simple. The trivial correspondence between the two growth rates does not hold because income tax systems offer deduction opportunities that allow employees to shield some of the fruits of higher gross income growth from contemporaneous taxation. These deductions can be quite substantial, in particular in countries that allow deductions for voluntary pension contributions or mortgage interest payments.
In this paper, we provide an empirical assessment of how progressive taxation and deduc-tion opportunities affect the reladeduc-tionship between employee mobility and earnings growth. Exploiting a unique data set that merges Danish tax records with a linked employer-employee panel, we show that very different qualitative results obtain if one uses net rather than gross
1Other contributions on the importance of job mobility for wage growth are, e.g., Antel (1986, 1991),
Altonji and Shakotko (1987), Altonji and Williams (2005), Bartel and Borjas (1981), Buchinskyet al. (2010), Dustmann and Meghir (2005), Keith and McWilliams (1999), Mincer (1986), and Topel (1991).
2For example, Belzil and Bognanno (2008), Booth, Francesconi and Frank (2003), Chiappori, Salanie and
Valentin (1999), Dohmenet al. (2004), Gibbs and Hendricks (2004), Lazear (1992), Medoff and Abraham (1980, 1981), Seltzer and Merrett (2000) and Trebleet al. (2001).
3An indication of this is that in surveys, people have been found to report biased estimates of the income
income data. While both promotions and cross-firm mobility have a sizeable impact on pre-tax labor income growth, these effects largely disappear once one considers income growth after taxes. This finding is a consequence of the tax system, which encourages individuals to contribute part of their gross income to private pension funds and encourages financial decisions that increase tax deductible interest.
Detailed information on deductions allows us to establish that tax-shielded consumption and savings opportunities are important elements in individuals’ planning. When employees exert effort to earn a promotion or to find a better employment match, the fruits of this labor are enjoyed via tax-shielded consumption and savings for retirement (such as enjoying a nicer, more expensive home financed through a mortgage; using credit to drive a better car; or increasing pension contributions to look forward to higher income in old age). This allows individuals to circumvent the progressivity of the tax system. Net income growth data do not reflect these opportunities, however. Our findings thus suggest that, in the absence of detailed knowledge of tax deductions, gross earnings growth provides a better sense of the incentives for labor market effort than net income growth.
We estimate a dynamic panel data model that treats income as an ARMA process with a unit root, an empirical strategy consistent with previous work on income dynamics (e.g., Abowd and Card 1989; Meghir and Pistaferri 2004; Topel and Ward 1992). Our data come from two different registers collected by Statistics Denmark: the tax register and the employer-employee panel known asIDA.4 The tax register contains all relevant information
on income, deductions, and taxes paid by the entire Danish population. This provides us with various income measures needed to calculate taxes, which in turn reveal tax-shielded consumption and savings opportunities and allow us to construct a measure of net income. Two important features of these data are that they match individuals to companies on a yearly basis and that they provide a measure of hierarchical placement. The two data sets can be merged because we have unique person and establishment identifiers, which allows us to track employees both within and across companies and, thus, to estimate the effects of mobility on relevant income measures.
Our findings are of broad interest because some structural features of Denmark’s labor market and taxation system resemble those in the U.K. and the U.S.. For instance, Denmark is more similar to the U.K. and the U.S. in terms of labor market flexibility and rates of cross-firm mobility than are countries such as France, Germany, Italy, Spain, and the Netherlands (see, e.g., Jolivet et al. 2006). In addition, the costs of laying off workers are low on account of liberal labor market policies (e.g., absence of severance pay legislation and lack of experience rating in the unemployment insurance system) and there is weak
4For other studies on employee mobility using IDA data, see, e.g., Aagard et al. (2009), Bagger et al.
(2009), Frederiksen, Honor´e and Hu (2007), Frederiksen (2008), and our companion paper, Frederiksen, Halliday and Koch (2010). For studies applying the tax register data see, e.g., Browning and Leth-Petersen (2003). We are aware of a single study that combines the two data sources: Chettyet al. (2010).
job security (albeit with generous unemployment benefits). Like most income tax systems, Denmark has a progressive tax schedule. While overall tax rates are relatively high by international standards, structurally, the tax system resembles those of other industrialized countries because contributions to private pension plans and mortgage interest payments are tax deductible.5
To our knowledge, we are the first to link the impact of promotions and employee mobility on earnings growth to taxation. As such, we contribute to studies that investigate the effects of income taxes on individual behavior (for a recent survey, see Kniesner and Ziliak 2008). In particular, because we emphasize incentives for effort and mobility that lead to higher earnings without necessarily increasing hours worked, our paper is related to studies that estimate the elasticity of taxable income (e.g., Feldstein 1995; Gruber and Saez 2002; for a survey, see Saez, Slemrod and Giertz 2010).
Our main contribution is to the personnel economics and income dynamics literatures. The innovation of this paper is to show the consequences of mobility on both gross and net income, as well as on deductions. Thereby, we provide a more detailed picture of factors that motivate labor market effort and mobility than was possible in previous studies. Fur-thermore, we add to the limited number of studies that use a single data set to investigate job mobility both within and across firm boundaries. Among these are McCue (1996), who uses the PSID, Dias da Silva and Van der Klaauw (2010), who use Portuguese matched employer-employee data (Quadros de Pessoal), and our companion paper, Frederiksen et al. (2010), that also uses the IDAdata.
The paper is organized as follows. We provide an illustration of the theoretical driving forces behind growth in gross and net income income in Section 2. A description of our data follows in Section 3, and we lay out the econometric strategy in Section 4. Section 5 presents our estimation results, and Section 6 concludes the paper with a discussion of our findings.
2
Gross vs. Net Income Growth: The Driving Forces
How does growth in after-tax income differ from growth in pre-tax income? At first, one might expect that a progressive tax system simply attenuates net income growth relative to gross income growth. To capture this intuition more formally, note that taxes can be
5Tax-deductibility of contributions to private pension plans is very common. For an overview of practices
in OECD countries see, e.g., Table 1 in Caminada and Goudswaard (2008). Tax relief for mortgage interest is allowed in several countries, including the Netherlands, the U.K. and the U.S. In the Netherlands, interest can be deducted over a maximum period of 30 years (see http://www.belastingdienst.nl/variabel/ buitenland/en/private_taxpayers/private_taxpayers-12.html). In the U.K., mortgage interest relief was phased out for new loans in April 2000 (see http://www.hmrc.gov.uk/stats/mir/intro.pdf). The U.S. provisions allow interest deductions on debt of up to $1 million under 26 U.S.C.§163(h) of the Internal Revenue Code.
written as gross income Ct times the individual’s average tax rate τt. So, net income is
simplyCnet
t =Ct(1−τt), and net income growth is related to gross income growth as follows
(assuming that the tax system has no deductions or exemptions):
Cnet t Cnet t−1 = Ct Ct−1 (1−τt) (1−τt−1) . (1)
Because average tax rates increase with gross income in a progressive tax schedule, the second factor in equation (1) will be less than one. In other words, net income grows more slowly than gross income.
This argument, however, only partially captures the influence of taxes on income growth. Because the tax system allows for deductions, there is a second effect: deductions from gross income lead to a lower taxable base, which in turn, leads to lower taxes. So if the taxable base grows at a slower speed than gross income, then the net income growth rate may actually exceed that of gross income. To see the driving forces more clearly, suppose deductions in yeart are Ctdt. Taxes then are computed as Ct(1−dt)τt and we obtain
Ctnet Cnet t−1 = Ct Ct−1 (1−(1−dt)τt) (1−(1−dt−1)τt−1) . (2)
Rearranging terms in equation (2) yields
Cnet t Cnet t−1 > Ct Ct−1 ⇔ 1−1dt 1−dt−1 > τt τt−1 . (3)
After accounting for deductions, net income growth depends on both the evolution of the average tax rate and deductions. Net income grows faster than gross income if the taxable base increases more slowly than the average tax rate (because of increases in the portion of earnings that are deducted for tax purposes). The bottom line is that there is no simple relation between gross and net income growth.
3
The Data
Our study merges tax records with register-based information on all establishments and resi-dents in Denmark from Statistics Denmark’s Integrated Database for Labor Market Research (IDA).6 We focus on male core private-sector employees with stable labor force attachment, and restrict the age range so that education and retirement choices play no significant role. That is, our sample includes all male employees in Denmark who were continuously in full-time employment between 1994 and 2005 in private sector establishments with at least 25 employees, and who were aged between 30 and 45 years at the start of the panel in 1994.7
6The Danish name for the database is Integreret Database for Arbejdsmarkedsforskning (IDA). It is
documented athttp://www.dst.dk/TilSalg/Forskningsservice/Databaser/IDA.aspx.
7While we know employment status from social security records on a monthly basis, employer-employee
Table 1: Descriptive statistics (at start of panel in 1994)
Agea 37.63
(4.53)
9 years (less than high school) 18.26%
12 years (high school) 56.19%
15 years (Bachelor’s degree or professional degree) 18.55%
17 years (Master’s degree) 7.00%
Firm sizea (number of employees, employee weighted average) 2,259 (3,524)
Unique individuals 58,860
Person-year observations (1994 - 2005) 706,320
Notes: Panel of men aged 30 to 45 in 1994, continuously employed between 1994 and 2005 in private sector firms with at least 25 employees. a Mean (standard deviation).
Table 1 presents some descriptive statistics. The sample contains a balanced panel of 58,860 unique individuals, who each have an 11-year employment history, resulting in 706,320 person-year observations. At the start of our panel, the average person is 38 years old, works in a firm with 2,559 employees, and has completed high school.
3.1
Income Measures
The tax records provide detailed information on various income measures important for calculating tax payments, actual taxes paid and deductions. We can explain the actual tax payments for more than 95 percent of the population with an accuracy of ± DKK 5 (less than £1). To illustrate how our data permit us to distinguish the effects of tax deductions from those of progressive tax rates, a brief overview of the main features in the Danish income tax code is required (Appendix A provides more details). Two major categories of tax deductions prove to be important: voluntary contributions to private pension plans and deductions for interest on debt (where substantial deductions typically stem from mortgage interest and interest on car loans).8
Denmark has a progressive income tax schedule with essentially four tax brackets (illus-trated in Figure 1 in Appendix A). The first tax bracket is a social security payroll tax of around 9 percent applied to labor income. In a subsequent step, the tax authorities compute
for instance lasting from March to September of a particular year, cannot be picked up with our data. Given our focus on core employees with continuous employment histories, however, this does not seem problematic for our purposes.
8Cars in Denmark are extremely expensive. In addition to VAT at the time of import into the country
they are subject to a special registration tax of 105 percent on the Danish market value of the car up to DKK 79,000 (around£ 9,000) and of 180 percent on the value of the car exceeding that threshold (2010 rates; thresholds are occasionally adjusted for inflation seehttp://www.skat.dk/SKAT.aspx?oId=63&vId=0).
Table 2: Overview of income measures and deduction opportunities
Labor income(annual base pay and variable pay components) - Payroll tax
- Deductions (voluntary contributions to pension funds)
= Personal income
- Deductions (commuting costs, union dues, and unemployment insurance contributions) + Capital income
Earned interest (e.g., savings accounts and bonds)
- Interest payments (major categories: interest on mortgages and car loans)
= Taxable income
Net income= labor income + capital income - taxes paid
two income measures that enter the tax bases for additional tax payments: personal income
andtaxable income. The relations between the various measures are summarized in Table 2, and Table 3 contains the sample means and standard deviations in 2000 – the year for which we illustrate the tax code in Appendix A. In our empirical analysis we adjust all income measures to year-2000 prices using Statistics Denmark’s consumer price index.
Personal income is defined as labor income net of the payroll tax and net of voluntary
contributions to private pension funds (up to the maximum deduction of DKK 35,200 in
2000). Average personal income is DKK 350,022 in 2000 (corresponding to £ 28,575), as compared to average gross labor income of DKK 387,655, thus reflecting average deductions of DKK 2,744 (we first subtract the payroll tax of 9 percent).
Taxable income is defined as personal income pluscapital income (and allows for deduc-tions over which the individual has little discretion, such as commuting costs, or which are relatively minor, such as union membership fees). Capital income includes interest earned on savings accounts or bonds (dividends and capital gains on stocks are taxed separately) and is reduced by the amount of interest paid on debt. Hence, tax relief for interest on
mort-Table 3: Descriptive statistics for income measures (in 2000)
Labor income 387,655 Personal income 350,022
(183,524) (182,517)
Net income 192,520 Taxable income 299,627
(74,506) (182,298)
Capital income -33,024 (37,327)
Notes: Mean (standard deviation) Danish kroner; DKK 100 =£ 8. For income definitions see Table 2.
gages or car loans enters at this stage. Importantly, almost all individuals hold significant amounts of debt. Specifically, capital income is negative for more than 93 percent of our sample in 1994; and 11 years later, more than 88 percent still have negative capital income. The average taxable income of DKK 299,627 reflects total downward adjustments of DKK 50,395, of which DKK 33,024 are due to negative capital income.9
3.2
Promotions and Cross-Firm Mobility
Unique identifiers in theIDA data allow us to map cross-firm moves by following individu-als and establishments over time (matches between employees and employers are recorded once a year in November). Further, the data provide a measure of hierarchical placement based on the first digit of the Danish International Standard Classification of Occupations (DISCO) codes. We distinguish “executives” – employees who manage organizations or de-partments (major group 1, comprising corporate managers and general managers) – from “non-executives” (subsuming all other major groups).10 Our hierarchical placement variable has two advantages. First, it has a consistent interpretation across the wide spectrum of firms covered by our data, helping to avoid some of the problems caused by promotion mea-sures based on organizational charts and self-reports from employees or employers, whose firm- or industry-specific nature complicates comparisons.11 Second, our variable provides a
clean measure of an employee’s promotion that involves an actual change in position. Such a shift in the employee’s production technology is central to prominent theoretical models of wage and promotion dynamics (e.g., Bernhardt 1995, Gibbons and Waldman 1999, 2006).12 While most employees remain with their current employer, every year around 11 percent of the sample switch employers. We also observe that about 1.5 percent of the non-executives are promoted every year. The combination of cross-firm mobility and within-firm moves results in eight different types of flows accounted for by our estimation: non-executives staying with their current employer, moving to a new employer, or promoted within-firm or
9Broken down by age categories, average capital income (standard deviation) for employees less than or
equal to 40 is DKK -34,314 (28,060), DKK -33,914 (41,431) for those aged 40-45, and DKK -31,261 (39,775) for those above 45.
10The DISCO codes follow the international definitions from the International Labor Organization (ILO),
documented athttp://www.ilo.org/public/english/bureau/stat/isco/.
11A change in hierarchical level according to the classification is often not perceived as such by members
of the organization. For example, 70 percent of all moves classified as a promotion are not considered to be a promotion by the employer in the Portuguese matched employer-employee dataQuadros de Pessoal used by Dias da Silva and Van der Klaauw (2010).
12Often it is hard to distinguish “promotions” that involve no position change from other elements of
pay-for-performance. For example, 40-50 percent of self- or employer-reported promotions involve no change in job description in Dias da Silva and Van der Klaauw (2010), who use employer-reported promotions in
theQuadros de Pessoal, and in Pergamit and Veum (1999), who exploit questions about promotion receipt
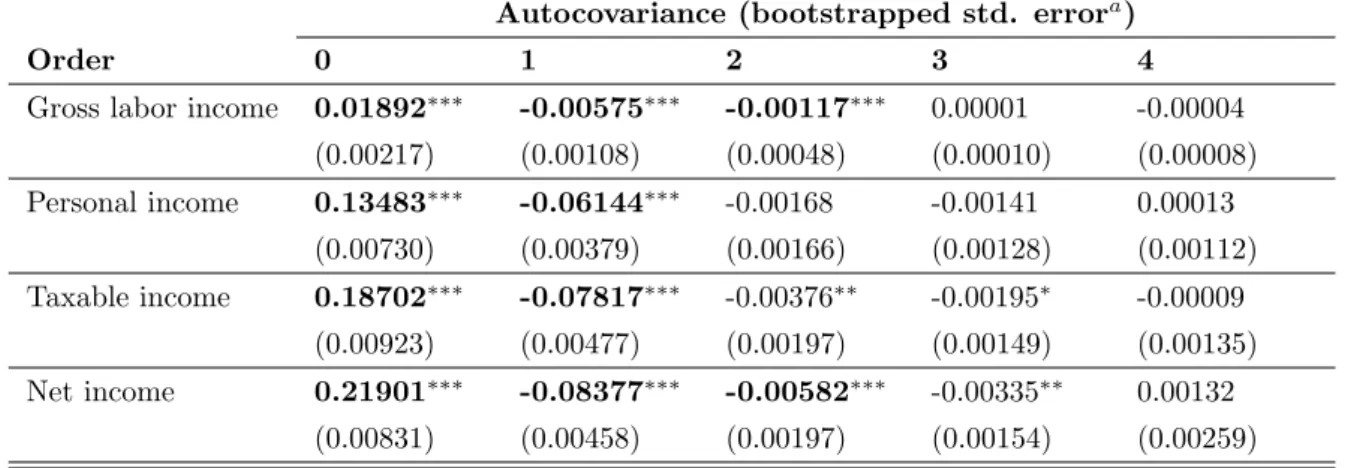
Table 4: The autocovariances of income growth
Autocovariance (bootstrapped std. errora)
Order 0 1 2 3 4
Gross labor income 0.01892∗∗∗ -0.00575∗∗∗ -0.00117∗∗∗ 0.00001 -0.00004 (0.00217) (0.00108) (0.00048) (0.00010) (0.00008) Personal income 0.13483∗∗∗ -0.06144∗∗∗ -0.00168 -0.00141 0.00013 (0.00730) (0.00379) (0.00166) (0.00128) (0.00112) Taxable income 0.18702∗∗∗ -0.07817∗∗∗ -0.00376∗∗ -0.00195∗ -0.00009 (0.00923) (0.00477) (0.00197) (0.00149) (0.00135) Net income 0.21901∗∗∗ -0.08377∗∗∗ -0.00582∗∗∗ -0.00335∗∗ 0.00132 (0.00831) (0.00458) (0.00197) (0.00154) (0.00259) Notes: All income measures are in year-2000 prices. For definitions see Table 2. a 100 replications.
Significance levels: ***1 percent, ** 5 percent, * 10 percent.
while moving to a new firm; executives staying with their current employer, moving to a new employer, or demoted to a non-executive position within the same firm or at a new firm (Appendix B provides detailed flow statistics).
4
The Econometric Strategy
For a given earnings measureCi,t for individualiat date t, we model log earnings growth as
∆ ln (Ci,t) ≡ ln(Ci,t)−ln(Ci,t−1) = αi+ J
X
j=1
µjMj,i,t+Xi,t0 β+ui,t, (4)
ui,t = υi,t + ∆εi,t.
The right-hand side of equation (4) consists of a fixed-effect (αi),J mobility dummies Mj,i,t,
a vector of control variables (Xi,t), and a residual (ui,t). The mobility dummies correspond
to the flows presented above, using as reference category non-executive employees staying at that level within the same firm. Our control variables include a quadratic in age, as well as education, sector, and year fixed-effects. The residual contains an iid permanent income shock (υi,t) and a transitory shock (∆εi,t) that follows an M A(q) process. Studies
of individual earnings dynamics typically find that q is of low order (e.g., Abowd and Card 1989; Meghir and Pistaferri 2004).
The first step is to determine if there is a fixed-effect in earnings growth (i.e., V ar(αi)>
0). This is done using a procedure common in the earnings dynamics literature that tests for significance of the autocorrelations of earnings growth (see, e.g., Abowd and Card 1989; Meghir and Pistaferri 2004). In the presence of a fixed-effect, autocorrelations should be positive and significant at all leads and lags. Table 4 reports autocovariances along with
their bootstrapped standard errors for the four income measures that we use in our empirical analysis. Autocorrelations die out after a few lags, providing evidence against a fixed-effect in earnings growth. We therefore assume that V ar(αi) = 0.13
The model in equation (4) is purged of serial correlation in the residual by projecting ∆εi,t onto lagged earnings growth:
∆εi,t = S X s=1 γs∆ ln (Ci,t−s) +ξi,t. Substituting, we obtain ∆ ln (Ci,t) = S X s=1 γs∆ ln (Ci,t−s) + J X j=1
µjMj,i,t+Xi,t0 β+ei,t, (5)
where ei,t ≡ ξi,t +υi,t. The parameters γs reflect the correlation between lagged earnings
growth and transitory earnings shocks.14 A Cochrane-Orcutt test can determine whether
the included lags are sufficient to eliminate serial correlation in theei,t. In our data we find
that there is no significant serial correlation in ei,t for any of the income measures if three
lags are included (Table 5 reports Cochrane-Orcutt tests for our regressions).
We assume that mobility is predetermined by imposing the following moment conditions
E[ei,tMj,i,s] = 0 for t≥s and for allj. (6)
That is, the residual in equation (5) at time t is assumed to be orthogonal to all mobility dated t and prior, implying that the permanent income innovation embedded in ei,t can
affect mobility at t+ 1 and beyond. The moment conditions restrict the serial correlation in ei,t (see Arellano and Honor´e 2001). As discussed above, one can thus remove the serial
correlation stemming from the transitory shocks in model (4) and obtain consistent estimates by including a sufficient number of lags of earnings growth, as is done in equation (5).
With our econometric treatment of mobility, we follow important previous contributions in this literature (e.g., Topel and Ward 1992). While our procedure does control for un-observed individual heterogeneity, the predeterminedness assumption is not innocuous. It is, however, the best assumption we can invoke because we do not have valid and strong instruments at hand forall eight types of mobility and all income measures considered herein.
13While the assumption thatV ar(α
1) = 0 and the moment conditions (6) imply that equation (5) can
be estimated using OLS, the analysis of gross earnings data in our companion paper, Frederiksen et al. (2010), investigates the robustness of this approach using a GMM procedure `a la Arellano and Bond (1991) to estimate a model that allows for a fixed-effect in earnings growth.
14Note that the permanent shock,υ
i,t, will be uncorrelated with the lagged mobility variables embedded
5
Mobility and Income Growth
We now investigate the impact of mobility and hierarchical transitions on gross and net income growth. After that, we exploit the additional income categories in our data to determine the extent to which the differences in growth rates between the gross and net income measures are due to progressive taxation or to the use of tax deductions.
5.1
Gross Versus Net Income
Starting with pre-tax labor income, the first column of Table 5 shows that lagged income growth has a negative effect on current growth, which is in line with previous studies on income growth (e.g., Abowd and Card 1989; Belzil and Bognanno 2008; Meghir and Pistaferri 2004; Topel and Ward 1992). Promotions and lateral mobility provide a significant boost to labor income growth and executives experience higher income growth than non-executives. This finding is consistent with learning models where assignment to a higher-level job entails a steeper income growth path (e.g., Gibbons and Waldman 1999, 2006). Demotions, on the other hand, have no significant impact on growth relative to the baseline growth of a non-executive stayer. This reveals an asymmetry between the effect of a promotion and a demotion on wage growth, similar to what Belzil and Bognanno (2008) find. For our purposes, these results serve as comparison point with the estimates for the other income measures (see our companion paper, Frederiksen et al. (2010), for a more extensive discussion and further analysis of mobility and gross labor income growth).
Net income captures the amount that an employee has available for consumption and saving after taxes (net income = labor income + capital income - taxes paid). Comparing the first and the last columns of Table 5, we see that only executive stayers are on a steeper trajectory for net income growth and that non-executives who make lateral moves across firms witness lower net income growth. All other mobility and promotion effects are no longer significant. While net income levels differ for those who get promoted or switch employers and those who do not, the regressions show that such career moves do not generally accelerate the rate at which people can consume or save net income. Our finding that changes in gross income growth do not translate to proportionate changes in net income growth contradicts the simple explanation that progressive tax rates attenuate after-tax income growth, while leaving the qualitative effects of mobility and promotions unchanged. Indeed, in the next step of our analysis, we show how individuals adjust their deductions in a way that results in almost constant after-tax income growth.
5.2
Tax Deductions and Net Income
The discrepancy between growth rates of labor income and net income reflects the compound effects of deductions and the progressivity of the tax schedule. We separate these effects
Table 5: Growth of tax-related components of income
Labor Personal Taxable Net
income income income income
Labor income growth (t-1) -0.400∗∗∗ -0.597∗∗∗ -0.554∗∗∗ -0.583∗∗∗
(0.028) (0.018) (0.015) (0.016)
Labor income growth (t-2) -0.249∗∗∗ -0.347∗∗∗ -0.302∗∗∗ -0.352∗∗∗
(0.029) (0.016) (0.013) (0.015)
Labor income growth (t-3) -0.105∗∗∗ -0.174∗∗∗ -0.144∗∗∗ -0.184∗∗∗
(0.014) (0.009) (0.008) (0.011)
Non-executive lateral move, within-firm – – – –
Non-executive lateral move, cross-firm 0.008∗∗∗ 0.013∗∗∗ 0.015∗∗∗ -0.011∗∗∗
(0.001) (0.002) (0.002) (0.002) Promotion, within-firm 0.017∗∗∗ 0.020∗∗∗ 0.023∗∗∗ 0.007 (0.002) (0.005) (0.007) (0.010) Promotion, cross-firm 0.066∗∗∗ 0.084∗∗∗ 0.099∗∗∗ -0.017 (0.007) (0.015) (0.016) (0.037) Executive stayer 0.013∗∗∗ 0.019∗∗∗ 0.022∗∗∗ 0.007∗∗ (0.001) (0.002) (0.002) (0.004)
Executive lateral move, cross-firm 0.041∗∗∗ 0.056∗∗∗ 0.057∗∗∗ -0.029
(0.003) (0.006) (0.008) (0.020) Demotion, within-firm 0.003 0.013∗∗∗ 0.014∗∗ 0.012 (0.004) (0.005) (0.007) (0.012) Demotion, cross-firm 0.006 0.025∗∗ 0.020∗ -0.046 (0.008) (0.010) (0.012) (0.038) Age/10 -0.065∗∗∗ -0.057∗∗∗ 0.004 -0.026 (0.007) (0.014) (0.016) (0.020) Age2/100 0.005∗∗∗ 0.003∗∗ -0.003 0.000 (0.001) (0.002) (0.002) (0.002) constant 0.224∗∗∗ 0.207∗∗∗ 0.089∗∗ 0.177∗∗ (0.017) (0.033) (0.037) (0.043) R2 0.1441 0.3066 0.2798 0.2346 Observations 470,880 470,880 470,880 470,880
Cochran-Orcutt test (H0: zero autocorrelation in errors)
-0.004 0.041 0.048 -0.022
(p-value) (0.933) (0.131) (0.038) (0.240)
Dependent variable: Change in log real income measureln(It)−ln(It−1).
Notes: All regressions include education, sector, and year dummies. Clustered standard errors are reported in parentheses. Significance levels: ***1 percent, ** 5 percent, * 10 percent.
through comparisons of the intermediate income measures in our data.
Personal income is the first important tax base to consider. If personal income grows, then tax payments grow. The second column in Table 5 shows that the coefficients on mobility and hierarchical transitions increase relative to those for labor income. In particular, for the two categories of lateral cross-firm moves and for executive stayers, the coefficients increase by more than 2 standard deviations. This implies that increases in gross income growth following a career move are not always matched with a commensurate boost to deductions for pension fund contributions. To see this, recall from Section 2 that differences in growth rates between two income measures depend on how the average tax rate changes and how deductions evolve. Because the payroll tax is a proportional tax, the average tax rate, however, does not change with income levels. Thus, the different speeds at which labor and personal income grow are driven by deductions (contributions to private pension plans).15
Consequently, higher growth in personal income means that deductions must have grown at a slower pace than labor income.
The simple explanation for why deductions grow at a lower rate than net income is that there is a cap on tax deductible private pension contributions. A slowdown in deductions growth means that the tax base personal income and, hence, the (progressive) taxes com-puted from personal income, grow faster than gross income. This depresses net income growth above and beyond the effect of progressive taxation (see equation (2)) and may even completely nullify or reverse the trend in gross income growth.
The next step is to compare growth rates of personal income and taxable income. The comparison reveals how interest payments on debt evolve, because there is little discretion over other deductions at this stage. No limits apply for tax relief on interest, and the fact that almost all individuals have negative capital income (see Section 3) facilitates the interpretation. If a person uses a shareρof personal income (PI) to make interest payments on debt, taxable income (TI) is T I =P I × (1−ρ). Hence,
T It T It−1 = P It P It−1 (1−ρt) (1−ρt−1) . (7)
The second and third columns in Table 5 reveal that coefficients for mobility and hierarchical transitions do not move much (considering the size of the standard errors), suggesting that
ρ remains more or less constant over time. That is, people appear to adjust their debt so that interest payments move in parallel with their growth in labor income.16
15To see the relation with equation (3), denote deductions byD
t and rewrite personal income asP It =
(1−τpayroll)LI
t−Dt. Note that deductions out of labor income after payroll taxes,D0=Dt/(1−τpayroll),
grow at the same rate asDtbecause of the constant payroll tax rateτpayroll. One can then apply (3) to the
proportion of income after payroll taxes deducted,d0
t.
16Remember that personal income captures other deduction opportunities that explain the discrepancy
between taxable income and labor income coefficients. Or, put differently, if personal income grew in lock-step with gross income, our results would suggest that taxable income and labor income exhibit the same
This is actually less surprising than it may first appear. Mortgage contracts in Denmark have a standard format that states repayments in terms of both gross and net income, making it easier to plan net income growth. The majority of mortgages are securitized and there is a relatively liquid market for these types of securities, resulting in low transaction costs and allowing for relatively easy restructuring of interest schedules. The ubiquitous summer houses in Denmark and financed car purchases provide other opportunities for significant debt-financed consumption. A further indication that net income growth is “managed” through adjustments in debt comes from the fact that age ceases to be significant in the third and fourth columns in Table 5.
In sum, while interest payments on financed consumption are proportional to gross income progression, this is not the case for private pension contributions. The latter finding is the consequence of a policy that places a cap on pension deductions. One implication of this is that personal income – a tax base – increases faster than gross labor income and thus results in relatively higher tax payments. In turn, this has the consequence that net income grows at a slower rate than would be expected if the only difference between gross labor income and net income growth was the attenuation effect of a progressive tax schedule.
6
Discussion and Conclusion
In our data, advancing to a management position and cross-firm mobility increase real in-come growth before taxes. One could have expected these effects to manifest themselves in net income as well, just attenuated on account of the progressive tax schedule. Instead, we find that, while executives are on a significantly steeper net income growth path than non-executives, career events such as promotions and cross-firm moves do not lead to a significant increase in short-run net income growth. It appears that people exploit deduction opportu-nities for pension fund contributions and tax relief on debt interest payments to maintain relatively constant growth in real net income. This points to links between labor market mobility and certain types of financial decisions that are interesting for future research.
The fact that promotions and cross-firm moves have no significant positive impact on net income growth suggests that employees do not enjoy their fruits in the form of general consumption. Instead, the additional income growth flows into mortgage-financed housing, other forms of debt, and tax-shielded long-term savings (via pension contributions, to the extent allowed by contribution limits). The benefits of career progression and mobility thus seem to be that they allow for tax-shielded credit that is used to live in a nicer, more expensive home, to drive a better car, to have a summer cottage, or to increase tax-shielded pension contributions that increase income in old age. Perhaps what also matters is that tax-shields can be exploited to finance particularly conspicuous forms of consumption such
as cars and housing (e.g., Veblen 1899; Frank 1985, 2000).
Overall, our results show that the distinction between gross and net income does matter for the effects of mobility and promotions on income growth patterns. The reason is that net income does not reflect tax-shielded consumption and savings opportunities made possible by increases in gross income. Our findings suggest that, in the absence of detailed knowledge of tax deductions, results based on gross income growth provide a more accurate qualitative picture than those based on net income growth. This is good news in view of the fact that the empirical literature on income dynamics and the effects of mobility and promotions relies on gross income data for lack of good net income measures.
Appendix
0 4 8 12 16 20 25 29 33 37 41 45 49 53 57 61 65 69 74 78 82 30% 40% 50% 60% 70%Labor income (equivalent thousands of Pounds Sterling)
0% 10% 20%
0 50 100 150 200 250 300 350 400 450 500 550 600 650 700 750 800 850 900 950 1,000
Labor income (thousands of Danish Kroner)
Series3 Series4 Series5 Marginal tax rate Average tax rate
Notes: Illustration based on the assumption that the person lives in a municipality with “average” tax rates, and that he does not have any capital income or other income, and no deductions.
Figure 1: Income tax schedule for 2000.
A
A Primer on Income Taxation in Denmark
All wage income is subject to a gross tax (8 percent in 2000), which is comparable to the social security contributions known in other countries.17 An additional 1 percent of labor income is paid into a mandatory pension fund. The gross tax and mandatory pension contribution can be thought of as a 9 percent payroll tax, which marks the first tier in the Danish income taxation system.
Deductions enter at different stages in the process of calculating tax payments. This makes it possible to measure separately the impact on earnings growth of the two - for our purposes - most important deduction opportunities: voluntary contributions to private pen-sion plans and debt interest relief. The former is reflected inpersonal income, defined as labor
17We use the year-2000 tax code to explain the various income measures, tax rates, and income thresholds,
abstracting from changes in the tax code over our sample period. Income thresholds are adjusted annually to account for inflation. Taking into account changes in the tax code and regional differences in rates etc., we can reconstruct tax payments for more than 95 percent of the population with an accuracy of±DKK 5 (less than£1).
income net of the 9 percent payroll tax and net of deductions for voluntary contributions to private pension funds (up to a maximum threshold of DKK 35,200). The latter is reflected in
taxable income. This income measure is defined as personal income plus capital income net of deductions. Among the deduction opportunities at this stage (ligningsmæssigefradrag) the principal ones are commuting costs, union membership fees and contributions to an un-employment insurance fund.18 Capital income includes interest earned on savings accounts or bonds and allows for deduction of interest paid on debt (dividends and capital gains on stocks are taxed separately). Interest payments on debt reduce capital income and thereby lower taxable income. That is, tax relief on mortgage interest enters at this stage.
Taxable and personal incomes serve as bases for four different tax components. The first comprises local and church taxes: any amount of positive taxable income above a standard allowance (the personal deduction of DKK 33,400) is subject to municipal and regional taxes (32.8 percent for the average municipality). For members of the Evangelical Lutheran Church of Denmark (Folkekirken) – around 83 percent of the Danish population in 2000 – the tax rate is increased by around one percentage point. The second is the bottom-bracket tax, calculated by applying a rate of 7 percent to a tax base consisting of personal income plus positive net capital income, minus half of any negative net capital income, minus deductions. The third component is the middle-bracket tax of 6 percent. The base for this tax is personal income plus any amount of positive capital income that exceeds the threshold of DKK 164,300. The fourth component is the top-bracket tax. The base for this tax is personal income, plus positive capital income, plus voluntary contributions to private pension funds. Only the part of this base that exceeds a threshold of DKK 267,600 is subject to the top-tax rate of 15 percent.
A complication in the Danish tax system is the so-called tax ceiling. If the municipality and regional tax rates are sufficiently high so that they together with the sum of the bottom-, middle- and top-tax rates exceed the tax ceiling of 59 percent, then the top-tax rate is capped so that the sum of the tax rates is 59 percent. In practice, this implies that the effective top-tax in almost half of the municipalities is below 15 percent. A second detail is that the Danish tax system is primarily an individualized tax system, which facilitates our exercise. There is only a quantitatively very moderate component of joint taxation because unused deductions can be transferred to a spouse.
To summarize, the above tax components result in a schedule with essentially four tax brackets. Figure 1 plots this tax schedule for the 2000-tax code, making it directly compa-rable with our real income measure that uses 2000 as base year. The figure assumes that the person lives in a municipality with ”average” tax rates, and that the individual has no positive or negative capital income, and no deductions.
Table 6: Mobility patterns
percent percent of group
(annual transition probability)
All transitions 100 within-firm moves 88.56 cross-firm moves 11.44 Non-executive level 92.73 100 Non-executivet−1 →Non-executivet no move 80.94 87.28
lateral move, cross-firm 10.43 11.25
Non-executivet−1 →Executivet promotion, within-firm 1.12 1.20 promotion, cross-firm 0.25 0.27 Management 7.27 100 Managementt−1 →Managementt no move 5.65 77.72
lateral move, cross-firm 0.56 7.72
Executivet−1 →Non-executivet
demotion, within-firm 0.86 11.78
demotion, cross-firm 0.20 2.78
Notes: 647,460 person-year observations 1995-2005 (58,860 unique individuals).
B
Hierarchical and Cross-Firm Transitions
The combination of cross-firm mobility and within-firm moves results in the eight differ-ent types of flows summarized in Table 6. While most employees stay with their currdiffer-ent employer, every year around 11 percent of the sample move to a new company. The non-executive layer comprises around 93 percent of all employees. The bulk of them remain non-executives and stay with the same employer as in the last year (87 percent) and 11 per-cent move laterally across firms. A bit more than 1 perper-cent are promoted to a management position within the same firm, and promotions across firm boundaries account for around 0.3 percent of the non-executives. Similarly, executives (who make up around 7 percent of the sample) typically remain in management positions, but there is less persistence than for non-executives. That is, 78 percent stay with their current employer and 8 percent move to an executive-level position in a new firm. Almost 12 percent of executives move to a non-executive level job within the same firm, and slightly less than 3 percent of the non-executives make such a move across firm boundaries. Our data thus add to a number of studies which show that demotions are by no means exceptional (see Frederiksen et al. (2010) for further discussion of this issue).
References
Aagaard, Anders, Tor Eriksson and Niels Westergaard-Nielsen, “Wage and Labor Mobility in Denmark, 1980-2000,” in E. P. Lazear and K. L. Shaw, eds,Wage Structure, Raises and Mobility: International Comparisons of the Structure of Wages Within and Across Firms, 2009, University of Chicago Press and NBER, chapter 4, pp. 173–92.
Abowd, John M. and David Card, “On the Covariance Structure of Earnings and Hours Changes,” Econometrica, 1989,57 (2), 411–45.
Altonji, Joseph G. and Nicolas Williams, “Do Wages Rise With Job Seniority? A Reassessment,” Industrial and Labor Relations Review, 2005, 58 (3), 370–97.
Altonji, Joseph G. and Robert A. Shakotko, “Do Wages Rise With Job Seniority?”
Review of Economic Studies, 1987, 54 (3), 437–59.
Antel, John J., “Human Capital Investment Specialization and the Wage Effects of Vol-untary Labor Mobility,” Review of Economics and Statistics, 1986, 68 (3), 477–83.
Antel, John J., “The Wage Effects of Voluntary Labor Mobility With and Without Inter-vening Unemployment,” Industrial and Labor Relations Review, 1991,44 (2), 299–306.
Arellano, Manuel and Bo Honor´e, “Panel Data Models: Some Recent Developments,” in J.J. Heckman and E.E. Leamer, eds., Handbook of Econometrics, Vol. 5, Elsevier, 2001, chapter 53, pp. 3229–96.
Arellano, Manuel and Stephen Bond, “Some Tests of Specification for Panel Data: Monte Carlo Evidence and an Application to Employment Equations,” Review of Eco-nomic Studies, 1991, 58 (2), 277–97.
Bagger, Jesper, Fran¸cois Fontaine, Fabien Postel-Vinay and Jean-Marc Robin, “A Feasible Equilibrium Search Model of Individual Wage Dynamics with Experience Accumulation,” Discussion paper 09/02, University of Bristol, October 2009.
Baker, George, Michael Gibbs, and Bengt Holmstr¨om, “The Internal Economics of the Firm: Evidence from Personnel Data,”Quarterly Journal of Economics, 1994,109, 881–919.
Baker, George, Michael Gibbs, and Bengt Holmstr¨om, “The Wage Policy of a Firm,”
Quarterly Journal of Economics, 1994,109, 921–55.
Bartel, Ann and George Borjas, “Wage Growth and Job Turnover: An Empirical Anal-ysis,” in Sherwin Rosen, ed., Studies in Labor Markets, Chicago: University of Chicago Press, 1981, pp. 65–89.
Belzil, Christian and Michael Bognanno, “Promotions, Demotions, Halo Effects, and the Earnings Dynamics of American Executives,” Journal of Labor Economics, 2008,
26 (2), 287–310.
Bernhardt, Dan, “Strategic Promotion and Compensation,” Review of Economic Studies, 1995, 62 (2), 315–39.
Booth, Alison L., Marco Francesconi, and Jeff Frank, “A Sticky Floors Model of Promotion, Pay, and Gender,”European Economic Review, 2003,47 (2), 295–322.
Browning, Martin and Søren Leth-Petersen, “Imputing Consumption from Income
and Wealth Information,” Economic Journal, 2003,113 (488), 282–301.
Buchinsky, Moshe, Denis Fougere, Francis Kramarz, and Rusty Tchernis, “Inter-firm Mobility, Wages, and the Returns to Seniority and Experience in the U.S,”Review of Economic Studies, 2010, 77, 972–1001.
Burdett, Kenneth and Dale T Mortensen, “Wage Differentials, Employer Size, and Unemployment,”International Economic Review, 1998, 39 (2), 257–73.
Caminada, Koen and Kees Goudswaard, “Revenue Effects of Tax Facilities for Pension Savings,” Atlantic Economic Journal, 2008, 36 (2), 233–46.
Chetty, Raj, John N. Friedman, Tore Olsen, and Luigi Pistaferri, “Adjustment Costs, Firm Responses and Labor Supply Elasticities: Evidence from Danish Tax Records,” Quarterly Journal of Economics, 2010. forthcoming.
Chiappori, Pierre-Andre, Bernard Salanie, and Julie Valentin, “Early Starters Ver-sus Late Beginners,” Journal of Political Economy, 1999,107 (4), 731–60.
da Silva, Antonio Dias and Bas Van der Klaauw, “Wage Dynamics and Promotions Inside and Between Firms,”Journal of Population Economics, 2010. forthcoming.
Dohmen, Thomas J., Ben Kriechel, and Gerard A. Pfann, “Monkey Bars and Lad-ders: The Importance of Lateral and Vertical Job Mobility in Internal Labor Market Careers,” Journal of Population Economics, 2004, 17 (2), 193–228.
Dustmann, Christian and Costas Meghir, “Wages, Experience and Seniority,” Review of Economic Studies, 2005, 72 (1), 77–108.
Enrick, Norbert L., “A Further Study of Income Tax Consciousness,” National Tax Journal, 1964, 17, 319–321.
Feldstein, Martin, “The Effect of Marginal Tax Rates on Taxable Income: A Panel Study of the 1986 Tax Reform Act,” Journal of Political Economy, 1995, 103 (3), 551–72.
Frank, Robert H., Choosing the Right Pond: Human Behavior and the Quest for Status, Oxford: Oxford University Press, 1985.
Frank, Robert H., Luxury Fever: Money and Happiness in an Era of Excess, Princeton: Princeton University Press, 2000.
Frederiksen, Anders, “Gender Differences in Job Separation Rates and Employment Sta-bility: New Evidence From Employer-Employee Data,” Labour Economics, 2008, 15
(5), 915-37.
Frederiksen, Anders, Bo E. Honor´e, and Luojia Hu, “Discrete time duration models with group-level heterogeneity,” Journal of Econometrics, December 2007, 141 (2), 1014–43.
Frederiksen, Anders, Timothy Halliday, and Alexander K. Koch, “Within- and
Cross-Firm Mobility and Earnings Growth,” IZA Discussion Papers 5163, Institute for the Study of Labor (IZA) September 2010.
Gibbons, Robert and Michael Waldman, “Careers in Organizations: Theory and Ev-idence,” in Orley Ashenfelter and David Card, eds., Handbook of Labor Economics, Vol. 3B, Amsterdam: Elsevier, 1999, chapter 36, pp. 2373–2437.
Gibbons, Robert and Michael Waldman, “A Theory of Wage and Promotion Dynamics Inside Firms,”Quarterly Journal of Economics, 1999, 114 (4), 1321–58.
Gibbons, Robert and Michael Waldman, “Enriching a Theory of Wage and Promotion Dynamics Inside Firms,” Journal of Labor Economics, 2006,24 (1), 59–107.
Gibbs, Michael and Wallace Hendricks, “Do Formal Salary Systems Really Matter?”
Industrial & Labor Relations Review, 2004,58 (1), 71–93.
Gruber, Jon and Emmanuel Saez, “The Elasticity of Taxable Income: Evidence and Implications,”Journal of Public Economics, 2002, 84 (1), 1–32.
Jolivet, Gregory, Fabien Postel-Vinay, and Jean-Marc Robin, “The Empirical Con-tent of the Job Search Model: Labor Mobility and Wage Distributions in Europe and the U.S.,”European Economic Review, 2006, 50 (4), 877–907.
Jovanovic, Boyan, “Job Matching and the Theory of Turnover,” Journal of Political Economy, 1979, 87 (5), 972–90.
Keith, Kristen and Abagail McWilliams, “The Returns to Mobility and Job Search by Gender,” Industrial and Labor Relations Review, 1999, 52 (3), 460–77.
Kniesner, Thomas J. and James P. Ziliak, “Evidence on Tax-Induced Individual Behav-ioral Responses,” in J.W. Diamond and G.R. Zodrow, eds., Fundamental Tax Reform: Issues, Choices, and Implications, MIT Press Cambridge, MA 2008.
Lazear, Edward P., “The Job as a Concept,” in William J. Bruns, Jr., ed., Performance Measurement, Evaluation, and Incentives, Boston: Harvard Business School Press, 1992, pp. 183–215.
Lazear, Edward P., “The Peter Principle: A Theory of Decline,” Journal of Political Economy, 2004, 112 (1), 141–63.
Lazear, Edward P. and Sherwin Rosen, “Rank-Order Tournaments as Optimum Labor Contracts,” Journal of Political Economy, 1981,89 (5), 841–64.
McCue, Kristin, “Promotions and Wage Growth,” Journal of Labor Economics, 1996,14
(2), 175–209.
Medoff, James L. and Katharine G. Abraham, “Experience, Performance, and Earn-ings,” Quarterly Journal of Economics, 1980, 95 (4), 703–36.
Medoff, James L. and Katharine G. Abraham, “Are Those Paid More Really More Productive? The Case of Experience,” Journal of Human Resources, 1981, 16 (2), 186–216.
Meghir, Costas and Luigi Pistaferri, “Income Variance Dynamics and Heterogeneity,”
Econometrica, 2004,72 (1), 1–32.
Mincer, Jacob, “Wage Changes in Job Changes,” Research in Labor Economics, 1986,8A, 171 – 97.
Pergamit, Michael R. and Jonathan R. Veum, “What is a Promotion?” Industrial and Labor Relations Review, 1999,52 (4), 581–60.
Saez, Emmanuel, Joel Slemrod, and Seth H. Giertz, “The Elasticity of Taxable Income with Respect to Marginal Tax Rates: A Critical Review,” Journal of Economic Literature, 2010. forthcoming.
Seltzer, Andrew and David T. Merrett, “Personnel Policies at the Union Bank of Australia: Evidence from the 1888-1900 Entry Cohorts,” Journal of Labor Economics, 2000, 18 (4), 573–613.
Topel, Robert, “Specific Capital, Mobility, and Wages: Wages Rise with Job Seniority,”
Topel, Robert H and Michael P Ward, “Job Mobility and the Careers of Young Men,”
Quarterly Journal of Economics, 1992,107 (2), 439–79.
Treble, J., E. Van Gameren, S. Bridges, and T. Barmby, “The Internal Economics of the Firm: Further Evidence from Personnel Data,” Labour Economics, 2001, 8 (5), 531–52.
Veblen, Thorstein,The Theory of the Leisure Class: An Economic Study in the Evolution of Institutions, New York: Macmillan, 1899. reprinted Oxford: Oxford University Press, 2008.
Wagstaff, Joseph Van, “Income Tax Consciousness under Withholding,” Southern Eco-nomic Journal, 1965, 32 (1), 73–80.