Open Access
Research
The Oslo Health Study: Is bone mineral density higher in affluent
areas?
Kari Alver*
1, Anne J Søgaard
1,2, Jan A Falch
3and Haakon E Meyer
2,1Address: 1Norwegian Institute of Public Health, Oslo, Norway, 2Institute of General Practice and Community Medicine, Faculty of Medicine, University of Oslo, Norway and 3Center of Endocrinology, Aker University Hospital, Oslo, Norway
Email: Kari Alver* - [email protected]; Anne J Søgaard - [email protected]; Jan A Falch - [email protected]; Haakon E Meyer - [email protected]
* Corresponding author
Abstract
Background: Based on previously reported differences in fracture incidence in the socioeconomic less affluent Oslo East compared to the more privileged West, our aim was to study bone mineral density (BMD) in the same socioeconomic areas in Oslo. We also wanted to study whether possible associations were explained by socio-demographic factors, level of education or lifestyle factors.
Methods: Distal forearm BMD was measured in random samples of the participants in The Oslo Health Study by single energy x-ray absorptiometry (SXA). 578 men and 702 women born in Norway in the age-groups 40/45, 60 and 75 years were included in the analyses. Socioeconomic regions, based on a social index dividing Oslo in two regions – East and West, were used.
Results: Age-adjusted mean BMD in women living in the less affluent Eastern region was 0.405 g/ cm2 and significantly lower than in West where BMD was 0.419 g/cm2. Similarly, the odds ratio of
low BMD (Z-score ≤ -1) was 1.87 (95% CI: 1.22–2.87) in women in Oslo East compared to West. The same tendency, although not statistically significant, was also present in men. Multivariate analysis adjusted for education, marital status, body mass index, physical inactivity, use of alcohol and smoking, and in women also use of post-menopausal hormone therapy and early onset of menopause, did hardly change the association. Additional adjustments for employment status, disability pension and physical activity at work for those below the age of retirement, gave similar results.
Conclusion: We found differences in BMD in women between different socioeconomic regions in Oslo that correspond to previously found differences in fracture rates. The association in men was not statistically significant. The differences were not explained by socio-demographic factors, level of education or lifestyle factors.
Background
Women and men in Oslo, the capital of Norway have the highest incidence rates of hip and forearm fractures and among the highest prevalence of vertebral fractures ever
reported internationally [1-4]. In accordance with this, an European multi-centre study found that bone mineral density (BMD) in men and women in Oslo were among the lowest in Europe [5].
Published: 23 November 2007
International Journal for Equity in Health 2007, 6:19 doi:10.1186/1475-9276-6-19
Received: 20 June 2006 Accepted: 23 November 2007
This article is available from: http://www.equityhealthj.com/content/6/1/19
© 2007 Alver et al; licensee BioMed Central Ltd.
Within this high risk city of osteoporosis and osteoporotic fractures regional differences in hip fracture incidence have been reported [6]. The highest fracture rates are found in Eastern parts of the city, which is less affluent than the Western part of the city, with RR ranging from 1.23 to 1.67. Equivalent regional differences have been found regarding mortality and other health indicators [7]. These health inequalities are connected to differences between the regions regarding standard of living and socio-economic status of the habitants, with the highest annual income and highest level of education in West [8,9].
Socioeconomic status is well established as a determinant for several health aspects and disease outcomes. Regard-ing fracture risk, a study includRegard-ing white Americans 50 years and older, reported a linear decrease in hip fracture rates with increasing income after controlling for age and sex [10]. Likewise, an ecological study from Wales found higher fracture incidence among socio-economically deprived adults [11]. This effect diminished with age and was not observed in older age groups (above 75 years). In a Norwegian population based case-control study includ-ing men and women, low educational level was associated with increased risk of hip fracture [12]. This was not con-firmed in a large Swedish case-control study among women [13]. They found however that being unem-ployed, being unmarried and living in an apartment (vs. one-family house) were associated with increased risk of hip fracture.
Studies addressing the association between BMD and socioeconomic status are likewise heterogeneous and not conclusive. Elliot et al found highest BMD in men from lower socio-economic groups [14], but several other stud-ies have found an association of low BMD with low-income, low education and living in socially deprived areas [15-21]. These studies had limitations which could make it difficult to conclude and generalize – i.e. they included mainly postmenopausal women, they studied partly small samples and the participation was based on self-selection or referral from general practitioners/con-sultants.
Using data from a population-based health survey, we wanted to examine whether BMD was lower in the socio-economic less affluent Oslo East compared to the more privileged Oslo West. Further, we wanted to assess whether the association could be attributed to socio-demographic factors, level of education or lifestyle factors.
Methods
Study population and data collection
All individuals living in the city of Oslo and born in 1970, 1960, 1955, 1940/41 and 1924/25 were invited to The
Oslo Health Study (HUBRO) 2000–2001. Information about age, gender, address and marital status was obtained from the Population registry. A total of 8404 men (42.4%) and 10366 women (49.3%) participated [22]. HUBRO comprised a simple physical examination (measurements of blood pressure, pulse, height, weight, waist and hip circumference), collection of venous non-fasting blood samples and questionnaires. The question-naires provided information on health status, symptoms, diseases and various aspects of health behaviour. Up to two reminders were sent to the non-responders of the invitation to participate in the survey.
The osteoporosis sub-study
As part of HUBRO a random sample of the invited aged 30, 40, 45, 60 and 75 years was selected to a forearm BMD measurement by single x-ray absorptiometry. Of 1525 men aged 75 years 998 were reserved for follow-up of a previous population based survey [23], and thus not a part of this study. Of all those invited to bone densitome-try 40% (1044 men and 1121 women) were measured. The attendance rate was lowest in the youngest age group and in men compared to women. Additional analyses comparing persons with a SXA densitometry with the rest of the HUBRO-population showed only minor differ-ences regarding self perceived health, length of education, body mass index and physical activity. More detailed information on the attendance rate in the osteoporosis sub-study has been reported previously [24]. In the cur-rent paper we have excluded persons not born in Norway (487) to minimize interference on BMD from ethnicity. We have also excluded 368 persons born in 1970 (young-est age group), since most of them had not yet settled. In this age-group 83% had moved at least once during the last 5 years compared to 9–33% in the other age-groups. Three scans (1 man and 2 women) were not valid and information about place of residence was missing in 27 persons (7 men and 20 women). Finally 578 men and 702 women were included in the analysis.
Bone Mineral Density assessment
the non-dominant side at both the distal and ultra-distal site, and thus no adjustments were done [25]. All scans were reviewed and reanalysed if necessary [26].
Regions in Oslo
Initially we split Oslo into four regions – inner East, outer East, inner West and outer West – according to a previ-ously used grouping [7]. The grouping was based on a social index taking the distribution of unemployment, education, non-Western immigrants and single parent into account. Thus Oslo was divided into four coherent regions where the population within the region had simi-lar socio-economic status, living standard and house structure. Ranking the social status of the four regions from low to high we have in ascending order inner East, outer East, inner West and outer West. However, the major dividing line concerning health status and health related behaviour is between East and West [7]. We there-fore decided on using two regions in our analyses – East and West (merging the two Eastern regions and the two Western regions) – because of the sample size and to sim-plify the presentation. Analyses based on four regions gave basically the same results.
Risk factors
Marital status obtained from the invitation file was dichotomised into currently married vs. the others. Height and weight were measured at the screening station. Infor-mation about other risk factors was obtained by question-naires. The participants were asked whether they were currently employed – and the answers were dichotomized into full time/part time vs. not employed. Total years of completed schooling/education were used as a continu-ous variable. The information about receiving disability pension (full/part) was dichotomized (yes or no). The question about weekly heavy physical activity (sweating and out of breath) in the spare time had four answer options, but was reduced to two – no activity vs. any activ-ity. Frequency of alcohol consumption had eight answer categories which were reduced to four. Smoking status was dichotomized, current smokers vs. former and never smokers. Since the continuous variable "years since men-opause" was highly correlated with age (r = 0.86), meno-pausal status was also dichotomized (before 50 years vs. 50 years and above) to avoid multicollinearity. Use of post-menopausal hormone therapy was categorised as current, former and never users. Information about present use of steroids (yes or no) was also obtained. In a sub-sample of the study population (359 women and 399 men 60 years and younger) we had information about physical activity at work, and in another sub-sample (506 women and 467 men) we had information about calcium intake from supplements and dairy products.
Ethics and approvals
All the participants of the Oslo Health Study have given their written signed consent. The Norwegian Data Inspec-torate has approved the Oslo Health Study, and it has been presented to the Regional Committee for Medical Research Ethics and conducted in full accordance with the World Medical Association Declaration of Helsinki.
Statistics
All analyses were performed separately for men and women. Comparisons of age specific figures between soci-oeconomic regions were done by t-test for continuous data and by chi-square test for categorical data. The age-adjusted figures were compared using variance analysis. Standard deviations (SD) were reported for crude means. For age-adjusted means 95% confidence intervals were shown.
Mean BMD, prevalence of low BMD and prevalence of osteoporosis were compared between the socioeconomic regions. Low BMD was defined as having a BMD of one standard deviation or more under the age- and sex-specific means (Z score ≤ -1) in this population sample. Oste-oporosis was defined as having a BMD of 2.5 standard deviations or more under the young female adult and young male adult means (T score ≤ -2.5). Participants aged 30–39 years in the Tromsø Health Study were used as a reference population [27]. Comparisons were done by chi-square tests. Logistic regression was employed to calculate the age-adjusted odds ratio of having low BMD and having osteoporosis.
Multiple regression analysis was used to study whether adjustment for other factors changed the association between BMD and socioeconomic region. The variables included in the regression models were age, marital status, level of education, employment status, received disability pension, body mass index, physical inactivity, use of alco-hol and smoking. Use of post-menopausal hormone ther-apy and early onset of menopause were also included in the regression model for women. Because of missing data on some of the questions, 538 men and 626 women were included in the regression analysis.
Results
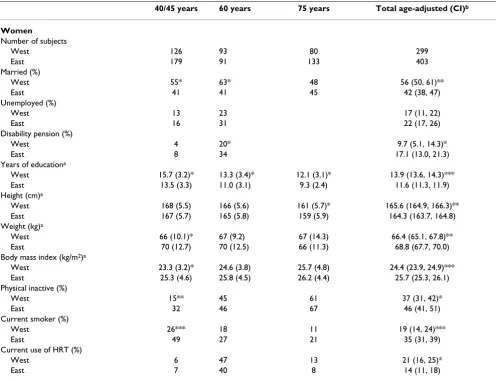
two regions in self-reported length of education in both genders – in favour of West. The inhabitants in the afflu-ent Western part were somewhat taller than those living in Eastern parts of the city. In women, but not in men, body mass index was lower in West than in East. The prevalence of physical inactive persons and current smokers were higher in East than in West. Current use of post-menopau-sal hormone therapy was most common in 60 years old women, and more frequent in West compared to East.
Socioeconomic region
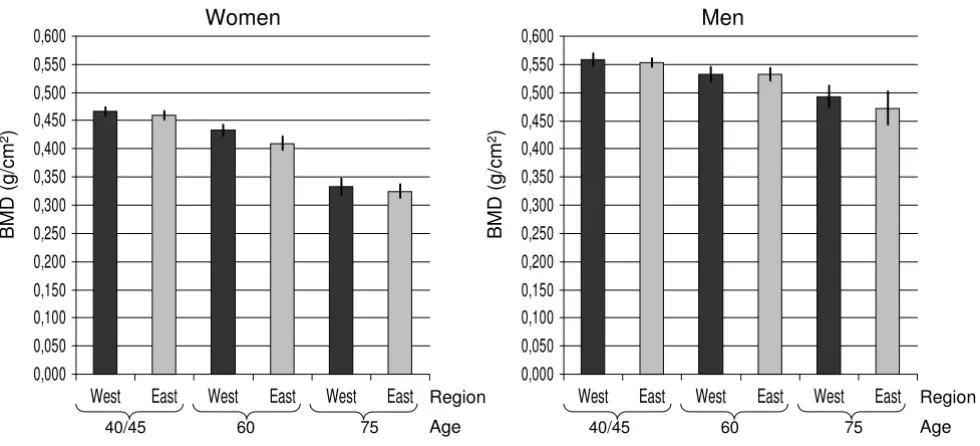
In women, age adjusted mean BMD was lower in Oslo East than in Oslo West (table 3). The same pattern was present in all the three age groups, but the East-West dif-ference was only statistically significant in women aged 60
years (figure 1). In men we observed the same tendency, but the differences were not statistically significant.
The age-adjusted prevalence of low BMD (Z-score ≤ -1 SD) was higher in Oslo East than in Oslo West in both gender, but only statistically significant in women (table 3). The age-adjusted odds ratio of low BMD in women living in Oslo East compared with living in Oslo West was 1.87 (95% CI: 1.22–2.87). The age-adjusted odds ratio for hav-ing osteoporosis (T-score ≤ -2.5 SD) was 1.12 (95% CI: 0.63–1.99) in men and 1.55 (95% CI: 0.94–2.54) in women. In women aged 60 the corresponding odds ratio for osteoporosis was 3.70 (95% CI: 1.16–11.84) (oste-oporosis figures are not shown in table).
Table 1: Characteristics of the study population – women. The osteoporosis sub-sample of the Oslo Health Study 2000–2001.
40/45 years 60 years 75 years Total age-adjusted (CI)b
Women
Number of subjects
West 126 93 80 299
East 179 91 133 403
Married (%)
West 55* 63* 48 56 (50, 61)**
East 41 41 45 42 (38, 47)
Unemployed (%)
West 13 23 17 (11, 22)
East 16 31 22 (17, 26)
Disability pension (%)
West 4 20* 9.7 (5.1, 14.3)*
East 8 34 17.1 (13.0, 21.3)
Years of educationa
West 15.7 (3.2)* 13.3 (3.4)* 12.1 (3.1)* 13.9 (13.6, 14.3)***
East 13.5 (3.3) 11.0 (3.1) 9.3 (2.4) 11.6 (11.3, 11.9)
Height (cm)a
West 168 (5.5) 166 (5.6) 161 (5.7)* 165.6 (164.9, 166.3)**
East 167 (5.7) 165 (5.8) 159 (5.9) 164.3 (163.7, 164.8)
Weight (kg)a
West 66 (10.1)* 67 (9.2) 67 (14.3) 66.4 (65.1, 67.8)**
East 70 (12.7) 70 (12.5) 66 (11.3) 68.8 (67.7, 70.0)
Body mass index (kg/m2)a
West 23.3 (3.2)* 24.6 (3.8) 25.7 (4.8) 24.4 (23.9, 24.9)***
East 25.3 (4.6) 25.8 (4.5) 26.2 (4.4) 25.7 (25.3, 26.1)
Physical inactive (%)
West 15** 45 61 37 (31, 42)*
East 32 46 67 46 (41, 51)
Current smoker (%)
West 26*** 18 11 19 (14, 24)***
East 49 27 21 35 (31, 39)
Current use of HRT (%)
West 6 47 13 21 (16, 25)*
East 7 40 8 14 (11, 18)
Oslo West is more privileged than Oslo East
*** p < 0.001, ** p < 0.005, *p < 0.05. Difference between West and East.
Adjusting for age and BMI in multiple regression analysis slightly increased the difference in mean BMD between Oslo East and Oslo West in women (table 4). Further adjustment for other known risk factors for BMD gave almost the same result as the solely age-adjusted figures.
Apart from socioeconomic region, age (β = -0.004, p < 0.001), body mass index (β = 0.003, p < 0.001) and cur-rent use of estrogens (β = 0.028, p < 0.001) were associ-ated with BMD in women. Adding employment and disability pension to the full model, thus excluding the
Table 2: Characteristics of the study population – men. The osteoporosis sub-sample of The Oslo Health Study 2000–2001.
40/45 years 60 years 75 years Total age-adjusted (CI)b
Men
Number of subjects
West 118 104 43 265
East 166 120 27 313
Married (%)
West 60* 75* 74 67 (62, 73)*
East 48 63 70 56 (51, 61)
Unemployed (%)
West 4* 16 10 (5, 14)*
East 12 20 16 (12, 20)
Disability pension (%)
West 2* 9* 4.5 (0.5, 8.4)***
East 7 24 14.0 (10.5, 17.5)
Years of educationa
West 16.0 (3.2)* 15.2 (3.6)* 15.5 (3.0)* 15.7 (15.2, 16.1)***
East 13.5 (3.5) 11.5 (3.7) 11.9 (3.6) 12.6 (12.1, 12.9)
Height (cm)a
West 183 (5.9)* 177 (6.1) 177 (6.2) 179.6 (178.8, 180.4)*
East 179 (6.7) 178 (7.1) 175 (10.0) 178.3 (177.6, 179.1)
Weight (kg)a
West 85 (12.8) 82 (10.9) 81 (10.3) 83.5 (81.9, 85.0)
East 85 (13.8) 84 (13.0) 78 (12.1) 83.8 (82.4, 85.2)
Body mass index (kg/m2)a
West 25.6 (3.4) 26.4 (3.2) 26.0 (3.3) 26.0 (25.6, 26.4)
East 26.4 (3.7) 26.7 (3.7) 25.8 (3.4) 26.5 (26.1, 26.9)
Physical inactive (%)
West 14* 25* 33 20 (15, 26)**
East 26 38 46 33 (28, 38)
Current smoker (%)
West 25* 17** 2** 19 (14, 24)***
East 40 37 26 37 (32, 42)
Oslo West is more privileged than Oslo East
*** p < 0.001, ** p < 0.005, *p < 0.05. Difference between West and East.
a Figures are means (SD) b CI – 95% confidence interval
Table 3: Mean distal BMD, prevalence and odds ratio of low BMD1 in Oslo West and Oslo East.
Region n Mean BMD (95% CI) Prevalence of low BMD (95% CI) Odds ratio of low BMD (95% CI)
Women
West 299 0.419* (0.412 – 0.425) 11.7* (7.5 – 15.9) ref
East 403 0.405 (0.400 – 0.410) 19.9 (16.3 – 23.5) 1.87 (1.22 – 2.87)*
Men
West 265 0.540 (0.534 – 0.547) 13.0 (8.7 – 17.3) ref
East 313 0.536 (0.530 – 0.542) 16.2 (12.2 – 20.1) 1.29 (0.81 – 2.07)
Oslo West is more privileged than Oslo East The figures are age-adjusted.
1 Low BMD is defined as z-score ≤ -1
oldest age-group, gave a statistically significant difference in mean BMD between East and West of 0.014 g/cm2 (data
not shown in table). Including physical activity at work for those 60 years and younger did not change the result notably.
In men we found no socioeconomic regional differences in BMD after controlling for marital status, level of educa-tion, body mass index, physical inactivity, use of alcohol and smoking in addition to age. Apart from age (β = -0.002, p < 0.001), being physically active (β = 0.012, p = 0.03) were the only covariate significantly associated with BMD in men. When adding employment status, disability pension and physical activity at work to the full model in men 60 years and younger, there was still no significant difference between East and West.
In a sub-sample we had information about calcium intake through dairy products and supplements [28]. Adding cal-cium in the regression model did not change the effect of
socioeconomic region on BMD in either gender – neither did controlling for use of steroids.
Discussion
We found lower BMD in women in the socioeconomic less affluent Oslo East compared to the more privileged Oslo West. In the age specific analysis the difference was only significant in women aged 60 years. In men the dif-ference was less pronounced and not statistically signifi-cant. The difference in BMD in women between the socioeconomic regions persisted after controlling for known risk factors. Individual differences in socio-demo-graphic and lifestyle factors did not explain the regional differences we found.
Socioeconomic region assign all persons living in the same geographical area to the same socioeconomic posi-tion independent of individual socioeconomic character-istics. Since the effect of socioeconomic region on BMD in women sustain after adjusting for years of education and
BMD in two sosioeconomic regions in Oslo Figure 1
BMD in two sosioeconomic regions in Oslo. The Oslo Health Study.
0,000 0,050 0,100 0,150 0,200 0,250 0,300 0,350 0,400 0,450 0,500 0,550 0,600
West East West East West East
Men
Region Age 0,000
0,050 0,100 0,150 0,200 0,250 0,300 0,350 0,400 0,450 0,500 0,550 0,600
West East West East West East
40/45 60 75
Women
Region Age
BMD (g
/cm
2)
BMD (g
/cm
2)
40/45 60 75
Table 4: Differences in BMD between Oslo West and Oslo East adjusted for age and other confounders.
BMD1 (95% CI) BMD2 (95% CI) BMD3 (95% CI)
Women (n = 626) 0.013 (0.004 – 0.021) 0.016(0.007 – 0.024) 0.012(0.003 – 0.021)
Men (n = 538) 0.004 (-0.006 – 0.014) 0.004 (-0.005 – 0.014) 0.003(-0.008 – 0.014)
Oslo West is more privileged than Oslo East
1Age-adjusted. This figure differ from that in table 3 because of uneven numbers included in the analysis 2Adjusted for age and body mass index.
3Adjusted for age, marital status, level of education, body mass index, physical inactivity, smoking status and use of alcohol. For women the model
other covariates, there are probably other factors associ-ated or influenced by socioeconomic region affecting BMD than those we have included in our model. Nutri-tional and neighbourhood factors are not controlled for, and common environmental factors (e.g. lead exposure) and water supply source are unexplored possible explana-tions.
From an individual perspective the socioeconomic differ-ences we found in BMD do not seem substantial – at least not compared to other health outcomes and risk factors such as cardiovascular disease and smoking. However, small differences in BMD between regions may have large impact on fracture incidence in the population. A differ-ence in BMD of e.g. 0.014 g/cm2 in women, which is the
difference in age-adjusted mean BMD between East and West, amount to about 1/4 SD. In a meta-analysis Mar-shall et. al showed that the relative risk for hip fracture in women was 1.8 per SD decrease in distal forearm BMD [29]. Roughly estimated a decrease of 1/4 SD in BMD may increase the risk of hip fracture by about 20%. In women it seems that the difference in BMD in our study concurs with the risk estimates from the hip fracture study in Oslo – 23% increased risk of hip fracture in women living in inner East compared with inner West [6]. In men the cor-responding fracture difference was 67%, which might sug-gest that other factors than BMD is of importance in explaining fracture risk differences between socioeco-nomic regions. However, these comparisons should be interpreted with caution since we cannot fully compare the regions in our study with those in the hip fracture study in Oslo.
Few published studies have focused on socioeconomic differences in BMD and some of them have obvious limi-tations as for example over-representation of well-edu-cated individuals [19,20] or comparison of groups of unequal ethnic composition [15]. An American study reported no association between BMD in the forearm and education in women above 65 years [30]. In another American study they found a positive education-BMD association in black, but not in white and Hispanic post-menopausal women. However, they found an income-BMD association in white, but after adjustments for behavioural factors, associations with education and income were eliminated [21]. Our results corresponds, however, to other studies which reported a relation between educational level and BMD in postmenopausal women [16,17,20], although a Chinese study reported education-BMD association in weight bearing sites only and not in the arms [17].
Socioeconomic differences in BMD in men are particu-larly scarcely explored, possibly reflecting their lower inci-dence of osteoporotic fractures. Elliot et al found highest
BMD in men from lower socio-economic groups [14]. In that study a larger percentage of those in the lower socio-economic groups were employed in manual labour, but that did not explain the differences they found. A negative association between education and hip BMD in old men was also found in an American study, but the effect of edu-cation was eliminated after adjustment for weight [31].
It should be noted that the socioeconomic distribution of risk factors for BMD might differ between different popu-lations. In the Italian study smoking were more common in those with high educational level [20] and in the Turk-ish study those in the lower socioeconomic group had lower alcohol intake and smoked less than the others [18]. The distribution of risk factors between socioeco-nomic groups may contribute to blur the effect of socioe-conomic position on BMD. A risk factor for many health conditions such as high body mass index, which is more prevalent in lower socioeconomic groups, is a protective factor for BMD. In our study, neither body mass index nor any of the other confounding factors added in the full multivariate model could explain the difference in BMD between the socioeconomic regions (table 4). Neither could educational level, which was one of the criteria for constructing the two regions. Further research is needed to investigate other factors influencing people's bone health in the different socioeconomic regions in Oslo.
The strength of this study is the population-based setting and the bone measurements in both men and women in the age-range 40–75 years. In addition we had informa-tion on the most important socio-demographic and life-style factors that is known to be associated with BMD. Further, the grouping of socioeconomic region was based on an index of social- and health-related indicators, which has previously been used to show large differences in mor-tality between Oslo West and Oslo East [7].
On the other hand, although the overall population size was large enough to detect differences in BMD of about 0.015 g/cm2 with power 80% and 5% significance level,
attend-ees and non-attendattend-ees and were found to be unbiased in Norwegian born individuals [22].
Another limitation of our study was that BMD was meas-ured at the forearm. The NORA study has, however, shown that peripheral measurements, including the fore-arm, have a strong relationship to later osteoporotic frac-ture [32]. Forearm SXA is also one of the most precise bone densitometric methods [33].
Conclusion
In conclusion, we found socioeconomic differences in BMD in women, but not in men. The differences between socioeconomic regions in women were not explained by education, lifestyle or the other recorded covariates.
Competing interests
The author(s) declare that they have no competing inter-ests.
Authors' contributions
KA carried out the data analyses and wrote the manu-script. AJS was the project manager of the Oslo Health Study. She also revised the manuscript and assisted in the data analyses. JAF contributed to interpretation of the data and revised the manuscript. HEM was responsible for the Osteoporosis sub study and contributed to the data anal-yses and writing process. All authors were involved in planning of the study, in the discussion of the methods and results, and all have read and approved the final man-uscript.
Acknowledgements
The data collection was conducted as part of the Oslo Health Study 2000– 2001 in collaboration with the National Health Screening Service of Nor-way – now the Norwegian Institute of Public Health. The Osteoporosis sub-study in the Oslo Health Study was funded by the Norwegian Research Council.
References
1. Falch JA: Epidemiology of fractures of the distal forearm in Oslo, Norway. Acta Orthop Scand 1983, 54:291-295.
2. Falch JA, Meyer HE: Osteoporose og brudd i Norge. Forekomst og risikofaktorer. (Osteoporosis and fractures in Norway. Occurrence and risk factors). Tidsskr Nor Laegeforen 1998, 118:568-572.
3. Lofthus CM, Osnes EK, Falch JA, Kaastad TS, Kristiansen IS, Nords-letten L, Stensvold I, Meyer HE: Epidemiology of hip fractures in Oslo, Norway. Bone 2001, 29:413-418.
4. O'Neill TW, Felsenberg D, Varlow J, Cooper C, Kanis JA, Silman AJ: The prevalence of vertebral deformity in European men and women: The European vertebral osteoporosis study. J Bone Miner Res 1996, 11:1010-1018.
5. Lunt M, Felsenberg D, Adams J, Benevolenskaya L, Cannata J, Dequeker J, Dodenhof C, Falch JA, Johnell O, Khaw KT, Masaryk P, Pols H, Poor G, Reid D, Scheidt-Nave C, Weber K, Silman AJ, Reeve J: Population-based geographic variations in DXA bone den-sity in Europe: the EVOS Study. European Vertebral Oste-oporosis. Osteoporos Int 1997, 7:175-189.
6. Kaastad TS, Meyer HE, Falch JA: Incidence of hip fracture in Oslo, Norway: differences within the city. Bone 1998, 22:175-178.
7. Rognerud M, Stensvold I: Oslohelsa. Utredning om helse, miljø og sosial ulikhet i bydelene. (The Oslo Health Report. Report about health, environment and social inequality in Oslo). Oslo, Norway, Centre of Preventive Medicine, Ullevål University Hospital; 1998.
8. Jørgensen T: Utdanningsnivået i Oslos bydeler: De fleste ulikheter består (Educational level in Oslo). Samfunnsspeilet, Statistics Norway 2005, 14:.
9. Kirkeberg MI: Fattigdom og inntektsfordeling: Oslo - flest fat-tige og størst ulikhet (Poverty and income distribution in Oslo). Samfunnsspeilet, Statistics Norway 2003, 17:53-58.
10. Bacon WE, Hadden WC: Occurrence of hip fractures and soci-oeconomic position. J Aging Health 2000, 12:193-203.
11. Jones S, Johansen A, Brennan J, Butler J, Lyons RA: The effect of socioeconomic deprivation on fracture incidence in the United Kingdom. Osteoporos Int 2004, 15:520-524.
12. Meyer HE, Henriksen C, Falch JA, Pedersen JI, Tverdal A: Risk fac-tors for hip fracture in a high incidence area: a case-control study from Oslo, Norway. Osteoporos Int 1995, 5:239-246. 13. Farahmand BY, Persson PG, Michaelsson K, Baron JA, Parker MG,
Ljunghall S: Socioeconomic status, marital status and hip frac-ture risk: a population-based case-control study. Osteoporos Int 2000, 11:803-808.
14. Elliot JR, Gilchrist NL, Wells JE: The effect of socioeconomic sta-tus on bone density in a male Caucasian population. Bone
1996, 18:371-373.
15. del Rio Barquero L, Baures MR, Segura JP, Quinquer JS, Majem LS, Ruiz PG, Navarro CL, Torne FMD: Bone mineral density in two different socio-economic population groups. Bone Miner 1992, 18:159-168.
16. Gur A, Sarac AJ, Nas K, Cevik R: The relationship between edu-cational level and bone mineral density in postmenopausal women. BMC Fam Pract 2004, 5:18.
17. Ho SC, Chen YM, Woo JL: Educational level and osteoporosis risk in postmenopausal Chinese women. Am J Epidemiol 2005, 161:680-690.
18. Inanici-Ersoz F, Gokce-Kutsal Y, Oncel S, Eryavuz M, Peker O, Ok S: A multicenter, case control study of risk factors for low tibial speed of sound among residents of urban areas in Turkey. Rheumatol Int 2002, 22:20-26.
19. Pearson D, Taylor R, Masud T: The relationship between social deprivation, osteoporosis, and falls. Osteoporos Int 2004, 15:132-138.
20. Varenna M, Binelli L, Zucchi F, Ghiringhelli D, Gallazzi M, Sinigaglia L: Prevalence of osteoporosis by educational level in a cohort of postmenopausal women. Osteoporos Int 1999, 9:236-241. 21. Wang MC, Dixon LB: Socioeconomic influences on bone health
in postmenopausal women: findings from NHANES III, 1988-1994. Osteoporos Int 2006, 17:91-98.
22. Sogaard AJ, Selmer R, Bjertness E, Thelle D: The Oslo Health Study: The impact of self-selection in a large, population-based survey. Int J Equity Health 2004, 3:3.
23. Leren P, Askevold EM, Foss OP, Froili A, Grymyr D, Helgeland A, Hjermann I, Holme I, Lund-Larsen PG, Norum KR: The Oslo study. Cardiovascular disease in middle-aged and young Oslo men. Acta Med Scand Suppl 1975, 588:1-38.
24. Meyer HE, Berntsen GK, Sogaard AJ, Langhammer A, Schei B, Fon-nebo V, Forsmo S, Tell GS: Higher bone mineral density in rural compared with urban dwellers: the NOREPOS study. Am J Epidemiol 2004, 160:1039-1046.
25. Berntsen GK: Interpretation of forearm bone mineral density. The Tromsø Study. Thesis. Institute of Community Medicine, Uni-versity of Tromsø, Norway 2000.
26. Berntsen GK, Tollan A, Magnus JH, Sogaard AJ, Ringberg T, Fonnebo V: The Tromso Study: artifacts in forearm bone densitome-try--prevalence and effect. Osteoporos Int 1999, 10:425-432. 27. Berntsen GK, Fonnebo V, Tollan A, Sogaard AJ, Magnus JH: Forearm
bone mineral density by age in 7,620 men and women: the Tromso study, a population-based study. Am J Epidemiol 2001, 153:465-473.
Publish with BioMed Central and every scientist can read your work free of charge "BioMed Central will be the most significant development for disseminating the results of biomedical researc h in our lifetime."
Sir Paul Nurse, Cancer Research UK
Your research papers will be:
available free of charge to the entire biomedical community
peer reviewed and published immediately upon acceptance
cited in PubMed and archived on PubMed Central
yours — you keep the copyright
Submit your manuscript here:
http://www.biomedcentral.com/info/publishing_adv.asp
BioMedcentral
29. Marshall D, Johnell O, Wedel H: Meta-analysis of how well meas-ures of bone mineral density predict occurrence of oste-oporotic fractures. BMJ 1996, 312:1254-1259.
30. Bauer DC, Browner WS, Cauley JA, Orwoll ES, Scott JC, Black DM, Tao JL, Cummings SR: Factors associated with appendicular bone mass in older women. The Study of Osteoporotic Frac-tures Research Group. Ann Intern Med 1993, 118:657-665. 31. Cauley JA, Fullman RL, Stone KL, Zmuda JM, Bauer DC,
Barrett-Con-nor E, Ensrud K, Lau EM, Orwoll ES: Factors associated with the lumbar spine and proximal femur bone mineral density in older men. Osteoporos Int 2005, 16:1525-1537.
32. Siris ES, Miller PD, Barrett-Connor E, Faulkner KG, Wehren LE, Abbott TA, Berger ML, Santora AC, Sherwood LM: Identification and fracture outcomes of undiagnosed low bone mineral density in postmenopausal women: results from the National Osteoporosis Risk Assessment. JAMA 2001, 286:2815-2822.