R e s e a r c h in H i g h e r E d u c a ti o n , 1 0 ( 1). p p . 2 0 3-2 1 6 .
Do w n l o a d e d fr o m : h t t p ://i n si g h t . c u m b r i a . a c . u k /i d/ e p ri n t/ 2 5 0 9 /
U s a g e o f a n y i t e m s f r o m t h e U n i v e r s i t y o f C u m b r i a’ s i n s t i t u t i o n a l r e p o s i t o r y ‘I n s i g h t ’ m u s t c o n f o r m t o t h e f o l l o w i n g f a i r u s a g e g u i d e l i n e s .
Any it e m a n d it s a s s o ci a t e d m e t a d a t a h el d i n t h e U niv e r si ty of C u m b r i a ’s in s ti t u ti o n al r e p o si t o r y I n si g h t ( u nl e s s s t a t e d o t h e r wi s e o n t h e m e t a d a t a r e c o r d ) m a y b e c o pi e d , di s pl ay e d o r p e rf o r m e d , a n d s t o r e d i n li n e wi t h t h e JIS C f ai r d e a li n g g ui d eli n e s ( av ail a bl e h e r e) fo r e d u c a t i o n al a n d n o t-fo r-p r ofi t a c tiviti e s
p r o v i d e d t h a t
• t h e a u t h o r s , ti tl e a n d full bi blio g r a p h i c d e t ail s of t h e it e m a r e ci t e d cl e a rly w h e n a n y p a r t
of t h e w o r k is r ef e r r e d t o v e r b a lly o r i n t h e w ri t t e n fo r m
• a h y p e rli n k/ U RL t o t h e o ri gi n al I n si g h t r e c o r d of t h a t it e m is i n cl u d e d i n a n y ci t a ti o n s of t h e w o r k
• t h e c o n t e n t is n o t c h a n g e d i n a n y w a y
• all fil e s r e q ui r e d fo r u s a g e of t h e it e m a r e k e p t t o g e t h e r wi t h t h e m a i n it e m fil e.
Yo u m a y n o t
• s ell a n y p a r t of a n it e m
• r e f e r t o a n y p a r t of a n it e m wi t h o u t ci t a ti o n
• a m e n d a n y it e m o r c o n t e x t u ali s e it i n a w a y t h a t will i m p u g n t h e c r e a t o r ’s r e p u t a t i o n
• r e m ov e o r a l t e r t h e c o py ri g h t s t a t e m e n t o n a n it e m .
T h e full p oli cy c a n b e fo u n d h e r e.
Citation
McManus, R. (2016) ‘Assessment timing: student preferences and its impact on performance’, Practitioner Research in Higher Education Journal, 10(1), pp. 203-216.
203 Assessment timing: student preferences
and its impact on performance
Practitioner Research in Higher Education Special Assessment Issue Copyright © 2016 University of Cumbria Vol 10(1) pages 203-216 Richard McManus
Canterbury Christ Church University [email protected]
Abstract
Students on a first year undergraduate economics module were given the choice of when to sit their first assessment in the subject in order to determine both preferences over assessment timing, and the impact of timing on performance. Clear preferences of having this option were shown (only 2% of students stated to be indifferent) with those more comfortable and
engaged in the module electing to take an earlier sitting of the assessment. Those who took the early test performed better on average compared to those who took it later, however, after controlling for attendance, there was no statistical link. There was, however, evidence that a later first assessment caused lower attendance and moreover, evidence of a legacy effect of this timing where the out-performance of the early cohort grew over later tests, which all students took at the same time.
Keywords
Student preferences; assessment timing; attainment.
Introduction
The impact of assessment on student learning, performance and engagement is widely known and has been studied extensively: see for example Lemanski (2011). This has led to a small but growing literature on students’ preferences with respect to assessment design and how these relate to performance. A preference towards multiple-choice questions has been observed (see for example Ben-Chaim and Zoller, 1997) especially in male students (Gellman and Berkowitz, 1993), those students who are more anxious of assessments (Birenbaum, 2007), and for surface learners (Birenbaum and Feldman, 1998). These preferences are believed to result from a perception that such questions are easier to prepare for (Zoller and Ben-Chaim, 1989) and to receive a higher mark (Traub and MacRury, 1990). Females and those students with deeper learning styles, on the other hand, tend to prefer opened-ended questions and coursework (Furnham et al., 2008), and in general a majority of students prefer to negotiate coursework assignments over prescriptive questions (Williams, 1992). When assessments are aligned with the preferences of students, performance is shown to improve (Scouller, 1998) and anxiety lowered (Birenbaum, 2007).
204 commit to their decision and there was no incentive not to provide their preferred option. From these decisions, preferences on the timing of assessments can be tested against socio-economic backgrounds and academic variables. Moreover, the importance of the timing of assessments for attainment can be explored through examining the results from the test, and all future assessments.
Related literature
Similar concepts of students’ engagement in assessment timing were investigated in Ariely and Wertenbroch (2002) who offered a proportion of students on an executive-education course the option to set self-imposed deadlines for three essays which were declared and binding: if no deadline was selected the default was the final day of the course; if a deadline was chosen and not upheld, penalties were applied. Those students who self-imposed deadlines
outperformed those who did not. However, they did not outperform those students on whom three evenly spaced deadlines were enforced. A preference towards assessment spacing was present, however, students felt the need to impose constraint upon themselves, rather than working at their own pace and independently completing assignments early (without a potentially costly deadline). Moreover, a link was demonstrated between assessment timing and performance, suggesting early and spaced tests was, on average, optimal. These results reconcile with the literature on the testing and spacing effects which suggests that frequent and spaced tests, as opposed to more study, improve student outcomes (see for example Carpenter et al., 2012).
Ariely and Wertenbroch (2002), therefore, imply two competing potential preferences of students over assessment timing: potential procrastination suggests a desire for students to want to postpone tests; whereas conscientious students may select an early assessment which provides a pre-commitment mechanism to ensure that this procrastination is not done to the detriment of their grade. Further, some students may not wish to postpone assessment in the fear that some content might be forgotten, whereas others may hope that continued
education in the area may provide them with more overall knowledge in the module. This is perhaps more heightened when the students in this study are first year undergraduates who have less direct experience to reflect upon when making this decision.
Carpenter et al. (2012) suggest that more spaced assessments are advisable. However, the ability to take more time to understand higher education assessment may be beneficial to some students. Moreover, it seems logical that given the opportunity to select assessment timing provides students the option to optimise their study time for own specific
circumstances, as opposed to all having an enforced uniform date.
Therefore in neither the preference over assessment timing nor the associated performance of students can clear hypotheses be generated from either the literature or through intuition. The next section discusses the methodology to be applied given these circumstances.
Experiment design and methodology
Students on a first year compulsory economics module were offered the option between taking their first assessment, worth 20% of their final grade, during either the second or penultimate week of the second term of teaching (a time separation of 8 weeks).1 The
1 These dates were chosen for ease of administration and also to ensure that the assessment
205 assessment was based on material covered in the first term, and took the form of a 45 minute in-class test including questions based on short answers, mathematical computation, diagram drawing, and multiple-choice questions. Students were also permitted to declare that they had no preference, and under this scenario it was communicated that they would be randomly allocated (with equal probability) between the two dates, for two reasons: first, students might not have a preference; and second, if sufficient numbers chose this option, the random allocation would provide a controlled experiment on the relationship between assessment timing and performance.
Prior to the choice being made, it was communicated to students that each test paper would be unique, that all examinations would be of equal complexity, and that there would be full transparency with respect to the style and general content of the assessment; this was done in order to ensure that there would be no ‘knowledge-advantage’ from taking the later test.2 Students were also informed that the decision was binding such that were they to select the early test and not attend, they would be awarded zero; this was to ensure that the options selected by the students truly reflected their preferences and that there were no incentives not to reveal these. The choice was given to the students during the mid-point of the first term with a five-week window for them to communicate their preference either verbally, through email, or through completing a short task (in the form of an online survey) on the virtual learning environment; the majority of students (92%) took this latter option. A total of 263 students were enrolled onto the module.
This choice was discussed frequently in lecture and seminars, as well as in email communication, to ensure that students were fully informed of both the process and implications of their decision making; there was no evidence of students not understanding the choice, and the amount of clarification questions were limited. Within these discussions students highlighted two conflicting desires: some students wished to ‘get the assessment out of the way’ and did not want to forget the content over an extended period3; others expressed the wish to learn economic concepts more broadly and felt that more time to reflect on content would be beneficial. After all decisions were submitted, each student was emailed to remind them of their choice and to offer them the option to change their mind; ten students changed their initial decision given this option, whereas eleven students changed their mind during the decision window.4
From these choices, preferences (or a lack thereof) on the timing of assessments are revealed and these can be compared against socio-demographic and academic characteristics to determine if there is any link between these through the use of 𝜒2 tests and Logit regression.
Once assessments were taken, the link between performance and timing for both the first and subsequent assessments can be discerned through two methods: first, through the controlled
communicated to the students prior to the choice being made, and was set for after the Easter vacation, seven weeks after the time of the later sitting of the first assessment. 2 This was ensured by selecting questions randomly from separate pools, and this process was
communicated to the students.
3 Many revision exercises were available for the students independent of when they sat the
test in order to aid preparation and memory.
4 Those who changed their mind were equally distributed between those who initially chose
206 experiment possible by randomising those students without preferences; and second, through regression analysis which controls for student ability, as well as other important
characteristics. Furthermore, the importance of the timing of the first tests on future grades can be observed; two further assessments in the module were taken by all students at the same time, and the results from these can provide important insights. Finally, to gauge perspectives of this choice and its implications after the event, a small survey was performed at the end of the academic year asking students about the experience, whether they believe it improved their grade, and whether they regretted their choice.5
Revealed preferences of assessment timing
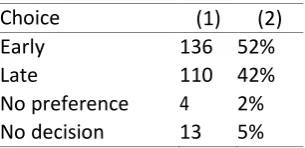
For the rest of the paper analysis is presented first into the preferences of students on assessment timing before subsequently going on to investigate the impact of timing on performance. Table 1 presents the choices made for the three separate timing options (as well as those who made no decision) and demonstrates that students have a clear preference to choosing the date of their assessment. The majority of students made a clear decision with 52% electing to take the assessment early and 42% late. Only 2% of students stated that they were indifferent between the two proposed dates and a small minority made no choice at all.
Table 1. Student choices on their assessment timing.
Choice (1) (2)
Early 136 52%
Late 110 42%
No preference 4 2%
No decision 13 5%
Table note: Choices over assessment timing where the first column represents the choice made, column (1) represents absolute student numbers making that choice, and column (2) represents these as a percentage of the total.
Figure 1 illustrates that in an end-of-year survey 95% of students stated that they either agreed or strongly agreed with the statement ‘I liked having this option’, including all of those students taking the later test. This number reconciles with 10% of students who agreed or strongly agreed with the statement ‘I wish we were told when to take it’. Moreover, only 5% of students when asked showed some regret, either agreeing or strongly agreeing to the
statement ‘I wish I had made the other choice’.
207 Figure 1. Survey results on the option of assessment timing.
Figure note: Results from a survey conducted by 88 students answering questions on a ‘Likert’ scale, with respect to having the choice of when to sit the first assessment. The analysis separates between those students who took the ‘Early’ and ‘Late’ sitting of the test respectively, and the questions asked are along the x-axis.
Comparing these preferences with academic and socio-economic characteristics, there is evidence to suggest that it is those students who were more comfortable and engaged with the module who chose to take the assessment early. For example, 86% (compared with 55% overall; p = 0.002) and 76% (p = 0.007) of those students who had some prior post compulsory academic experience of economics and mathematics, respectively, took the earlier test (numbers in parentheses represent associated p-values from a 𝜒2 test).6 The attendance of those students who took the earlier test was 79% (p < 0.001) compared with 63% of those who took the later option, and the participation in the virtual learning environment was nearly 50% (p < 0.001) higher in those students who took the earlier test (both prior to the decision being offered). Other significant predictors of an earlier preference were those students who had previously taken A-Levels, as opposed to other qualifications7 (61% of whom took the earlier test, p = 0.056) and the ethnicity of the student, with minority ethnic students choosing the early date only 35% of the time (p < 0.001).
Those who took the earlier test tended to opt for this sooner when given the option. This is demonstrated in Figure 2 showing the timing of decisions; as time progresses, the proportion of students electing to take the assessment early falls. This illustrates that either students were engaged with the module, in order to participate in this decision early (and not require
additional prompts), or, that the students were comfortable enough in the content of the module that they could commit to an earlier decision.
6 Although not mathematical in nature, the practical application of economics often uses
mathematical procedures. Only 11% of the marks were given for a straight-forward numerical question on the test, with a subsequent 22% on offer if students chose to take another maths-based question over the option of a short-answer-based question. 7 A-Levels are a pre-university qualification in the United Kingdom; however, there are other
208 Figure 2. Choices made over time.
Figure note: Results obtained in the left hand pane by taking a rolling average of the last 20 decisions chronologically, where choosing to take the test early was assigned 1, and taking the test late assigned zero, and in the right hand pane through taking an accumulative average of these results. Each vertical line represents a week in time and demonstrates how many decisions were made each week.
These results are confirmed when performing a Logit regression estimating the specific student characteristics which increase the probability of opting for an early assessment; presented in Table 2. This Logit analysis is performed to find the marginal impact of the separate factors, holding all other characteristics constant, therefore controlling for these other factors. Those students who demonstrated engagement through attendance (measured as the count of both lectures and seminars attended) and the use of online resources
(measured through participation in the virtual learning environment), and those who had prior experience of post-compulsory education in economics and mathematics preferred to take the earlier test; those from an ethnic minority (measured through demographic data from
209 Table 2. Logit regression predicting student choices.
Independent variable (1) (2)
Attendance 0.235*** (0.000)
VLE 2.232*** (0.022)
Economics 1.233* (0.072)
Mathematics 0.945* (0.053)
Ethnic minority -1.000*** (0.005)
Pseudo-𝑅2 0.170 n=239
Table note: Results obtained from a Logit regression where the dependent variable takes the value 1 if the student chose the early test, and zero if the student chose the late one; this analysis identifies specific characteristics which would predict student choice, holding all other factors fixed. The independent variables are listed in the first column: ‘Attendance’ relates to the count of lectures and seminars attended, out of a possible 10, prior to the choice being offered; ‘VLE’ a measure of engagement in the virtual learning environment, measured through the number of pages visited on separate occasions, normalised to 1 by dividing through by the highest number for this variable; ‘Economics’ and ‘Mathematics’ are dummy variables taking the value of 1 if the student has prior experience of post-compulsory education in either subject respectively, and zero otherwise; and the variable ‘Ethnic minority’ takes the value 1 if the student gave an answer other than ‘white’ in ethnicity forms, zero otherwise. The values in column (1) represent estimated coefficients and in column (2) p-values of significance for these individual independent variables: a standard star convention is applied; *** signifies that the variable is statistically significant to 99% confidence, ** to 95% and * to 90%.
Although certain characteristics do predict when a student may choose to take the test, they do so with only a small degree of accuracy, with a pseudo-R2 statistic of 0.170 suggesting that only approximately 17% of the variation in the choice is explained. This result reconciles with that of Furnham et al. (2008) who perform a similar study on students’ preferences over assessment style where although strong correlates are observed, they only explained less than 10% of the overall variation in preferences.
This suggests, therefore, that although students do like to have the choice of when to take the test, and although those who are more comfortable and engaged with the content opt for an earlier assessment on average, the decision is still a personal one. That is to say, the
observable characteristics of students explain only so much of their decision, and other unobservable factors influence their choice. It is also significant to note that it is the academic characteristics of students, and not the socio-economic ones, which tend to predict their behaviour.8
Timing of assessment and performance
The analysis now considers the impact of assessment timing on attainment. First, performance in the specific assessment for which the timing option was offered is investigated, and then subsequently attainment in all other assessments is considered.
Performance on the first assessment
As stated above there are two methods in which to test whether there is a causal link between
8 Other variables tested but found not to give significant results with respect to assessment
210 the timing of the first assessment and performance: either through a controlled experiment conducted on those randomly assigned students who had no preference with respect to assessment time; or, through regression analysis. As highlighted in Table 1, only four students stated to have no preference over assessment time which provides insufficient data for the former, and therefore the latter is applied. The issue with regression analysis is that the timing of the test needs to be isolated from other important factors which affect assessment
performance; for example, analysis above highlights that those students with poorer attendance and lower overall engagement in the module were more likely to take the later test. This would naturally suggest that those taking the later test would get a lower score, independent of the timing of the test. Therefore, a robust methodology that controls for these factors is required.
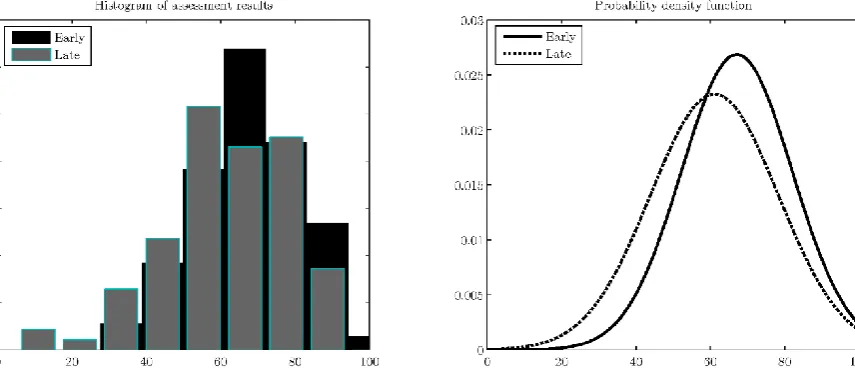
Figure 3. Distribution of marks from the two cohorts.
Figure note: The left hand pane represents a histogram of assessment results from the two cohorts: ‘Early’ represents those taking it early and ‘Late’ represents those taking it later. The right hand pane shows a probability density function of marks imposing a normal distribution on the two cohorts.
Figure 3 presents the distribution of marks from the two sittings of the test both through histograms (the left-hand panel) and through enforcing a normal distribution on the data (the right-hand panel). Those taking the test later received on average six percentage points fewer (9% in relative terms) than those taking the earlier test. Table 3 presents ordinary least squares regression results on assessment performance where column (1), which regresses assessment performance against the time taken with no other control variables, illustrates that this difference is highly significant, with an associated p-value of less than 0.01. However, column (2) suggests that once controlling for other factors, in particular qualifications on entry, this relationship diminishes and is no longer statistically significant (with a p-value higher than 0.1). When further control variables of attendance and engagement are included, in column (3), the marginal impact of time is completely removed.
211 Table 3. This implies that when at university, it is a student’s conduct there and not their past performance which is most important.
Table 3. The effect of assessment timing on performance.
(1) (2) (3)
Early 5.808*** 2.984 0.848
(0.005) (0.167) (0.702)
QOE 14.438* 9.476
(0.072) (0.238)
Attendance 0.497**
(0.034)
VLE 11.126*
(0.078)
Other controls No Yes Yes
𝑅2 0.035 0.175 0.253
n 222 183 181
Table note: Results obtained from OLS regression where the dependent variable is the percentage grade in the assessment; this analysis identifies if the time when the assessment was taken impacts
performance, controlling for other factors. Columns (1) to (3) represent different estimations of the same regression, where progressively more variables are included in the analysis. The independent variables are listed in the first column: ‘Early’ is a variable taking the value 1 if the student chose to take the examination early, and zero if they chose to take it late; ‘QOE’ is a variable representing
qualifications on entry using the UCAS tariff system, normalised to 1 by dividing through by the highest value; ‘Attendance’ a count of the 22 possible lectures/seminars the students could have attended on the material; ‘VLE’ is discussed in Table 2; and ‘Other controls’ includes other control variables found to be significant using a general-to-specific identification process, and not presented for brevity. These variables include: whether the student is male; whether the student declared themselves to be ‘white’; and whether the student had prior academic experience of economics and (post compulsory)
mathematics, separately. All of these variables contribute positively to the assessment mark. A standard star convention is applied as in Table 2, where figures in parenthesis represent p-values, and those numbers outside of parentheses coefficient estimates.
The natural question from this analysis is what is the direction of causality? Does a later assessment lead to lower attendance, or, do those students who attend less choose the later assessment date? The discussion above demonstrated that it was those students who were less engaged in the module who were more likely to take the later test. However, it is
important to determine whether levels of engagement became worse after knowing that they had more time before being assessed.
Table 4 presents analysis on student attendance, both before and after the decision on when the timing option was offered. In both time horizons the attendance of those taking the earlier assessment was greater than those taking the later assessment (the final row reports positive differences throughout), however, for the latter attendance significantly fell after the option was offered; attendance rates dropped from 63% to 54%, a statistically significant fall (with an associated p-value of 0.017).9 This drop in attendance relative to their peers persisted into the
9 Analysis was also performed tracking attendance of students over the same time horizon in a
212 second term of teaching. The data suggests therefore of a causal link between taking the later test and performing worse, but only through the channel of attendance; if this can be
maintained then there does not appear to be a statistically significant relationship. This analysis also suggests that assessments can be used as a method to incentivise students to engage in learning, which is suggested in Brown and Race (2003).
Table 4. Assessment timing and attendance.
Term 1
Term 2
Start End
Early 82% 79% 58%
Late 63% 54% 35%
Difference 23% 32% 41%
Table note: Attendance rate as a proportion of total possible attendance presented by timing of first assessment and by term; this is performed to investigate if the choice taken of when to sit the first assessment impacted on attendance. Attendance in term 1 is split between the ‘Start’ and ‘End’ which represents the time before and after the option of when to take the test was presented, respectively. ‘Difference’ represents the difference in attendance between those taking the early and later tests in relative terms.
Performance in future assessments
Although the timing of the assessment has been shown not to have a causal impact on student results after controlling for attendance, it may have an impact beyond this initial test into other assessments performed. In all there were three assessments in the module: the first for which the timing was optional and discussed above; a second which was similar in nature and weighting as the first but which covered material from the second term (taken either 15 or 7 weeks after the first assessment, depending on when the first assessment was taken); and a final examination contributing 60% towards the overall grade and covering mainly short-essay questions (taken 4 weeks after the second assessment for all students).
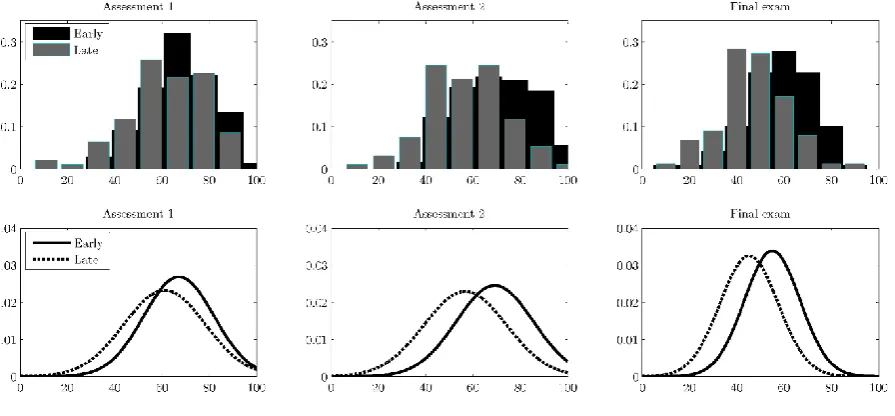
213 Figure 4. Distribution of marks from the two cohorts in all assessments.
Figure note: The top row represents a histogram of assessment results from the two cohorts: ‘Early’ represents those taking the first assessment in the first sitting, and ‘Late’ represents those taking it in the later sitting. The bottom row shows a probability density function of marks after imposing a normal distribution on the two cohorts, presented in chronological order of when the assessment was taken. Note that ‘Assessment 2’ and the ‘Final exam’ were taken at the same time by all students.
Figure 4 presents the distribution of marks for all three assessments across the two cohorts of students. In all three assessments the early-cohort outperformed the later one and this was most pronounced in the assessments which were taken at the same time; Table 5 presents regression results predicting the impact of the timing of the first assessment, and when other factors are not controlled for (columns (1), (3) and (5)), the difference in the results across the two cohorts in the second and third assessments are 12 and 11 percentage points respectively. This difference is larger than in the first assessment (6 percentage points: column (1)) and remains statistically significant after controlling for other factors such as attendance and engagement; those who took the first assessment earlier were estimated to outperform those who took it later by 5 and 4 percentage points (columns (4) and (6)) respectively in the two further assessments. This implies that although the timing of the first assessment does not play a significant role in the performance in the first assessment, it does for future
assessments.
214
Assessment 1 Assessment 2 Assessment 3
(1) (2) (3) (4) (5) (6)
Early 5.808*** 0.848 12.482*** 4.810** 10.646*** 4.076**
(0.005) (0.702) (0.000) (0.042) (0.000) (0.044)
Other controls No Yes No Yes No Yes
𝑅2 0.035 0.253 0.121 0.353 0.133 0.309
n 222 181 216 197 207 191
Table note: Results obtained from OLS regression where the dependent variable is the percentage grade in the specific assessments, going in chronological order from left to right. This analysis is similar to that present in Table 3, but for all assessments. For each assessment, the first column (columns (1), (3) and (5)) estimates the impact of taking the first test early on the grade achieved, independent of other factors; whereas the second column for each assessment (columns (2), (4) and (6)) estimates the same impact whilst controlling for other factors. The independent variables are listed in the first column: ‘Early’ represents a variable taking the value of 1 if the first assessment was taken early and zero if taken late; ‘Other controls’ represents whether or not the regression specification included other control variables, selected for each specific assessment using a general-to-specific approach. Numbers in parenthesis represent p-values of tests of individual significance, and those numbers outside of parenthesis individual coefficients estimates. The star convention is the same as in Table 2.
One interpretation is that these students required more spacing between assessments and that were the timing changed for all tests, maintaining a consistent frequency for all students, these differences might not have been observed; this reconciles with Carpenter et al. (2012). Through postponing the first test students were able to elongate the period before they were first required to engage with the module, hindering their progress.
A second possible explanation is that the two latter assessments represent a benchmark with which to compare the results of the first. Therefore, when offered the choice of when to perform the assessment those students who require additional preparation time perform relatively better compared to those who do not as a result of being given this choice. That is to say, the performance of the later-cohort would have been even worse in the first test had they not been given the option of time, and if an early test was enforced upon them; this reconciles with the survey results from Figure 1 where 73% of the later-cohort stated they believed having the option improved their grade. This interpretation also reconciles with Scouller (1998) which demonstrates that when assessment preferences are matched with actual methods, results improve.
These competing explanations provide divergent interpretations from this experiment: on the one hand, providing choice over assessment timing is bad for student outcomes and there should be an imposition of equally spaced tests; on the other, providing choice allows students to allocate according to their needs and improve performance. This latter interpretation is coherent with the argument which suggests that student engagement is enhanced with more self-regulation: see for example Cassidy (2011). Moreover, Coutts et al. (2011) demonstrate that self-determined approaches to assessment enhance student wellbeing.
Conclusions
later-215 cohort was lower because they took the later test. The biggest impact on performance is on later assessments, where earlier tests seem to elicit stronger performance of students over the lifetime of the module.
In a higher education environment which focuses increasingly on student satisfaction and attainment, further research into the implications of offering assessment timing choices is warranted. Although there is evidence from this paper to tentatively support this process, further research will provide more detailed analyses. First, research providing a more robust conclusion on whether delayed testing leads to poorer performance later in the module by students is of value; although there is no causal link between timing and attainment in the assessment which timing was optional in this paper, evidence is less clear for future
performance. Second, even if there is a causal relationship between timing and performance, understanding for who this is most pertinent to, and if for others the relationship can operate in the other direction, is also important. For example, results above suggest that were
attendance to be maintained across cohorts, students are no worse off through being offered more flexibility. Finally, greater understanding into the mechanism of the relationship between choice, commitment and performance will allow for more nuanced assessment strategies for an increasingly diverse student population.
References
Ariely, D. and Wertenbroch, K. (2002) Procrastination, deadlines, and performance: Self-control by precommitment, Psychological Science, 13(3): 219–224.
Ben-Chaim, D. and Zoller, U. (1997) Examination-type preferences of secondary school students and their teachers in the science disciplines, Instructional Science, 25(5): 347– 367.
Birenbaum, M. (2007) Assessment and instruction preferences and their relationship with test anxiety and learning strategies, Higher Education, 53(6): 749–768.
Birenbaum, M. and Feldman, R. A. (1998) Relationships between learning patterns and attitudes towards two assessment formats, Educational Research, 40(1): 90–98. Brown, S. and Race, P. (2003) Lecturing: a Practical Guide. London: Routledge.
Carpenter, S. K., Cepeda, N. J., v, D., Rohrer, S. H., K., and Pashler, H. (2012) Using Spacing to Enhance Diverse Forms of Learning: Review of Recent Research and Implications for Instruction, Educational Psychology Review, 24(3): 369-378.
Cassidy, S. (2011) Self-regulated learning in higher education: Identifying key component processes, Studies in Higher Education, 36(8): 989–1000.
Coutts, R., Gilleard, W. and Baglin, R. (2011) Evidence for the impact of assessment on mood and motivation in first-year students, Studies in Higher Education, 36(3): 291–300. Furnham, A., Christopher, A., Garwood, J. and Martin, N. G. (2008) Ability, demography,
learning style, and personality trait correlates of student preference for assessment method, Educational Psychology, 28(1): 15–27.
Gellman, E. S. and Berkowitz, M. (1993) Test-item type: What students prefer and why, College Student Journal, 27(1): 17–26.
Lemanski, C. (2011) Access and assessment? Incentives for independent study, Assessment & Evaluation in Higher Education, 36(5): 565-581.
Scouller, K. (1998) The influence of assessment method on students’ learning approaches: Multiple choice question examination versus assignment essay, Higher Education, 35(4): 453–472.
Traub, R. E. and MacRury, K. A. (1990) Multiple-choice vs. free-response in the testing of scholastic achievement, Ontario Institute for Studies in Education.
216 Zoller, U. and Ben-Chaim, D. (1989) Interaction between examination type, anxiety state, and