http://www.sciencepublishinggroup.com/j/ijber doi: 10.11648/j.ijber.20190806.27
ISSN: 2328-7543 (Print); ISSN: 2328-756X (Online)
The Impact of Economic Freedom on Economic Growth
Fayrouz Al–Katout
1, *, Amir Bakir
21
Insurance Directorate, School of Business, University of Jordan, Amman, Jordan
2
Department of Business Economics, School of Business, University of Jordan, Amman, Jordan
Email address:
*
Corresponding author
To cite this article:
Fayrouz Al–Katout, Amir Bakir. The Impact of Economic Freedom on Economic Growth. International Journal of Business and Economics Research. Vol. 8, No. 6, 2019, pp. 469-477. doi: 10.11648/j.ijber.20190806.27
Received: November 14, 2019; Accepted: December 12, 2019; Published: December 24, 2019
Abstract:
This study investigated the relationship between economic growth and economic freedom. Fourty two countries were covered for the period 1996- 2017. The dependent variable is the real GDP per capita and the independent variables are; the index of economic freedom, real fixed capital formation, real government spending and average number of hours worked. The sources of data is the World Bank Group (WBG) and the Center for Growth and Development (GGDC). The sample of 42 countries was divided into two groups, based on the score of the country on the index of economic freedom for 2017. While the economic freedom index, which ranges from 100 to 70, has 13 countries. The second group having 69.9 to 50 points, consisted of 29 countries. The data was subjected to cross sectional panel analysis; the unit root indicated that all variables in the two groups were stable at the level, and The Pedroni Residual Co-integration Test showed that there was no co-integration between the variables. The normal least squares method was applied for each group of countries. The results of the analysis showed that the fixed effects model (Fixed Effect) was the appropriate model for data analysis. The study showed that there was a positive and statistically significant relationship between the economic freedom index and the real GDP per capita. In addition, the relationship was positive and statistically significant between real GDP per capita, and both fixed capital formation and government expenditure. The study recommended that more attention should be directed to the factors that have an impact on economic freedom, as these factors might have a positive impact on economic growth.Keywords:
Economic Freedom, Economic Growth, Real GDP Per Capita, Fixed Capital Formation, Working Hours, Government Spending1. Introduction
Theories of economic growth have evolved throughout history, starting with Adam Smith, who is considered the most important pioneer of the classical school, as well as David Riccardo and Robert Malts, who considered work and capital accumulation the main elements of production, with reference to technology. Economists then developed theories of economic growth using mathematical models, such as Schumpeter, Harrod and Dumar, followed by Solow in 1956. In his work, Solow tried to avoid gabs found in previous models, by pointing out that short-term economic growth is due to capital accumulation, whilelong-term economic growth is lead by external shocks such as technological advances and population growth. In the eighties, the theories focused on the importance of technology. A clear example of
that is Romer’s work in 1986 and 1990.
Over the last two centuries, economic systems have undergone long-lasting stormy transformations in their structure, vision, and effectiveness. The capitalist system adopted an early call towards free market operations and state non-interference in economic activity. However, the radical turning point of the Great Depression in 1929 proved the Keynesian thought that the state should play a role in the economy to emerge from the crisis, and this approach was quickly reversed in favor of a call for state non-intervention again in the mid-1980s. In parallel, the Marxist-socialist economic thought promoted by the Soviet Union prompted the emergence of economic philosophical schools embodied in the experiences of China, East Germany, and a number of Scandinavian countries.
prompting economists to re-assess the idea of economic freedom, and so, the idea of economic freedom remains controversial. Especially in recent times, state intervention in economic activity became inevitable during the 2008 global financial crisis.
Hence, this study aims to find out the direction and extent of the relationship between economic freedom and economic growth. This study used the index of economic freedom to express economic freedom, which is measured based on factors related to the rule of law, the role of government in the economy, regulatory efficiency, and open markets.
1.1. Theoretical Background
Classical school pioneers agree that labor, capital, natural resources, and technological advances affect the process of production and thus economic growth, and that all elements of production are variable except for natural resources, which is subjected to the law of diminishing returns assuming the stability of both technology and capital used in the productive process. The incentive for economic activity is profit making, which leads to the accumulation of capital. There is an inverse relationship between the size of population and the formation of capital. The increase in prices of agricultural products leads to increase wages and reduce profits, and thus reduces savings and then investment. This leads to a decrease in capital formation. On the other hand, there is a positive relationship between population growth and capital accumulation [20].
"We do not expect to get our food as a result of the butcher or baker's goodness, but we do so out of their desire to achieve their own interests." This common saying of well-known economist Adam Smith embodies the concept of rational self-interest that will result in economic prosperity [25]. Adam Smith defines the pillars of capitalism as follows: competition, market mechanism, freedom of choice for consumption, production and investment, and the specific role of government, which is to preserve the rights of citizens and the regulatory environment that facilitates the functioning of the market mechanism. The most important factors affecting economic growth are the market mechanism, distribution of labor, accumulation of capital, and the profit incentive [25].
After that, Ricardo developed the Smith model assuming the stability of the land element and the change of both labor and capital, leading to the law of diminishing returns with the stability of production technology. David Ricardo has shown interest in the issue of income distribution. When output and population growth become more stable, then land is increasingly becoming a scarce productive element, and the price of land will be increasing continuously. In parallel with the high rental yield - according to the Supply and Demand Law - this leads to an increase in the share of landowners' income at the expense of the returns of other elements of production. Ricardo's solution to this “dilemma” was to impose progressive taxes to redistribute income more evenly [21], which is contrary to the specific role of government advocated by Adam Smith.
In his book “Contribution to the Critique of Political Economy”, Karl Marx pointed out that the capitalist economic system continues as long as it does not exhaust its social, economic and technological potential. He focused on the struggle between the social classes, believing that the end of this struggle will lead to a change in the means of production and the transition from private to public ownership. His predictions of the collapse of the capitalist system were based on Ricardo's thought of the principle of “scarcity”, with a more comprehensive analysis of the capitalist world, which at that time was more dependent on industry than on land ownership. Marx believed that the bourgeoisie played a revolutionary role by ending feudal and patriarchal relations, but at the same time omitted all human connections except personal interest, as well as the constant need of the bourgeois system to expand the disposition of its products, noting that the bourgeoisie had given a cosmopolitan character for production and consumption in each country through its exploitation of the world market [14]. On the other hand, Karl Marx and David Ricardo agreed on the importance of capital concentration. Ricardo, however, argued that the solution was to impose progressive taxes on landowners, while Marx asserted that the solution was only in the proletariat revolution.
Schumpeter focused on the role of innovation in the growth of the economy. The entrepreneur introduces something new, such as a new product or method of production, which regulates the production process, in order to maximize profit. He distinguished between the innovator and the capitalist, and stressed that in the case of competitive equilibrium, the profits are zero due to the equality between the price and the production cost. Joseph Schumpeter also bet on the collapse of the capitalist system. He did not just do that, but he went too far when he thought that the socialist system would triumph, based on contradictions in the capitalist organization of production and consumption [23].
Schumpeter agreed with Marx that the capitalist economic system would collapse; stressing that it was the middle class that maintained the existence of the capitalist system, and that its existence was linked to the evolution of the mode of production. They also spoke of the inequity of the capitalist system. Schumpeter highlighted the importance of the individual's role and ethics in influencing the economic market through the price and distribution of goods, so demand encourages supply, and the class struggle between entrepreneurs as well as innovators and businesspersons through competition among themselves. Marx focused on the role of society as a whole, and on the class struggle between workers and peasants on one hand and capitalists on the other [23]. However, Schumpeter was criticized by Herbert Gintis, who argued that Schumpeter exaggerated beating on the feasibility of state socialism, believing that an undemocratic state would not be able to effectively supervise the economy [6].
the idea of state intervention to activate the total demand and address the increase in unemployment and deflation through financial policy (tax cuts, increased government spending), and monetary policy (Loans and interest rates) to save the economy from the recession and get rid of the Great Depression [12]. In addition to the importance of effective investment demand, the marginal adequacy of capital and interest rates are also determinants of investment, so Keynes has been criticizing classical theory and Sai's laws “that supply is what creates demand”.
Some researchers saw that Keynes's goal was to find a solution to the Great Depression, not to replace the classical economic system based on market mechanism. He only called for periodic intervention, namely "saving capitalism from capitalists" through a set of measures to protect the free market from private stakeholders that interferes with market efficiency [19].
For his part, Simon Kuznet called for thoughtfulness and waiting and felt that it will not be long before welfare is spread and enjoyed by all members of society. Hisphilosophy pictured growth a wave that will soon raise all boats, worsening the phenomenon of Inequality in income distribution in the early stages of the growth process. This is the result of the concentration of savings in the industrial sector versus the marginalization of the agricultural sector.
Kuznets agreed with Robert Solow on the importance of the idea of balanced growth of all elements of production: income, profits, wages, and capital, so that each social segment benefits from growth at the same degree, without significant deviations from the standard criterion, and therefore there is a clear intellectual difference between Kuznets and Solow on one hand, and Ricardo and Marx on the other [18].
Solow developed the Harrod-Dummar model, which is essentially based on three main parameters: saving ratio, capital ratio of production, and percentage of increase in labor force. The equilibrium occurs by comparing the normal rate of growth, which is based on savings, investment and labor force growth. The model excluded the possibility of substitution between labor and capital as well as the exclusion of the technology component. The Hard Dummar model is distinguished by labelling short and long-term studies [26].
The pioneers of the neoclassical school that emerged in the eighties, led by Ramsey and Solo, have emphasized that the prices of input services are determined by their marginal productivity, with full competition, optimal utilization of economic resources, and a preference for supply-side macroeconomic policies. Among the most important ideas of this school: privatization of public companies, dismantling public ownership, encouraging foreign investment, and liberalization of trade to increase domestic and foreign investment, and thus increase the rate of capital accumulation. The "Neoclassic" took control of the International Monetary Fund and the World Bank, at the time when International Labor Organization and United Nations organizations stepped back. The Solow model is one of the
most prominent neoclassical growth models [27].
A few economists have largely defended neoliberalism, such as Milton Friedman and Friedrich August Heike. Both called for a deregulated market economy and, in principle, removed Keynes's theory of a strong state capable of steering the economy.
Friedman believed that monetary policy is the basis of economic success, and of course, when the central bank adopts the wrong monetary policy by fueling the economy more money than the appropriate amount, the result is inflation. In addition, Friedman believed that there is no direct relationship between policies and economic growth, however, growth is a result of competent Market forces in the first place [24].
Pullman Krugman, criticized Friedman when he said: "He made a mistake when he claimed that the market was always working as efficiently as desired, and that, alone, it can do its job properly." Krugman argues that Friedman has made major political mistakes. Following his ideas, many developing countries removed barriers to foreign capital. In addition to liberalizing industrialized economies, he called for privatizing government and quasi-government projects and the supremacy of personal interests [24].
Economic growth in the classical capitalist economic system has reached its highest levels compared to the rest of the economy, while the inequality gap in income distribution has widened. Piketty's study, in data from the 18th century, confirmed that the rate of return on investment exceeds the overall growth rate. As disparities persist and compound returns are achieved, the wealth of money owners will increase faster than other types of returns such as wages. Moreover, the Piketty study supports the importance of government policies in the economy [18].
1.2. Literature Review
Governments aim to achieve high economic growth rates, and this is one of their priorities, whether for real reasons or for electoral purposes. Therefore, many theoretical and applied studies focused on economic growth as one of the most important macroeconomic variables in the construction of economic policy of any country. The results of the studies vary, depending on the economic indicators used; some indicators show a direct and strong relationship with economic growth, while others deny the existence of a relationship.
Haan & Siermann [8] examined the relationship between economic freedom and growth, from 1980 to 1992, for data from 78 countries, based on average GDP per capita growth as a dependent variable, and the level of economic freedom as an independent variable as well as explanatory variable. The study reviewed the views of liberals and socialists on the impact of state control on economic growth and emphasizes that there is no clear evidence of this effect.
countries due to the heterogeneity of the parameter and selected 25 developed countries. The results of the study confirmed that increasing economic freedom leads to an increase in Economic growth and improves income distribution.
The Gordillo & Arce [7] study emphasized the positive impact of economic freedom and political freedom on economic growth. The study used cross-sectional data covering 45 countries for the period from 1975 to 1995, using per capita GDP as a dependent variable, and independent variables were the Index of Economic Freedom and the Index of Political Freedom.
Loizides & Vamvoukas [13] examined the relative relationship between the volume of government spending and the rate of economic growth. The dependent variable was the rate of economic growth. The independent variables included government spending, unemployment, and inflation. Based on the error correction model, and a causality test, to analyze data covering the period 1948-1995, involving Greece, the United Kingdom and Ireland, the study found that government spending causes growth in national income, both in the short and long term, which means that public spending enhances Comprehensive economic development.
The results for Greece supported the Wagner hypothesis, as increased production leads to growth in public spending. A distinguishing feature in the case of Greece is the relationship of causality from national income to public spending. The UK results also indicated a similar pattern when a change was made to the model by adding the inflation variable as an additional variable, while Ireland's results did not indicate any effect of causation.
The Brahasrene [3] study focused on the relationship between government expenditures and economic growth in Thailand, for the period 1993-2006. The study found that total government expenditures cause economic growth, whereas economic growth does not increase government expenditures, meaning there is a one-way causality between government expenditures and economic growth. The study recommended further research on government military and non-military spending to compare the impact of military and non-military expenditures.
Fabro & Aixala [5] examined the direct and indirect effects of economic freedom and political freedom on economic growth. Their study covered cross-sectional data for 79 countries in the period (1976-2005). It relied on the GPD per capita as a dependent variable. While the independent variables were: Physical Money (as% of GDP), Average Enrollment Rate in Secondary Education, Average Enrollment Rate in Primary Education, Average Trade (as% of GDP), Economic Freedom, Civil Liberty, Public Relations (Political Rights) and Institutional Quality it concluded that institutional quality is important for economic growth, whether by stimulating the allocation of resources or indirectly by encouraging investment in physical and human
capital, while economic freedom primarily affects
institutional quality, followed by civil liberty and then political freedom.
Apergis et al. [2] aimed to ascertain the causal relationship between income inequality and economic freedom, for the period 1981 to 2004, for the United States of America, and the dependent variable in the study was inequality in income distribution represented in the Gini index. Independent variables were the index of economic freedom, and GDP. The study emphasized a two-way causal relationship between income inequality and economic freedom in both the short and long term. Income inequality leads to the use of income redistribution policies, thus reducing economic freedom, and in turn when economic freedom is reduced, income inequality increases.
Keseljevic & Spruk [11] study was characterized by the study of the components of the Index of Economic Freedom, the independent impact of each component on the level of economic freedom, and then on the level of per capita income, for the period from 1996 to 2011 and for 135 countries. Components of economic freedom index vary in their effect on economic freedom. Some of them may even have an adverse effect on growth.
Particia & Izuchukwu [17] aimed to see the impact of government spending on education on Nigeria's economic growth for the period 1977-2012. The dependent variable in the study was real GDP as a measure of economic growth, while independent variables included government spending on various sectors, including education. The study analyzed government expenditures by sector and stressed onthe importance of government spending on education for economic growth, especially in developing countries. Applied results of the study showed that government spending on education positively affects long-term economic growth. Increasing government spending on education by 1% results in a 0.3% increase in GDP, and thus government investment in education improves human capital skills. This contributes to the improvement of economic growth. The study emphasized the importance of the decision-makers focus on government capital expenditure to accelerate economic growth in Nigeria, and the need to reorient government expenditures towards productive sectors to improve the living standards of the poor.
Carter et al [4] examined the relationship between government spending and economic growth in Barbados for the period 1976-2011, using real GDP per capita to represent economic growth as a dependent variable, while independent variables were expenditure on education, health and social security, population growth, investment and openness on international trade. The results of the study showed a positive relationship between government spending and economic growth, especially in the short term, with less impact over time.
defense, health care, employment, and development.
One of the findings of the study is that the Malaysian economy does not meet Keynesian assumptions. Government spending on health, education, defense and welfare does not reduce poverty, while lowering government spending promotes growth in real GDP.
While the study of Abdieva et al. [1] compared between the two former republics of the Soviet Union, Kazakhstan and Tajikistan, these two countries have similarities in terms of geography, population and poverty rates. The study analyzed the short-term causal relationship between government expenditures and economic growth in both countries for the period January 2000 to April 2013. The result of the Granger test showed that there is a causal relationship that goes from government expenditures to economic growth in Kazakhstan, while there is no causal relationship between variables in Tajikistan. The impact of GDP on government expenditures is higher than the impact of government spending on GDP in both countries. According to the results of the error correction model, the speed of convergence to the balance of government expenditure is higher in Kazakhstan than in Tajikistan, due to the high level of taxation and deflation of fiscal policy in Tajikistan. On the other hand, the speed of convergence to balance the impact of government expenditures on GDP in Kazakhstan is higher than in Tajikistan. The researcher believes this is the result of Kazakhstan's expansionary fiscal policy. According to the study, there is a one-way causal relationship between government expenditure and GDP in Kazakhstan. This supports the Keynesian theory that causality extends from government expenditure to growth. However, there is no causal link between these two variables in Tajikistan.
The Mengist [15] study confirmed that real government spending on human capital formation boosted growth in Ethiopia during the period 1970/1971 / 2010/2011. The real per capita income was the variable of this study, while the independent variables were private investment, government investment spending, government consumer spending, capital expenditure of government, and trade volume. The results of the study confirmed that real government spending on human capital, investment spending, and trade; all have a positive and significant impact on the growth of real income per capita in the longrun. The study recommended increasing government spending on education and health care and attributed the delay in Ethiopia's economic growth to the huge allocation of salaries and subsidies to non-state-owned companies.
While Hamza's study [9] examined the relationship between the economic freedom variable and the economic growth of Egypt, the UAE and Iraq, for the period from 2000 to 2015, with the rate of economic growth as the dependent variable, and the index of aggregate economic freedom-in terms of ranking, degree and classification- as the independent variable in addition to the phantom variables, The result was a positive correlation between the index of economic freedom and the rate of GDP growth in the UAE,
while there was no relationship between the variables in the results of Egypt and Iraq.
2. Data and Methodology
The sources of data is the World Bank Group (WBG), the Center for Growth and Development (GGDC), and The Heritage Foundation.
This study measures the impact of economic freedom on economic growth depending on an economic model based on economic theory. Where the dependent variable is the real GDP per capita and the independent variables are; the index of economic freedom, real fixed capital formation, real government spending and average number of hours worked.
The sample of 42 countries was divided into two groups, based on the score of the country on index of economic freedom for 2017. While the economic freedom index, which ranges from 100 to 70, has 13 countries: Switzerland, Australia, Canada, Ireland, the United Kingdom, Georgia, Denmark, the United States, Sweden, Finland, Germany, Malaysia, and Armenia. The second group having 69.9 to 50 points, consists of 29 countries, as follows: Israel, Romania, Japan, Poland, Bulgaria, Cyprus, Jordan, Hungary, Philippines, Turkey, Spain, Mexico, France, Portugal, Italy, Indonesia, Morocco, Croatia, Gabon, China, Nigeria, Russia, Tunisia, Bangladesh, Greece, Lebanon, Pakistan, Egypt and India. The highest country in the Freedom Index among the study sample was Switzerland earning 81.5, while the lowest was Egypt and India with 52.6 points.
Figure 1. The relationship between real GDP per capita and the Freedom
Index among the countries of the first group.
center represent Georgia and Armenia for the years 1996 to 1998, in which per capita real GDP of Georgia ranges from US $ 2,600 to US $ 3,200 and Armenia from US $ 2,300 to US $ 2,600. Although in 2017, the per capita share has approximately US $ 9,700 and US $ 8,800, respectively. Therefore, according to the World Bank, these countries are classified as upper middle-income countries.
The average real GDP per capita in Switzerland was approximately $ 53,400, the highest average income in the study sample, followed directly by the United States, which amounted to approximately $ 48,600. The real GDP per capita of the entire group of countries was $ 34,900. All of which are high-income countries except Malaysia, Georgia and Armenia, which were ranked as high middle-income countries.
The highest GDP per capita was for Ireland and amounted to $66549, followed by Switzerland $ 58004 and then the United States $ 54470. The index of freedom in 2017 for Ireland, Switzerland and the United States was 76.7, 81.5, and 75.1, respectively.
Figure 2. The relationship between real GDP per capita and the freedom
index among the second group countries.
Figure 2 shows the relationship between real GDP per capita and the freedom index among the second group countries and shows a positive relationship. Points scattered away from the center and at the top of the graph are for Jordan and Morocco. The points at the bottom of the graph represent Bangladesh in 2008, which recorded the lowest freedom index of 44.2.
France recorded by average the highest real GDP per capita in Group B countries, at around $ 36,000, followed by Italy at approximately $ 35,900 and Japan at $ 35,494. Bangladesh was approximately $ 2,200, followed by India at $ 3,900.
For the year 2017, Japan got the highest GDP per capita in the group countries with $ 39010, followed by France $ 38807, then Italy $ 35343, while the freedom index for
2017 for Japan, France and Italy were 69.9, 63.3, 62.5, respectively.
The study uses the following standard model for analysis:
LNGDPi = β0 + β1LNFREEi + β2LNGCFi + β3LNGi + β4LNAVHi +εt (1)
Where:
LNGDP: The logarithm of real GDP per capita. LNFREE: The logarithm of economic freedom index. LNGCF: The logarithm of the real fixed capital formation. LNG: The logarithm of real government expenditures. LNAVH: The logarithm of the average number of hours worked.
β i: parameters.
εt: error term
Fixed capital formation refers to capital, and the average working hours refer to employment in the economy. Government expenditures include both current and capital expenditures of the central government in each country, and GDP per capita the model is based on the contribution of production elements to the growth of GDP. The study adopted the natural logarithm of the above variables to express the elasticity’s of the variables with GDP per capita.
Define Variables by data Source:
1.GDP per capita, PPP (constant 2011 international $): GDP per capita based on purchasing power parity (PPP). PPP GDP is gross domestic product converted to international dollars using purchasing power parity rates. An international dollar has the same purchasing power over GDP as the U.S. dollar has in the United States. GDP at purchaser's prices is the sum of gross value added by all resident producers in the economy plus any product taxes and minus any subsidies not included in the value of the products. It is calculated without making deductions for depreciation of fabricated assets or for depletion and degradation of natural resources. Data are in constant 2011 international dollars.
2.Gross capital formation (constant 2010 US$): Gross capital formation (formerly gross domestic investment) consists of outlays on additions to the fixed assets of the economy plus net changes in the level of inventories. Fixed assets include land improvements (fences, ditches, drains, and so on); plant, machinery, and equipment purchases; and the construction of roads, railways, and the like, including schools, offices, hospitals, private residential dwellings, and commercial and industrial buildings. Inventories are stocks of goods held by firms to meet temporary or unexpected fluctuations in production or sales, and "work in progress." According to the 1993 SNA, net acquisitions of valuables are also considered capital formation. Data are in constant 2010 U.S. dollars.
3.General government final consumption expenditure
consumption) includes all government current expenditures for purchases of goods and services (including compensation of employees). It also includes most expenditures on national defense and security, but excludes government military expenditures that are part ofgovernment capital formation. Data are in constant 2010 U.S. dollars.
4.Average annual hours worked: Average annual hours worked by persons engaged.
Economic Freedom Index
The Heritage Foundation produced this index, which states that every human being has the right, within an economically free society, to work, own, produce, consume and invest. This index measures factors related to the rule of law, the role of government in the economy, regulatory efficiency, and open markets in each economy. [16].
The index began with the classification of countries since 1995, and classifies (186) countries, including six countries not classified for 2017, namely Iraq, Libya, Liechtenstein, Somalia, Syria and Yemen. It contains 100 points and classify countries within five groups. The first group has the highest degrees of freedom and given from 80 to 100 points. The second group is Mostly Free and given 70 to 79.9 points, and the third group is Moderately Free and given from 60 to 69.9 points. The fourth group is Mostly not free and given 50 to 59.9 points, and the fifth group is Not Free (Repressed) and given from 0 to 49.9. Hong Kong tops the list with 89.8 points for 2017, with North Korea at the bottom of the list with only 4.9 points. The following is a brief breakdown of the indicators used in the Index of Economic Freedom [16]:
A.Rule of law index: It consists of property rights, judicial effectiveness, and integrity:
B.The Role of the Government in the Economy (Limited Governance) Index: It consists of the tax burden and the government expenditure:
C.The efficiency of the organization index, which consists
of freedom of action and freedom of cash:
D.The Open Market Index, which relates to freedom of trade, investment, and financial freedom:
3. Results
3.1. Stationary Test
The unit root indicated that all variables in the two groups are stable at the level, which is indicated by the results of the unit root test in Table 1. As shown in Table 1, the probability value confirms the possibility of rejecting the null hypothesis, which indicates that all variables are stable at the level.
Table 1. Unit Root Test.
Variable Levin, Lin & Chu
Statistic Prob. Conclusion
Group One
LNGDP -7.03637 0.0000 I (0) LNFREE -5.38788 0.0000 I (0) LNGCF -3.30842 0.0005 I (0) LNG -3.76979 0.0001 I (0) LNAVH -2.16838 0.0151 I (0) Group Two
LNGDP -1.78833 0.0369 I (0) LNFREE -2.19705 0.0014 I (0) LNGCF -3.09038 0.0010 I (0) LNG -1.34543 0.0892 I (0) LNAVH -1.33438 0.0910 I (0)
3.2. Co-Integration Test
The Pedroni Residual Co-integration Test verifies the null hypothesis that there is no co-integration between the variables. Based on the probability value results in Table 2 the null hypothesis cannot be rejected which indicates that there is no common integration between the variables.
Table 2. Joint Integration Test.
Pedroni Residual Cointegration Test
Variables PCGDP, GCF, G, AVH, OVERALL_SCORE
Statistic Prob. Weighted Statistic Prob.
Group One
Panel v-Statistic 0.722814 0.2349 1.592592 0.0556
Panel rho-Statistic 0.865227 0.8065 1.114891 0.8676
Panel PP-Statistic -2.092377 0.0182 -2.208644 0.0136
Panel ADF-Statistic 2.007992 0.9777 -0.141528 0.4437
Group Two
Panel v-Statistic -0.451703 0.6743 -0.332478 0.6302
Panel rho-Statistic 3.048895 0.9989 2.950548 0.9984
Panel PP-Statistic 0.988388 0.8385 0.450243 0.6737
Panel ADF-Statistic 0.946158 0.8280 0.501219 0.6919
The results of the unit root and co-integration tests described above confirm the use of the least squares method to estimate the relationship between variables of the model.
3.3 Estimation
When applying the normal least squares method to the
Table 3. Hauseman Test.
Correlated Random Effect – Hausman Test
Chi- Sq. Statistic Chi- Sq. d.f Prob.
Group One
Cross section random 12.578261 4 0.0135
Group Two
Cross section random 81.472838 4 0.0000
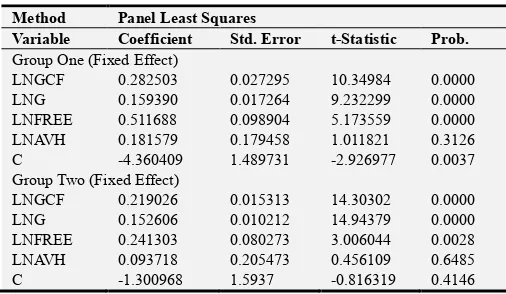
The equalities are estimated using fixed effects model and the results of estimation are shown in table 4 below.
Table 4. Estimation Results.
Method Panel Least Squares
Variable Coefficient Std. Error t-Statistic Prob.
Group One (Fixed Effect)
LNGCF 0.282503 0.027295 10.34984 0.0000 LNG 0.159390 0.017264 9.232299 0.0000 LNFREE 0.511688 0.098904 5.173559 0.0000 LNAVH 0.181579 0.179458 1.011821 0.3126 C -4.360409 1.489731 -2.926977 0.0037 Group Two (Fixed Effect)
LNGCF 0.219026 0.015313 14.30302 0.0000 LNG 0.152606 0.010212 14.94379 0.0000 LNFREE 0.241303 0.080273 3.006044 0.0028 LNAVH 0.093718 0.205473 0.456109 0.6485 C -1.300968 1.5937 -0.816319 0.4146
4. Discussion
4.1. The First Group
1.There is a positive and statistically significant relationship between the index of economic freedom and GDP per capita, which means an increase of economic freedom by 1% in the country, affects GDP per capita positively, by 0.51%.
2.The relationship between average working hours and GDP per capita is not statistically significant, which means there is no effect of average working hours on GDP per capita. 3.There is a positive and statistically significant
relationship between government spending and GDP per capita, which is in line with economic theory, i.e. the increase of government spending by 1% in the country positively affects GDP per capita by 0-16%. 4.There is a positive and statistically significant
relationship between the fixed capital formation and the per capita GDP, which is in line with the economic theory. Increasing the fixed capital formation by 1% leads to an increase in the GDP per capita by 0.28%. 5.There is a positive and statistically significant
relationship between the fixed capital formation and the per capita GDP, which is in line with the economic theory. Increasing the fixed capital formation by 1% leads to an increase in the GDPper capita by 0.28%.
4.2. The Second Group
1.There is a positive and statistically significant relationship between the index of economic freedom and GDP per capita, which means that an increase of
economic freedom by 1% in the country positively affects GDP per capita by 0.24%.
2.The relationship between the average working hours and GDP per capita is not statistically significant, which means that there is no effect of the average working hours on GDP per capita.
3.There is a positive and statistically significant relationship between government expenditure and GDP per capita, which is in line with economic theory;i.e. the increase of government spending by 1% in the country positively affects GDP per capita by 0.15%.
4.There is a positive and statistically significant relationship between the fixed capital formation and the GDP per capita, which is in line with the economic theory. Increasing the fixed capital formation by 1% leads to an increase in the GDP per capita by 0.22%.
5. Conclusion
The results showed that all variables were statistically significant and affect economic growth positively, except the working hour’s index for both groups, but despite the positive effect, the variables were inelastic.
The index of economic freedom has a positive relationship with the GDP per capita according to the results of the study, but its value in the first group is higher than the value in the second group, reaching 0.511 in the first group compared with 0.241 in the second group. Countries in the first group with a high freedom index are characterized by high incomes and thus, flexibility will tend to rise compared to the countries in the second group, which are characterized by a decrease in both the freedom index and per capita income compared to the first group.
The study recommends that the economic decision makers should pay attention to the variables that affect economic freedom in order to enhance economic growth in their respective countries.
References
[1] Abdieva, Raziakhan and Damira, Baigonushova (2017), “Relationship between Government Expenditure and Economic Growth in Transition Countries: Case of Kyrgyzstan and Tajikistan”, Bilig. Autumn 2017/Number 83. pp. 241-258.
[3] Brahmasrene, Tantatape (2007), “The Relationship between Government Expenditures and Economic Growth in Thailand. Journal of Economics and Economic Education Research”, 8 (2), 2007.
[4] Carter, Justin and and Roland, Craigwell (2013), “Government Expenditure and Economic Growth in a Small Open Economy: A Disaggregated Approach”, JEL Classification No: E62, E210, H50, September 2013.
[5] Fabro, Gema and Aixala, Jose (2012),“Direct and Indirect Effects of Economic and Political Freedom on Economic Growth. Jei Joirnal of Economic Issues", Vol. XLV I No. 4 December 2012, DOI 10.2753/JEI0021-3624460411.
[6] Gintis, Herbert. (1990), “Why Schumpeter got it Wrong in Capitalism, Socialism, and Democracy. Challenge Magazine August”.
[7] Gordillo, Manuel vega and Arce, Jose (2003), “Economic Growth and Freedom: Acausality Study. Cato Journal. vol. 23, No. 2 (fall 2003) pp. 199-212.
[8] Haan, Jakob, and Siermann, Clemens (1998). “Further evidence on the relationship between economic freedom and economic growth”. Public Choice 95: 363-380, 1998. 1998 Kluwer Academic Publishers. Printed in the Netherlande. [9] Hamza, Hussein (2017), “Al-Ghazzi for Economic and
Administrative Sciences”, No. 3, Volume XIV, pp. 21-44. [10] Hasnul, Al Gifari. (2015),“The effects of government
expenditure on economic growth: the case of Malaysia”. MPRA Paper No. 71254, posted 22 May 2016 14:44 UTC. [11] Keseljevic, Aleksandar, and Spruk, Rok (2013),“Endogenous
economic freedom and the wealth of nation: evidence from a panel of countries, 1996 – 2011”. Applied Economics ISSN 003-6846 Print/ISSN 1466-4283 online @ 2013 Taylor & Francis, http:/dx.doi.org/10.1080/00036846.2012.736948. [12] Keynes, John Maynard (1936), The General Theory of
Employment, Interest and Money. London: Macmillan (reprinted 2007).
[13] Loizides, John and George, Vamvoukas. (2005),"Government Expenditure and Economic Growth: from Trivariate Causality Testing. Journal of Applied Economics", Vol. VIII, No. 1 (May 2005), pp. 125-152.
[14] Marx, Carl (1985), Capital, Editora Nova Cultural Ltda, (1sted). Sovit Union.
[15] Mengist, Mulugeta Dereje (2017),"The Impact of Government Expenditure on Economic Growth in Ethiobia, (AN Empirical Analysis using Johansen Cointegration Approach)". Debre Markos University. JUNE 2017.
[16] Miller, Terry et al (2019). Index of Economic Freedom 25th Anniversary Edition. The Heritage Foundation.
[17] Patricia, NkiruandIzuchukwu, Daniel.(2013),"Impact of Government Expenditure on Economic Growth in Nigeria". Vol.1, No. 4, pp. 64-71, December 2013 International Journal of Business and Management Review Published by European Centre for Research Training and Development UK (www.ea-journals.org).
[18] Piketty, Thomas (2014), Capital in the Twenty-First Century (Cambridge, Massachusetts: Belknap Press.
[19] Rajan, Raghuram, and Luigi, Zingales (2003),“Saving Capitalism fromthe Capitalists: Unleashing the Power of Financial Markets to Create Wealth and Spread Opportunity”, (New York: Crown Publishing Group).
[20] Rasheed, Cleaver (2013),“Theoretical Study on Economic Growth and Sustainable Development Relations and Links, Heritage Magazine”, No. 10, December 2013.
[21] Ricardo, David. (1817),“On the Principles of Political Economy and Taxation. Piero Sraffa (Ed.) Works and Correspondence of David Ricardo”, Volume I, Cambridge University Press (reprinted 1951).
[22] Scully, Gerald W (2002),“Economic Freedom, government policy and the trade-off between equity and economic growth”. Public Choice 113: 77-96, 2002, Kluwer Acdemic Publishers. Printed in the Netherlands. Shumpeter, Joseph A, 1942, Capitalism, Socialism and Democracy. Routledge, amember of the Taylor& Francis Group, 1994.
[23] Schumpeter, Joseph A, 1942, Capitalism, Socialism and Democracy. George Allen &Unwin (Publishers) Ltd, London: UK.
[24] Schaefer, Ulrich (2010), The Collapse of Capitalism: Reasons for the Failure of the Deregulated Market, Kuwait: The World of Knowledge.
[25] Smith, Adam (1776), The Wealth of Nations. T cadell, W. Strahan. London.
[26] Solow, Robert (1956),"The Quarterly Journal of Economics", Vol. 70, No. 1 (Feb., 1956), pp. 65-94 Published by: The MIT Press Stable URL: http://www.jstor.org/stable/1884513 Accessed: 22/03/2010 10:04.