Application of a model to assess aflatoxin risk in peanuts
Y. S . C H A U H A N1*, G. C . W R I G H T2, R. C . N . R A C H A P U T I1, D. H O L Z W O R T H3, A. B R O O M E1, S. K R O S C H1
A N DM. J . R O B E R T S O N4 1
Department of Employment,Economic Development and Innovation(DEEDI),P.O. Box 23,Kingaroy, Queensland 4610,Australia
2
Peanut Company of Australia,P.O. Box 26,Kingaroy,Queensland 4610,Australia 3
CSIRO,P.O. Box 102,Toowoomba,Queensland 4350,Australia 4CSIRO,Private Bag 5,P.O. Wembley,WA 6913,Australia (Revised MS received 17 September 2009 ; First published online 2 February 2010)
S U M M A R Y
When exposed to hot (22–35xC) and dry climatic conditions in the field during the final 4–6 weeks of pod filling, peanuts (Arachis hypogaea L.) can accumulate highly carcinogenic and immuno-suppressing aflatoxins. Forecasting of the risk posed by these conditions can assist in minimizing pre-harvest contamination. A model was therefore developed as part of the Agricultural Production Systems Simulator (APSIM) peanut module, which calculated an aflatoxin risk index (ARI) using four temperature response functions when fractional available soil water was<0.20 and the crop was in the last 0.40 of the pod-filling phase. ARI explained 0.95 (Pf0.05) of the variation in aflatoxin contamination, which varied from 0 toc. 800mg/kg in 17 large-scale sowings in tropical and four sowings in sub-tropical environments carried out in Australia between 13 November and 16 December 2007. ARI also explained 0.96 (Pf0.01) of the variation in the proportion of aflatoxin-contaminated loads (>15mg/kg) of peanuts in the Kingaroy region of Australia during the period between the 1998/99 and 2007/08 seasons. Simulation of ARI using historical climatic data from 1890 to 2007 indicated a three-fold increase in its value since 1980 compared to the entire previous period. The increase was associated with increases in ambient temperature and decreases in rainfall. To facilitate routine monitoring of aflatoxin risk by growers in near real time, a web interface of the model was also developed. The ARI predicted using this interface for eight growers correlated significantly with the level of contamination in crops (r=0.95,Pf0.01). These results suggest that ARI simulated by the model is a reliable indicator of aflatoxin contamination that can be used in aflatoxin research as well as a decision-support tool to monitor pre-harvest aflatoxin risk in peanuts.
I N T R O D U C T I O N
Aflatoxin contamination in peanuts caused by the invading soil fungiAspergillus flavusandAspergillus parasiticus is a major food safety issue throughout the world. Many countries have attempted to limit human and animal exposure to aflatoxin by imposing regulatory limits of aflatoxin levels in peanuts and its products intended for use as food and animal feed. In Australia, the National Agricultural Commodities Marketing Association (NACMA) trading standard for aflatoxin in growers’ stock and retail peanuts is 15mg/kg (NACMA 2003). The major cost
implications related to aflatoxin in Australia, as in the rest of the developed world, are mainly towards meeting these regulatory limits, which seriously affect profitability for dryland peanut growers, shellers and processors. In recent years, processing costs to remove aflatoxin have been passed on to growers, which has led to a desire to minimize aflatoxin at its source, i.e. in growers’ fields, via implementation of appropriate pre- and post-harvest management practices assisted by better understanding of the conditions that favour the contamination.
Although risk of pre-harvest contamination of peanuts is generally recognized to be greater than that of post-harvest contamination (Coleet al. 1989), most management practices adopted by the industry to minimize aflatoxin relate to cleaning farmers’ stock to * To whom all correspondence should be addressed.
an acceptable standard (Dorner 2008). However, as the removal process is expensive, Dorner (2008) con-sidered prevention of aflatoxin accumulation in the first place as the best way to deal with the problem. Indeed, the major focus of Australian research on aflatoxin minimization has been on prevention of aflatoxin contamination (Wright et al. 2005). Aflatoxin research carried out in Australia has in-dicated that adjusting the timing of harvest in relation to the perceived risk of aflatoxin contamination can appreciably minimize pre-harvest contamination (Rachaputiet al. 2002). In years where the risk of pharvest aflatoxin contamination is high, it is re-commended that the crop should be harvested early so that pods are not exposed to the presence of risk factors. In years where the risk is low, it is re-commended that the crop be allowed to reach full maturity, thus increasing pod yield potential and quality (Macksonet al. 2001). High temperatures and end of season drought have been identified as the main climatic risk factors for aflatoxin accumulation (Blankenshipet al. 1984 ; Craufurdet al. 2006 ; Cotty & Jaime-Garcia 2007). Achar & Sanchez (2006) showed that maximum growth ofA. flavusand afla-toxin production occurred at temperatures between 27 and 30xC, while temperatures below 10 and above 37xC resulted in little fungal growth and no detect-able levels of aflatoxin.
Research in other crops has suggested that, even when it is possible to obtain information on host– pathogen–environment interaction components, to assimilate this into a decision that would help mini-mize the impact of this interaction is a very complex task. Recognizing this difficulty, development of risk-based models, which work on assessing the likelihood of damage occurring, is becoming more common (Burke & Dunne 2008). Indeed, the adoption of the aflatoxin minimization strategy described above (Rachaputi et al. 2002) in Australia hinges largely on better prediction of aflatoxin risk, as quantifying actual aflatoxin content in the field or A. flavus/ A. parasiticusinfection on a routine basis prior to harvest is impractical due to sampling issues associ-ated with high cost of chemical analysis (Whitaker et al. 2004), as well as the geocarpic nature of the crop.
A few preliminary regression models for predicting aflatoxin contamination that assess the main climatic risk factors have been proposed in the USA and elsewhere (Thai et al. 1990 ; Parmar et al. 1997 ; Hendersonet al. 2000 ; Craufurdet al. 2006), but have not been applied to forecast aflatoxin risk in farmers’ fields and therefore have yet to be verified. This is probably because intake policies in those countries do not provide economic penalties for aflatoxin-contaminated peanuts. However, in Australia and other countries where penalties are levied or are likely to be levied in the future, such a model will be very
valuable for growers (Wright & Hansen 1997). The present paper describes the development of a new model, which uses a novel crop simulation approach to assess the risk of contamination, its validation and application in aflatoxin research and as a decision-support tool by peanut growers.
M A T E R I A L S A N D M E T H O D S The development of the peanut aflatoxin model The available literature on pre-harvest aflatoxin con-tamination suggested that both low soil moisture and high temperature during the last 4–6 weeks of pod filling were required to trigger aflatoxin production (Hillet al. 1983 ; Coleet al. 1985 ; Dorneret al. 1989). This information was taken into consideration while developing algorithms of the peanut aflatoxin model as a sub-component of the Agricultural Production Systems Simulator (APSIM) peanut module (Keating et al. 2003). APSIM’s peanut module uses ambient temperature, radiation and rainfall on a daily time step to simulate peanut growth and yield. Its soil temperature module (Chauhanet al. 2007) was used to simulate daily mean soil temperature if soil tem-perature was not measured. The aflatoxin model simulated an aflatoxin temperature factor (ATF) whenever fractional available soil water during the last 0.40 of the pod-filling period was low (<0.20). It was then accumulated as a counter. The cardinal temperatures of aflatoxin production, which were es-sentially based on values published in the literature (Diener & Davis 1970 ; Gqaleniet al. 1997 ; Achar & Sanchez 2006), and values of soil water and stage of pod filling were optimized by using aflatoxin positive loads (aflatoxin>15mg/kg) data from seasonal intakes of c. 100–500 loads delivered during the 1978–2003 period at one intake point in the North Burnett region (25x36kS, 151x53kE) of Queensland. The crops in these seasons were generally free from any major diseases but a slight incidence of Etiella damage to pods was apparent in dry years (Etiella behrii is a moth of the family Pyralidae, found in Hong Kong, Indonesia, Malaysia and Australia ; the larvae have pest status on peanuts). Rainfall from sowing to harvest varied from 245 to 605 mm with an average of 384 mm/year. The four equations used to derive an appropriate value of ATF were as follows :
For daily mean soil temperature (STemp)<22xC ATF=0
For daily mean soil temperature of 22–30xC ATF=(STempx22)=(30x22) For daily mean soil temperature of 30–35xC
For daily mean soil temperature>35xC ATF=0
The accumulated ATF was based on the proportion of thermal time computed by the APSIM model. When 0.6 of the thermal time target for the pod-filling stage was completed, the rule for accumulating ATF commenced and remained active for the reminder of the 0.4 period. ATF was further multiplied by three and was then called the aflatoxin risk index (ARI), with the upper limit for the product of this multipli-cation being 100 in order to express the index on a 0–100 scale. The accumulated ATF does not decline because aflatoxin, once accumulated, is not metab-olized to become non-toxic. If there is a rainfall event or cooler period, ARI becomes stable and only in-creases when hot dry periods occur again. The model assumed that the aflatoxin-producing fungi,A. flavus andA. parasiticus, were always present in soils wher-ever peanuts were grown (Cotty & Jaime-Garcia 2007 ; Klich 2007).
Validation of the aflatoxin model
Two independent datasets were used to validate the model, which were not used for optimizing the threshold soil moisture and pod-filling stage that trigger an increase in aflatoxin risk. The first dataset used aflatoxin contamination in 17 large-scale rainfed sowings in a tropical environment at Katherine, Northern Territory, Australia (14.46xS, 132.26xE, elevation 108 m asl, average annual rainfall 990 mm) carried out between 16 November and 16 December 2008, and four experimental sowings in a sub-tropical environment at Kingaroy, Queensland, Australia (26.55xS, 151.85xE elevation 440 m asl, average an-nual rainfall 762 mm) carried out on 13 November and 10 December 2007, two with the mid-season maturing cultivar Middleton and two more with the ultra-early cultivar Walter. The experimental sowings were replicated four times and laid out in a split plot design with sowing dates as main plots and genotypes as sub-plots.
The large-scale sowings were harvested between 4 April and 9 May 2008 and the experimental sowings between 4 March and 30 April 2008. For estimating aflatoxin in the large-scale sowings, an 80 kg sample of pods was drawn randomly from each of the 188 loads by spikingc. 13–20 tonnes of pods at the intake point. This was further reduced to 8 kg which was then shelled to obtain approximately 5 kg of kernels. These kernels were then coarsely milled to ensure that no visible kernels remained. A 2 kg sub-sample from the ground sample was used for aflatoxin analysis.
In the experimental sowings, kernel sub-samples of 1 kg each were drawn randomly from the pods of threshed plants harvested from 2r10 m long rows.
Each sub-sample was crushed in a blender and ana-lysed for aflatoxin content.
The aflatoxin content in peanuts produced at maturity in these sowings was measured using the mini-column method developed by Holaday & Lansden (1975). Peanuts of the large-scale sowings were categorized into five aflatoxin groups based on the industry standard, e.g. Seg1 contained <8mg aflatoxin/kg, Seg2 8–100mg/kg, Seg3 100–400mg/kg, Seg4, with moderately bright fluorescence, >400– 800mg/kg and Seg5, with a very bright fluorescence, >800mg/kg. A regression equation,y=7.0444X2.9742 (where X=Seg#) was then used to convert these groups into aflatoxin content in the individual sow-ings. In the experimental sowings, the actual values obtained were used.
The APSIM model was run for each sowing after parameterizing the agronomic and soil character-istics, assembling temperature and radiation data from the nearest weather stations at Katherine and Kingaroy, located within 1–5 km of the sown area, and the local rainfall recorded in the cropping area in the APSIM format (Keatinget al. 2003). The tropical soil parameterized was of a sandy texture with a soil water holding capacity of 88 mm to a depth of 1.8 m. The sub-tropical soil was a Red Ferrosol (deep-red clay loam or oxisols containingc. 60 % clay by vol-ume) with a plant available water holding capacity of c. 120 mm to a depth of 1.8 m (Soil Survey Staff 1975). The ARI of each sowing was regressed against the calculated (in the case of large-scale sowings) or observed (experimental sowings) aflatoxin content of that sowing.
The other dataset used to validate the model was that of proportion of positive aflatoxin loads (trucks containing about 10–20 t peanuts that contained >15mg aflatoxin/kg) delivered in each season from 1978 to 2008 by peanut growers located in the region to the Kingaroy shelling depot of the Peanut Com-pany of Australia (PCA). The production delivered varied fromc. 25 000 t in 1978 to c. 1200 t in 2007. This representedc. 60 (20 t) to 2500 (10 t) truckloads in different years. The crop received in 2008 was c. 5000 t. The average pod yield (nut in shell) of the Kingaroy region in a given year was calculated by dividing the total production delivered to the intake point by the area sown to peanuts.
c. 40 mm rainfall was received over a 7-day period in accordance with local production practices for peanuts. These conditions had to be met within a sowing window between 1 November and 15 January. If any season was left out from sowing using this rule (e.g. in the 2006/07 season), the rule was relaxed for that particular season to allow sowing with only 20 mm rain. The crop inter-row spacing was specified to be 900 mm and a population ofc. 10 plants/m2 established with seeds sown at 40 mm depth. The variety parameters for peanut cultivar Streeton, a commonly grown variety in the region, were used in the simulations. In the absence of actual measurement of soil moisture, it was assumed that the soil profile was fully charged at the beginning of each season. The relationship between ARI and the positive loads was analysed using a regression approach.
Application of the aflatoxin model as a research tool for analysis of historical trends in aflatoxin risk The peanut aflatoxin model was applied to simulate aflatoxin risk from 1890 to 2008 for the Kingaroy
region. The daily climatic data for this period was obtained from the Silo website (SILO 2009). The soil selected for this simulation was a Ferrosol with a 120 mm plant available water holding capacity (Soil Survey Staff 1975). The sowing rules and variety parameters were the same as described in the previous section. The output of interest simulated by the model included ARI, in-season means of maximum and minimum temperatures and the total rainfall.
Application of the aflatoxin model as a decision-support tool for farmers
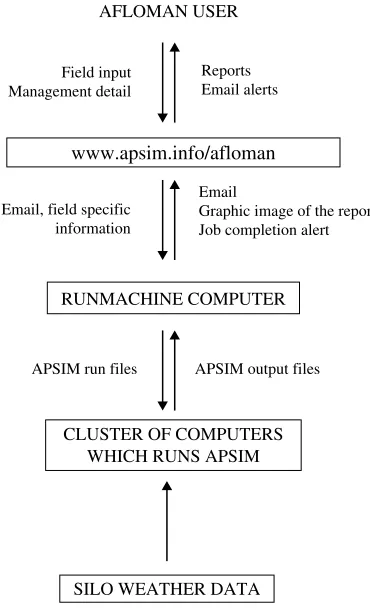
To enable growers to make use of the peanut aflatoxin model, a web-based interface called AFLOMAN was developed. The general architecture of AFLOMAN is shown in Fig. 1. This interface was used by eight growers with active assistance from re-searchers in the Kumbia, Wooroolin and Coalstoun Lakes regions (Table 1) where the crop aflatoxin content was also measured. The growers accessed AFLOMAN by logging into their account on its website (www.apsim.info/afloman), which established a link between them and a cluster of 26 dual processor computers that ran APSIM via a ‘ run machine ’ computer maintained by the Agricultural Production Systems Research Unit (APSRU) in Toowoomba, Australia.
The growers recorded daily soil temperature using pre-calibrated Tinytag1(Hasting Dataloggers, Australia). Daily rainfall in the paddock was re-corded with a rain gauge. Both daily soil temperature and rainfall data for each paddock were entered into the AFLOMAN program and the interface saved it to a Microsoft Access1
database. Whenever an aflatoxin risk report was requested online, paddock-specific input was emailed from the database to the run machine computer. The run machine queued the report to the cluster, which patched the paddock-specific input into an APSIM simulation template. The program automatically obtained online solar radiation and the ambient temperature input not en-tered by the growers from a database of historical daily climate data (SILO 2009). Soil temperature in-put, if not entered for any day, was simulated by the APSIM Soiltemp module for that day (Chauhan et al. 2007). A report containing the output from the simulation was graphed and then converted into an image file, which was then copied to the AFLOMAN website and could be accessed by the growers in their accounts. Growers received an email notification if their reports were successfully generated.
Monitoring of each grower’s farm began at sowing and continued until crops were harvested. The sub-samples for aflatoxin analysis were randomly drawn from a bag of c. 5 kg peanuts provided by each grower ; they were taken from the harvested crop that had also undergone some pre-cleaning. The total AFLOMAN USER
www.apsim.info/afloman
RUNMACHINE COMPUTER
CLUSTER OF COMPUTERS WHICH RUNS APSIM
SILO WEATHER DATA
Reports Email alerts Field input
Management detail
Email, field specific information
Graphic image of the report Job completion alert
APSIM output files APSIM run files
aflatoxin content in kernels at harvest was monitored using the mini-column method developed by Holaday & Lansden (1975). The relationship between ARI and the log transformed values of the observed aflatoxin content (mg/kg) was established using a regression approach.
R E S U L T S General growing conditions
The average pod yield in the Kingaroy region varied from 0.5 to 3.1 t/ha in the 1978–2008 seasons. There was no major foliar disease or insect outbreak, except
slight damage to pods by Etiella (E. behrii(Zeller)) in dry years. However, crops in some seasons were more drought-stressed than others. Seasonal rainfall from sowing to harvest varied from 190 to 731 mm in dif-ferent years. The average pod yield obtained in the large-scale sowings varied from 2.7 to 3.1 t/ha, while that in the experimental sowings varied from 3.1 to 4.1 t/ha.
Validation of the aflatoxin model
The relationship between observed aflatoxin con-tamination and ARI was curvilinear and explained about 0.95 of the variation in aflatoxin contamination across different sowings in two diverse environments (Fig. 2).
There was a significant linear relationship (R2 0.96, P<0.01) between the proportion of aflatoxin-positive loads (PAPLs) in different seasons from 1998/99 to 2007/08 recorded at the intake point for the Kingaroy region and the ARI predicted for those seasons (Fig. 3). The maximum ARI simulated was 59 whereas in some years ‘ nil ’ or very low ARI was simulated. The years with high ARI had a higher PAPLs. On a longer term basis (from 1977/78 to 2007/08), the relationship of ARI with aflatoxin-positive loads was somewhat poor (R2=0.65, P<0.01), but still linear (data not shown).
Application of the aflatoxin model Historical trend in aflatoxin risk
ARI simulated over different years suggested that there were 6 years between 1890 and 1979 when ARI>20 (Fig. 4). However, the frequency of years with such high risk increased substantially during the
0 200 400 600 800 1000
0 20 40 60 80
Aflatoxin content (µg/kg)
Aflatoxin risk index
Fig. 2. Relationship between ARI and observed aflatoxin content in 17 sowings in the tropics (circles) and four sow-ings in sub-tropics (triangles) during 2007/08. The regression equation of this relationship was Aflatoxin=0.1128 (¡0.112791)rARI2+5.9409(¡2.665)rARI+4.3801 (¡25.11) ;R2=0.96 (P<0.01).
Table 1. ARI simulated at harvest using the AFLOMAN DSS and observed aflatoxin content in harvested peanuts from eight farms during the 2005/06 and 2007/08 seasons in the Burnett district of Queensland, Australia
Grower
Date of
sowing Variety ARI
Observed aflatoxin content (mg/kg)
Kumbia
G1 1 Nov 05 Menzies 36 37
G2 23 Oct 05 Middleton 91 550
G3 4 Nov 05 Middleton 0 0
Wooroolin
G4 3 Nov 05 VB97 22 0
G5 22 Nov 05 Conder 24 0
G6 3 Nov 05 Middleton 0 0
Coalstoun Lakes
G7 17 Nov 05 Middleton 100 1600
post-1980 period. The 5-yearly moving average dur-ing the pre-1980 period was above the overall average only briefly, on three occasions, and then declined shortly thereafter. However, it was more than the long-term average for most of the post-1980 period.
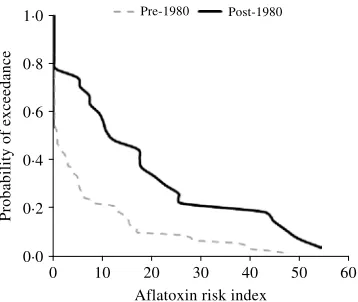
The probability distribution functions of ARI for the pre- and post-1980 periods (Fig. 4) suggested that the probability of ARI being>0 was 0.81 during the post-1980 period whereas it was <0.54 in the pre-1980 period (Fig. 5). While the range of ARI during the two periods was similar, the probability of ARI being>20 was only 0.10 during the pre-1980 period compared with more than 0.33 during the post-1980 period.
The averages of ARI and associated risk factors, including ambient temperature and rainfall, sug-gested almost a three-fold increase in ARI along with increases in maximum and minimum temperatures and decrease in rainfall (Table 2).
In-season monitoring of aflatoxin risk in growers’ fields ARI varied amongst growers and across regions (Table 1). ARI values were>0 for five of the eight growers’ crops. The final in-season aflatoxin risk reports for crops in two paddocks of comparable sowing times and with the same cultivar in mid-November, one at Kumbia and another in Coalstoun Lakes, were chosen for graphic illustration of in-season monitoring undertaken in the 2005/06 in-season to highlight differences that can arise due to location effects (Fig. 6). The ARI of the two crops in the same season (2005/06) reached up to 36 at Kumbia and 100 at Coalstoun Lakes. The increase in ARI was slower and occurred from 132 days after sowing on-ward at Kumbia compared to 106 days after sowing
at Coalstoun Lakes, where about half of the increase in ARI occurred within the first 20 days. Both lo-cations were characterized by terminal drought ; however, the Coalstoun Lakes region experienced warmer soil temperatures and an earlier onset of ter-minal drought. Also, within a location (e.g. Kumbia), ARI differed between growers’ fields depending upon the time of planting and variety (Table 1), which also led to the crop experiencing different end-of-season conditions if their maturity time differed.
Aflatoxin contamination in these farms ranged from 0 to 1600mg aflatoxin/kg, the highest being for a farm in the Coalstoun Lakes region (Table 1). The relationship between ARI and the log transformed aflatoxin content was linear (Fig. 7). The ARI ex-plained 0.92 of the total variation in the aflatoxin content and the relationship was significant (Pf0.01). While the slope of the relationship was significant, the intercept was not, indicating that aflatoxin contamination was likely to be detected when ARI was>0, but unlikely when ARI=0. On the basis of this particular relationship, the unac-ceptable level of aflatoxin (>15mg/kg) was expected to occur when ARI approached 40. The model could generate false positives (i.e. aflatoxin content being 0mg/kg, but ARI simulated >0) or false negatives (significant aflatoxin contamination detected when ARI=0). While false positives could largely be due to inadequate sampling, false negatives could be due to the incorrect input of rainfall or temperature into the model. Site-specific rainfall and soil temperatures re-duce the likelihood of false negatives considerably. The Australian peanut industry considers significant aflatoxin to be more than 8mg/kg although the NACMA standard is 15mg/kg kernel for peanuts as human food. Biologically, any amount of aflatoxin is bad for us and the harmful effects increase with the amount ingested.
D I S C U S S I O N
Earlier studies have shown that the peanut module of the APSIM suite of crop models can simulate pod-yield of peanuts with reasonable accuracy (Hammer et al. 1996 ; Robertsonet al. 2002). Since the module can also estimate the water deficit experienced by the crop, its use in simulating aflatoxin risk and its sub-sequent development as a decision support system (DSS) was explored in the present study. The highly significant relationship between ARI and the ob-served PAPLs delivered by growers to peanut shellers indirectly suggested that the ARI predicted by the model in conjunction with the APSIM peanut module is able to capture the climatic risk of aflatoxin con-tamination with reasonable accuracy. This means that in a given year with a higher average ARI, more contaminated loads can be expected at sheller’s intake points.
60
50
40
30
20
10
0
Aflatoxin risk index
0·0 0·2 0·4 0·6 0·8 1·0
Observed proportion of aflatoxin positive loads
The reliability of the aflatoxin model was more di-rectly supported by a significant relationship between aflatoxin contamination and ARI for 21 sowings in the 2007/08 season. The present results therefore suggest that the modelling framework developed is able to reliably predict the risk of aflatoxin contami-nation posed by prevailing climatic conditions.
Achar & Sanchez (2006) considered temperatures of 27–30xC as the most important factor for mycelial growth and aflatoxin production byA. flavus. There could be other factors, including insects, that could also contribute to some level of aflatoxin contami-nation in field conditions by making them more vul-nerable to Aspergillus invasion (Hill et al. 1983). Currently, the present model does not explicitly ac-count for the direct effects of a number of insects
including E. behrii. Since Aspergillus spp. only ac-cumulate aflatoxin in a very limited range of tem-peratures and soil moistures (Blankenshipet al. 1984 ; Achar & Sanchez 2006 ; Craufurd et al. 2006) and recent investigations suggest that the risk posed by Etiella is also modulated by similar temperatures (Y. S. Chauhan, H. Brier, G. C. Wright & R. N. Rachaputi, personal communication), most of the contribution of Etiella and other insects to aflatoxin risk may be accounted for indirectly. This argument is supported by the close relationship between ARI and observed aflatoxin-positive loads, which could have also included some contribution made by Etiella-damaged pods, over the last 10 seasons (Fig. 3). It is also possible that the severity of foliar diseases, which can alter crop growth and yield of peanut (Naabet al. 2009) and hence possibly soil water use, can also contribute to aflatoxin risk and may not be accounted for by the aflatoxin model. Fortunately, such diseases were not a large problem in the region covered in the present study.
Wet harvesting of a crop could also favour afla-toxin contamination, which could confound the re-lationship between ARI and aflatoxin contamination. In recent years, the development of machines that can invert the crop while digging out the pods in order to achieve better windrow drying, as well as the creation of artificial drying facilities, seem to have reduced this possibility considerably. Artificial and windrow drying was less common in the 1980s and 1990s, which could be the reason for the poorer re-lationship of ARI and aflatoxin-positive loads on a longer-term dataset beginning in the 1977/78 season. Since the 1998/99 season, none of the years have had a wet harvest and windrow drying was more commonly practiced, which would account for
60
50
40
30
20
10
0
Aflatoxin risk index
Year
1891 1896 1901 1906 1911 1916 1921 1926 1931 1936 1941 1947 1951 1956 1961 1966 1971 1976 1981 1986 1991 1996 2001 2006
Fig. 4. A time series of ARI (bars), its 5-yearly moving average (solid line), and average aflatoxin risk (dotted line) from 1890 to 2007.
Pre-1980 Post-1980
1·0
0·8
0·6
0·4
0·2
0·0
Probability of exceedance
0 10 20 30 40 50 60
Aflatoxin risk index
the better relationship between ARI and observed aflatoxin positive loads since that time, as shown in Fig. 3.
The long-term analysis of risk factors of aflatoxin production in the Kingaroy region clearly suggested that temperatures increased and rainfall was re-duced during the post-1980 period, which could be
associated with climate change. The spectre of climate change poses a new challenge to researchers, to look for additional approaches to deal with many harmful organisms that affect many crops (Walters & Fountaine 2009). The application of the peanut afla-toxin model as a research tool suggested that the changed climatic conditions in the Kingaroy region Table 2. Means of ARI and risk factors from 1890 to 2007
Period ARI
Temperature (xC)
Minimum Maximum Rainfall (mm)
All years (1890–2007) 8.6 14.7 27.5 457
1890–1979 (a) 6.1 14.5 27.3 466
1980–2007 (b) 17.0 15.5 27.9 428
Difference (bxa) 10.9 1.1 0.6 x38
S.E.D 1.24 0.15 0.13 13.3
D.F. (n=1) 115 115 115 115
2000
1500
1000
500
0
40
30
20
10
0
Growing degree days
0 50 100 150 200
Days after sowing
0 50 100 150 200
Days after sowing
0 50 100 150 200
Days after sowing
0 50 100 150 200
Days after sowing 1·0
0·8
0·5
0·3
0·0
Fractional available soil water
Soil tempearature (
°
C)
100
75
50
25
0
Aflatoxin risk index
have caused a three-fold increase in risk of aflatoxin contamination. Indeed, in the period prior to 1980, aflatoxin contamination in the dryland production region of Kingaroy was less severe. However, the situation seems to have changed significantly since 1980, which is captured well by the model. Cotty & Jaime-Garcia (2007) have alluded recently to the possibility that climate change could lead to sub-stantially increased levels of aflatoxin contamination. The present study provides supporting evidence that climate change can also affect the quality of food being produced. The study suggests that any systematic change in ARI could also serve well as a reliable indicator of climate change, as discovered when using the aflatoxin model for the Kingaroy region.
The increased frequency of contamination in recent years resulting from the local impact of climate change has made it necessary for growers to adapt to changes occurring in their environments in order to stay profitable. The key steps required for them to adapt will be the need to monitor their crops and harvest them before significant aflatoxin risk occurs, or conversely leave them in the ground to reach full maturity if no risk is present. The strength of the re-lationship between ARI and the PAPLs provided confidence in using ARI as a DSS via its computation on the internet. The key components developed to enable growers to compute ARI ‘ online ’ using the web-based interface were its easy-to-use interactive web-interface and the ability to integrate information from different sources, including growers’ input of rainfall, air and soil temperatures as well as from the
nearest met station in order to run the APSIM model in real time. Since rainfall and soil temperature can vary a great deal between fields, direct input by growers was expected to further increase the accuracy of simulation. The web-interface of the model thus provided peanut growers with a ‘ turnkey ’ option to run the complex APSIM peanut model in order to determine ARI for their individual crops.
The significant positive relationship of ARI with log transformed aflatoxin values measured in eight growers’ crops using the DSS tended to further con-firm that ARI was a reasonably good predictor of the risk faced in their crops, although the relationship tended to be slightly different from that obtained for large-scale and experimental sowings (Fig. 2). The difference in the two relationships could lie in differ-ences in the procedure followed for sampling peanuts for aflatoxin measurement. Growers could only pro-vide a relatively small sample (<5 kg) of pre-cleaned peanuts for the analysis which they set aside during threshing, compared to the large-scale or replicated sampling on which Fig. 2 was based. The difference in the relationships could also be partly due to different degrees of pre-cleaning (removal of immature and high aflatoxin-risk pods that could have been done to varying degrees by some growers in order to obtain a better quality grade, and hence price, at the intake point. The relationship given in Fig. 7 suggests that when ARI is high (e.g. >40), some unacceptable levels of aflatoxin contamination are most likely to be detected. If this can be verified in more growers’ fields, it could assist growers as well as processors to identify crops that are most likely to have been ex-cessively contaminated. This information would be useful to shellers, allowing them to target specific crops for more intensive testing for aflatoxin con-tamination.
In conclusion, the results of the present study sug-gest that the peanut aflatoxin model has proved to be reasonably robust in predicting aflatoxin risk through ARI in diverse Australian environments. As aflatoxin is a worldwide problem, such an approach could be extended globally, but it is not known how the model will perform in other situations or locations. Online availability of daily climatic data in Australia offers a significant advantage for monitoring of aflatoxin risk in near real time using the model as a web-based de-cision support tool, as described in the present paper. The approach adopted takes crop modelling science a step further in that it empowers growers to use crop models to manage the aflatoxin problem in their crops using the internet, even though they have limited knowledge of the model itself. This approach also adds value to climatic data that is collected at weather stations as well as by growers. The use of the model as a research tool to examine the possible impact of climate change on food safety is another significant application that may permit better understanding
0·0 0·5 1·0 1·5 2·0 2·5 3·0 3·5
0 25 50 75 100
Log transformed aflatoxin (µg/kg)
Aflatoxin risk index
Fig. 7. Relationship between ARI and log transformed va-lues of aflatoxin content (LA) in eight growers’ fields during the 2005/06 and 2007/08 seasons in the Kumbia, Wooroolin and Coalstoun Lakes locations. The regression equation for this relationship was LA=0.0327(¡0.004017)rARIx
of global as well as local consequences of climate change.
Special thanks for funding this research go to the Grains Research and Development Corporation (GRDC) through the aflatoxin projects DAQ543 and
DAQ00070, and the Australian Centre for Inter-national Agricultural Research (ACIAR) through project PHT/97/017. We would also like to acknowl-edge and thank PCA for agronomic support and crop statistical information, and the Burnett district growers who cooperated in the study.
R E F E R E N C E S ACHAR, P. N. & SANCHEZ, A. (2006). Effects of substrate and
temperature on growth of Aspergillus flavusin peanuts from Georgia.Georgia Journal of Science64, 76–80. BLANKENSHIP, P. D., COLE, R. J., SANDERS, T. H. & HILL,
R. A. (1984). Effect of geocarposphere temperature on pre-harvest colonization of drought-stressed peanuts by Aspergillus flavus and subsequent aflatoxin contami-nation.Mycopathologia85, 69–74.
BURKE, J. J. & DUNNE, B. (2008). Field testing of six decision support systems for scheduling fungicide applications to controlMycosphaerella graminicolaon winter wheat crops in Ireland. Journal of Agricultural Science, Cambridge146, 415–428.
CHAUHAN, Y. S., WRIGHT, G., RACHAPUTI, N. R., KROSCH, S., ROBERTSON, M., HARGREAVES, J. & BROOME, A. (2007). Using APSIM-soiltemp to simulate soil temperature in the podding zone of peanut. Australian Journal of Experimental Agriculture47, 992–999.
COLE, R. J., SANDERS, T. H., HILL, R. A. & BLANKENSHIP, P. D. (1985). Mean geocarposphere temperatures that in-duce preharvest aflatoxin contamination of peanuts under drought stress.Mycopathologia91, 41–46.
COLE, R. J., SANDERS, T. H., DORNER, J. W. & BLANKENSHIP, P. D. (1989). Environmental conditions required to in-duce preharvest aflatoxin contamination of groundnuts : summary of six years’ research. In Aflatoxin Contami-nation of Groundnut: Proceedings of the InterContami-national Workshop, 6–9 October 1987. Patancheru, AP(Ed. S. D. Hall), pp. 279–287. Patancheru, India : International Crops Research Institute for the Semi-arid Tropics. COTTY, P. J. & JAIME-GARCIA, R. (2007). Influences of
cli-mate on aflatoxin producing fungi and aflatoxin con-tamination. International Journal of Food Microbiology
119, 109–115.
CRAUFURD, P. Q., PRASAD, P. V. V., WALIYAR, F. & TAHERI, A. (2006). Drought, pod yield, pre-harvest Aspergillus infection and aflatoxin contamination on peanut in Niger. Field Crops Research98, 20–29.
DIENER, U. L. & DAVIS, N. D. (1970). Limiting temperature and relative humidity for aflatoxin production by Aspergillus flavus in stored peanuts. Journal of the American Oil Chemists’ Society47, 347–351.
DORNER, J. W. (2008). Management and prevention of my-cotoxins in peanuts.Food Additives and Contaminants A : Chemistry, Analysis, Control, Exposure and Risk Assess-ment25, 203–208.
DORNER, J. W., COLE, R. J., SANDERS, T. H. & BLAKENSHIP, P. D. (1989). Interrelationship of kernel water activity, soil temperature, maturity, and phytoalexin production in preharvest aflatoxin contamination of drought-stressed peanuts.Mycopathologia105, 117–128.
GQALENI, N., SMITH, J. E., LACEY, J. & GETTINBY, G. (1997). Effects of temperature, water activity, and incubation
time on production of aflatoxins and cyclopiazonic acid by an isolate ofAspergillus flavusin surface agar culture. Applied and Environmental Microbiology63, 1048–1053. HAMMER, G. L., SINCLAIR, T. R., BOOTE, K. J., WRIGHT,
G. C., MEINKE, H. & BELL, M. J. (1996). A peanut simulation model. 1. Model development and testing. Agronomy Journal87, 1085–1093.
HENDERSON, C. E., POTTER, W. D., MCCLENDON, R. W. & HOOGENBOOM, G. (2000). Predicting aflatoxin contami-nation in peanuts: a genetic algorithm/neural network approach.Applied Intelligence12, 183–192.
HILL, R. A., BLANKENSHIP, P. D., COLE, R. J. & SANDERS, T. H. (1983). Effects of soil moisture and temperature on preharvest invasion of peanuts by theAspergillus flavus group and subsequent aflatoxin development.Applied and Environmental Microbiology45, 628–633.
HOLADAY, C. E. & LANSDEN, J. (1975). Rapid screening method for aflatoxin in a number of products.Journal of Agriculture and Food Chemistry23, 1134–1136.
KEATING, B. A., CARBERRY, P. S., HAMMER, G. L., PROBERT, M. E., ROBERTSON, M. J., HOLZWORTH, D., HUTH, N. I., HARGREAVES, J. N. G., MEINKE, H., HOCHMAN, Z., MCLEAN, G., VERBURG, K., SNOW, V., DIMES, J. P., SILBURN, M., WANG, E., BROWN, S., BRISTOW, K. L., ASSENG, S., CHAPMAN, S., MCCOWN, R. L., FREEBAIRN, D. M. & SMITH, C. J. (2003). An overview of APSIM, a model designed for farming systems simulation.European Journal of Agronomy18, 267–288.
KLICH, M. A. (2007).Aspergillus flavus: the major producer of aflatoxin.Molecular Plant Pathology8, 713–722. MACKSON, J., WRIGHT, G. C., RACHAPUTI, N. R., KROSCH, S.
& TONKS, J. (2001). Assessing Maturity in Dryland Peanuts:Tips to Decide the Best Time to Cut Peanuts to Minimize Aflatoxin Risk and Maximize Profits. Agdex No 141/637. Croplink Information Series Disease Update, QI01046. Dalby, Australia: Department of Primary Industries.
NAAB, J. B., BOOTE, K. J., PRASAD, P. V. V., SEINI, S. S. & JONES, J. W. (2009). Influence of fungicide and sowing density on the growth and yield of two groundnut culti-vars. Journal of Agricultural Science, Cambridge 147, 179–191.
NACMA. (2003).Agricultural Commodity Standards Man-ual : A Project of the National Agricultural Commodities Marketing Association (NACMA). Wilberforce, NSW, Australia : NACMA.
PARMAR, R. S., MCCLENDON, R. W., HOOGENBOOM, G., BLANKENSHIP, P. D., COLE, R. J. & DORNER, J. W. (1997). Estimation of aflatoxin contamination in preharvest peanuts using neural networks.Transactions of the ASAE
40, 809–813.
aflatoxin contamination in Australian peanuts. Aus-tralian Journal of Experimental Agriculture 42, 595– 605.
ROBERTSON, M. J., CARBERRY, P. S., HUTH, N. I., TURPIN, J. E., PROBERT, M. E., POULTON, P. L., BELL, M., WRIGHT, G. C., YEATES, S. J. & BRINSMEAD, R. B. (2002). Simulation of growth and development of diverse legume species in APSIM. Australian Journal of Agricultural Research53, 429–446.
SILO. (2009). Enhanced Meteorological Data [Online]. Available at : www.longpaddock.qld.gov.au/silo (verified 13 October 2009).
Soil Survey Staff (1975).Soil Taxonomy: A Basic System of Soil Classification for Making and Interpreting Soil Surveys. USDA-NRCS Agriculture Handbook no. 436. Washington, DC : US Government Printing Office. THAI, C. N., BLANKENSHIP, P. D., COLE, R. J., SANDERS,
T. H. & DORNER, J. W. (1990). Relationship between aflatoxin production and soil temperature for peanuts under drought stress. Transactions of the ASAE 33, 324–329.
WALTERS, D. R. & FOUNTAINE, J. M. (2009). Practical application of induced resistance to plant diseases: an appraisal of effectiveness under field conditions.Journal of Agricultural Science, Cambridge147, 525–535. WHITAKER, T. B., DORNER, J. W., GIESBRECHT, F. G. &
SLATE, A. B. (2004). Variability among aflatoxin test re-sults on runner peanuts harvested from small field plots. Peanut Science31, 59–63.
WRIGHT, G. C. & HANSEN, R. B. (1997). Climatic effects on aflatoxin incidence and management in peanuts. In Proceedings of the 2nd Australian Peanut Conference, Gold Coast, Queensland. 1997, pp. 62–65, Australia : Queensland Department of Primary Industries.