Article
Improvement Measures for Bridge Inspection
Efficiency Using Spatial Information Technology
Jae Kang Lee 1,*, Min Jun Kim 1 , Jung Ok Kim2, and Jin Soo Kim31 LX Korea Land and Geospatial informatix Corporation, Spatial Information Research Institute; [email protected], [email protected]
2 Institute of Construction and Environmental Engineering, Seoul National University; [email protected] 3 National Assembly Reseach Service; [email protected]
* Correspondence: [email protected]; Tel.: +82-63-906-5655
Abstract: The economic development and infrastructure of a nation are closely interrelated. In addition, public trust in national infrastructure facilities is closely linked to the preservation of the advantages provided by these facilities to the public. Since the 1970s, Korea has achieved exponential economic growth over a short period of time and the number of infrastructure facilities has increased correspondingly. This compressed economic development has been underpinned by the national infrastructure, whose safety and usability have been excluded from the scope of the development. However, after around 30 years, structural deterioration coupled with general insensitivity to safety in today’s society has considerably reduced public trust in using the infrastructure. Realistically, policies that mainly focus on developing new technologies related to infrastructure construction have led to practical limitations that discourage the development of technologies for maintenance or inspection. Furthermore, current maintenance works face certain limitations caused by various reasons: insufficient budget, increasing number of infrastructure facilities requiring maintenance, shortage of manpower, and rapidly increasing number of aging infrastructure facilities. To overcome these limitations, a new approach is required that is different from general inspection methods under the existing rules and regulations. In this context, this study aimed to explore the efficiency of bridge inspection and maintenance by unmanned aerial vehicles (UAVs) that could observe inaccessible areas, could be conveniently and easily controlled, and could offer high economic benefits. To this end, various tests were performed on elevated bridges, and suitable UAV images were obtained. The obtained UAV images were inspected by using machine vision technology, thereby excluding subjective evaluations by humans. Methods for enhancing the objectivity of the inspection were also discussed. The test results showed that both the efficiency and objectivity of the proposed method were better than those of the existing bridge maintenance and inspection methods.
Keywords: bridge maintenance and inspection; UAVs; machine vision
1. Introduction
Bridges are an important example of SOC(social overhead capital). They are directly related to public safety from a socioeconomic perspective and are critical infrastructure components for transport and logistics, which are integral to economic activities. Recently, in Korea, the level of infrastructure safety perceived by the people has significantly dropped because of natural disasters as well as accidents resulting from human error. Therefore, it is imperative to secure the safety of SOC. In fact, public infrastructure safety is a common concern not only in Korea but also in many other countries that have achieved dramatic economic development over a short period of time. In the case of Korea, infrastructure facilities were built mainly during the 1970s and 1980s, when the compressed economic development occurred. Infrastructure facilities that were built 30 or more years
ago are generally classified as aged infrastructure. A study revealed that aged infrastructure facilities accounted for over 11% of all infrastructure facilities as of 2017 [1, 2]. Therefore, it is clear that the systematic maintenance, repair, and reinforcement of aged infrastructure facilities, which are related to securing the national safety network, are critical problems. So far, good maintenance has kept infrastructure facilities free from accidents. However, going forward, the safety of infrastructure may face considerable risk because of the increasing number of aged infrastructure facilities, greater damage inflicted by natural disasters, and inefficient safety and maintenance works. Therefore, to ensure infrastructure safety, which is essential for building a content society, changes must be promptly predicted in the future and new countermeasures must be developed in response [3-5]. To fulfill this objective, an investigation was conducted with regard to the types and methods of current bridge maintenance works. Based on the abovementioned investigation, an analysis was performed to identify the root cause of the lack of inspection of many infrastructure facilities despite the existence of relevant laws and regulations. Based on the analysis results, the UAV-image-based inspection of infrastructure facilities was discussed as a new approach that is different from the existing inspection methods which are dependent on subjective and naked-eye inspections. The possibility of replacing the conventional inspection methods with the new image-based maintenance method, which is based on key spatial information technologies such as UAV imaging and machine vision, was explored.
2. Current Status of Bridge Inspection Methods
2.1. Consideration of Bridge Maintenance Works
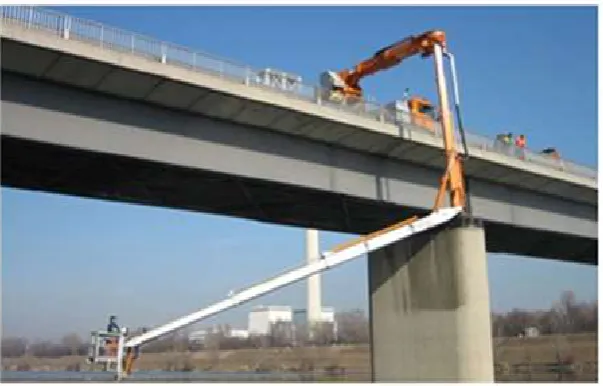
Figure 1. Close inspection using bridge inspection vehicle
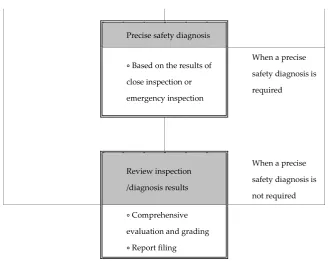
An emergency inspection is conducted when it is considered needed by a managing body or when a managing body is requested to do so by the heads of relevant administrations. The inspection is composed of damage and special inspections. A damage inspection is a nonscheduled inspection designed to immediately check the damage to the infrastructure caused by disasters or accidents. A special inspection is conducted at a level similar to a close inspection and is conducted in cases where a defect such as foundation subsidence or scouring is suspected or where the continuous usability of infrastructure facilities that are restricted from use needs to be assessed. A precise safety diagnosis is conducted when it is considered needed to prevent disasters, ensure safety of infrastructure facilities, etc., by a managing body based on the results of a safety inspection. The purpose of a precise safety diagnosis is to check, analyze, and assess the structural safety, causes of defects, etc.; to identify physical and functional defects in infrastructure facilities; and to adequately and promptly address the problem. In addition, the diagnosis aims to suggest methods for repair and reinforcement. The features of each bridge inspection type are briefly described in Figure 2 [2].
Regular inspection
At least once every 6 months
In cases of emergency (heavy rains, storms, earthquakes, etc.)
Or in cases where abnormalities are found in infrastructure facilities
When a precise
safety diagnosis Close inspection Emergency inspection
is not required
At least once every 2 years
When it is considered needed by a managing body or upon request from the heads of relevant authorities
Precise safety diagnosis
∘ Based on the results of
close inspection or emergency inspection
When a precise safety diagnosis is required
Review inspection /diagnosis results
When a precise safety diagnosis is not required
∘ Comprehensive
evaluation and grading
∘ Report filing
Figure 2. Bridge inspection table
2.2. Practical Limitations in Current Bridge Maintenance Works
As explained above, under the Special Act on the Safety Control of Installations, all bridge infrastructure facilities that correspond to Types 1 and 2 are subjected to inspection depending on the period and methods. In this section, implications from the analysis of the current status of general maintenance works, including inspection, are discussed. This section also presents the study’s background and purpose. Although inspection is mandated by relevant rules and regulations, there are many practical difficulties in complying with these rules and regulations. In this context, three main causes were analyzed through a preliminary investigation, and they are described in detail in the following subsections.
2.2.1. Rapid Increase in Number and Aging of Infrastructure Facilities
Figure 3. Increase in infrastructure facilities
2.2.2. Shortage of Manpower
According to an investigation, the average age of the general workforce in the maintenance sector was 44 years as of December 2016. Because the maintenance of infrastructure facilities is viewed as a “3D (dirty, dangerous, and difficult)” job, it is not easy to recruit new workers. Because of such circumstances, the industry may inevitably face a shortage of manpower once the current workforce reaches the age of retirement. The gap in and shortage of the maintenance workforce by generation in the context of the increasing number of total infrastructure facilities imply that the industry, which is heavily dependent on manpower, is faced with a great challenge.
2.2.3. Increase in Maintenance Costs
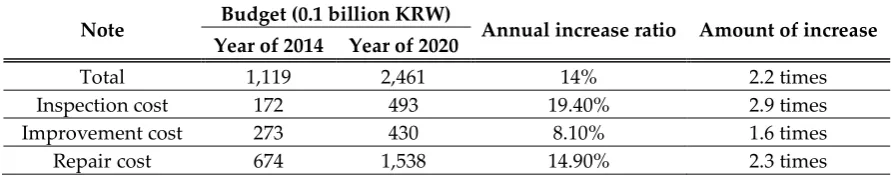
The third cause is attributed to the close interrelation between the industry and national policies. A decrease in the SOC project budgets obviously leads to a decrease in the infrastructure maintenance budget. In contrast, maintenance costs are expected to increase by 14% on average every year (Table 1). In particular, costs for inspection and diagnosis are expected to increase threefold in the next 5 years from KRW 111.9 billion in 2014 to KRW 241.6 billion in 2020. This is the budget estimated according to the increasing number of infrastructure facilities. Despite the current problems because of which an increase in maintenance costs is inevitable, the budgets for national SOC projects are decreasing—KRW 22.5 trillion in 2015 to KRW 21.9 trillion in 2016, which is a decrease of approximately KRW 580 billion [2].
Table 1. Increase in maintenance costs
Note Budget (0.1 billion KRW) Annual increase ratio Amount of increase Year of 2014 Year of 2020
Total 1,119 2,461 14% 2.2 times Inspection cost 172 493 19.40% 2.9 times Improvement cost 273 430 8.10% 1.6 times Repair cost 674 1,538 14.90% 2.3 times
2.2.4. Implications
investigate whether the active utilization of such technologies can be an ultimate solution to the problems described above.
3. Determination of Maintenance Efficiency through UAV Image Analysis and 3D Viewer
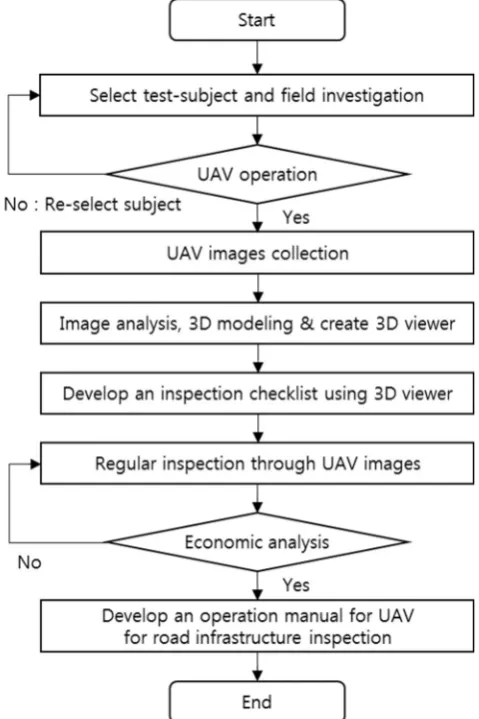
In this section, the possibility of replacing the conventional maintenance methods with new methods using UAV images and maintenance efficiency is discussed. To this end, the selection of study bridges, UAV operation, UAV image processing, and the characterization of a 3D viewer are explained. Figure 4 shows a flowchart of the processes carried out in this study. In addition, details of the test bed used in this study, UAV operation, and image matching are described in detail in this section.
Figure 4. Flowchart for UAV-based bridge maintenance
3.1. Introduction of Test-bed and UAV operation for Use
The test bed (bridge infrastructure) selected for the study was Wonjudaegyo Bridge located in Panbu-myeon, Wonju-si, Gangwondo Province. It was completed in 1995 and was a steel box girder bridge. Of the total of 11 shifts, images were obtained during Shifts 2–4.
Table 2. UAV specifications
Classification Description
Maker/name Leica/Aibot
Actual image
Body specifications
Wing Rotary wing Length × width × height 105 × 105 × 45 cm
Flight time Approximately 25 min
Camera specifications
Resolution 24 MP Maximum image size 6000 × 4000
Takeoff/landing Vertical Gimbal Three-axis Weight 3.4 kg Photographing the
substructure Possible (with an on-top gimbal)
The UAV was operated for two days between November 20 and December 8, 2016, beginning at 8 a.m. each morning. The operation hours of the UAV were within the hours of minimal traffic around the bridge and minimal temperature fluctuation due to sunrise, which could result in the creation of air currents. Around 500 short images were obtained during the 2-h test operation.
3.2. Establishing Flight Plan and Measuring Ground Control Points (GCPs)
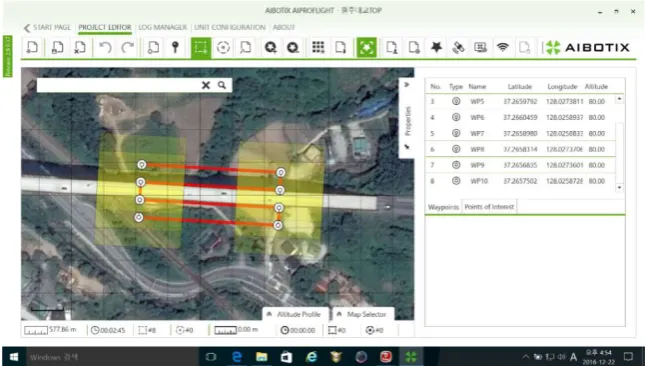
Prior to the operation, the flight trajectory of the UAV was set considering many variables such as the optimal altitude for image recording, camera angle of view, route, duplication rate, and direction of sunlight. In the study, ground control station–based Aibotix software called AiProFlight was used to set the flight route. Figure 5 shows the UAV flight plan setup.
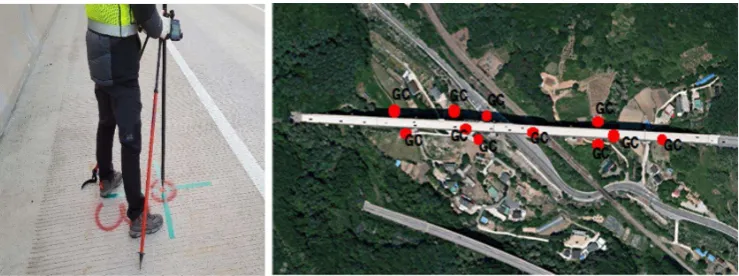
A total of 11 GCPs were installed for the study purpose. Depending on the altitude of the bridge, three GCPs were installed on the bridge deck and the remaining eight were installed directly on the ground below the bridge. The GCPs were measured by VRS (Virtual Reference System) observation according to aerial photogrammetric regulations. Figure 6 shows the installation points of the GCPs and the scene of the installation.
Figure 6. GCP surveying and installation points
3.3. UAV Image Processing
For processing the obtained UAV images, the PIX4D Mapper software was used. For the coordinate system, the international system of WGS94 coordinates was used, and the variable values of the camera used for recording were considered for the processing. Figure 7 shows a flowchart for the general UAV image processing.
Figure 7. Process for image matching
Figure 8. Results of image matching
4. Analysis of Machine-Vision-Based Inspection Items
Next, the study aimed to explore technical measures to improve the efficiency of bridge maintenance and inspection using the obtained UAV images and machine vision technology. To this end, a preliminary investigation was conducted on the outcomes derived from an inspector’s subjective assessment or items recorded in the inspection log. According to the investigation results, the primary items in the bridge inspection included crack detection, white coated analysis, and water leak check. It was confirmed that these items were inspected based on subjective assessment. Image analysis was performed in these three major areas of inspection using machine vision technology— the most used technology in the field of image analysis in recent times. Based on the assumptions that each item of the inspection could be converted into data and information through analysis and that UAV images could be obtained in a regular and consistent manner, it was assumed that automated detection and prediction would be possible through machine learning in the future. This study formed the basic phase of the proposed study plan and aimed to perform the image analysis for each item of inspection subjected to UAV imaging.
4.1. Machine-Vision-Based UAV Image Analysis
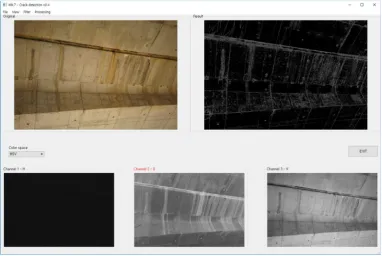
As explained above, a specific software was developed to support the bridge inspection through machine vision technology for short images obtained by the UAV (Figure 9). As of now, this C++
Figure 9. Development of bridge inspection software based on UAV images
This process was mainly divided into two parts. The first part was the extraction of information channels required prior to image analysis, and the second part was the application of the algorithm required to extract candidates for inspection. The first stage of the inspection item (crack, white coated, and water leak) analysis was the conversion of the color format, which was carried out for all the three major inspection items. The Lab color space was formed by nonlinearly converting the CIE XYZ color spaces in accordance with the antagonism theory of human color vision [11]. The Lab color space represents the color space of CIE 1976 Lab and is used by converting the CIE XYZ color space. This is a transformation based on the cubic function, and the Lab color space has a nonlinear relationship with the actual wavelengths of light. In other words, the gap between two different colors is designed to be proportionate to the actual chrominance perceived by human sight. The formal and invert conversion of the Lab color format is as follows:
𝐿∗= 116𝑓 − 16, (1)
𝑎∗= 500 𝑓 − 𝑓 , (2)
𝑏∗= 200 𝑓 − 𝑓 . (3)
Here, 𝑓(𝑡) is as follows:
𝑓(𝑡) = 𝑡
/ 𝑖𝑓 𝑡 >
( ) 𝑡 + , (4) 𝑋 , 𝑌 , 𝑍 are the normalized values of CIE XYZ for the standard white color.
Inverse transformation is performed as follows:
𝑌 = 𝑌 𝑓 (𝐿∗+ 16) , (5)
𝑍 = 𝑍 𝑓 (𝐿∗+ 16) − 𝑏∗ , (7)
𝑓 (𝑡) =
𝑡 𝑖𝑓 𝑡 >
3 𝑡 − . (8)
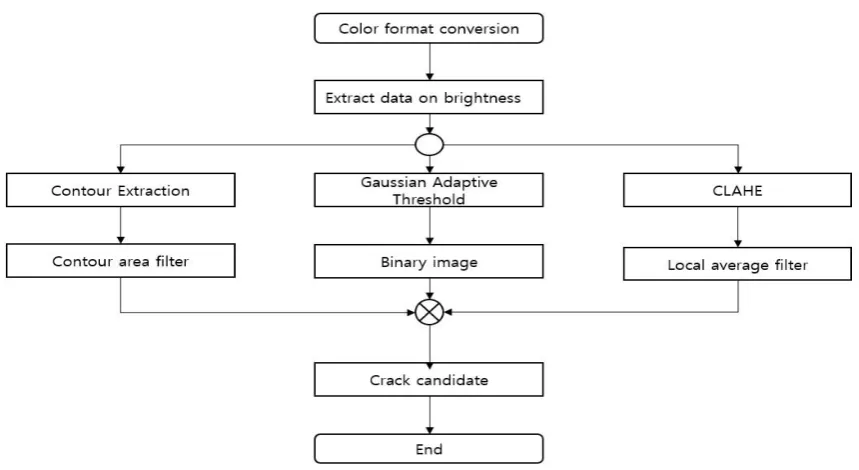
Following the first stage of the analysis performed for the difference in brightness, Gaussian adaptive filtering was applied to extract the priority candidates for each inspection item in relation to these images and the binarization process was carried out subsequently. Binarization is the most solid segmentation method. It is frequently used for dividing an image to extract a desired area or a specific object in the image, making it an adequate method for the application. In the binarization, the original image was converted into a grayscale image, and the background and objects were separated using threshold values. In the application, threshold values were applied to the fixed area of the entire image. The grayscale image was then inputted to scan the entire image. If the pixel value were greater than the threshold value, the pixel value at the same position in the resulting image was designated in white color; else, the value was designated in black color.
4.2. Analysis on Crack Detection
Figure 10. Flowchart for crack detection
value, and the extraction was carried out by setting the data on the contour of the identical area as boundaries. In stage 106, for the extracted area boundaries, when the width of the area was below the threshold value, the detected area was considered to be false or inaccurate (because of noise in the image, etc.) and was then removed. The resulting image is shown in Figure 12. The data for the area extracted through the two stages were used as crack candidate 2.
Figure 11. Data extracted from channel L (luminance)
Figure 12. Resulting image obtained using Gaussian adaptive threshold method
Figure 13. Resulting image obtained by extracting area boundaries
Figure 14. Resulting image obtained after applying local average filter
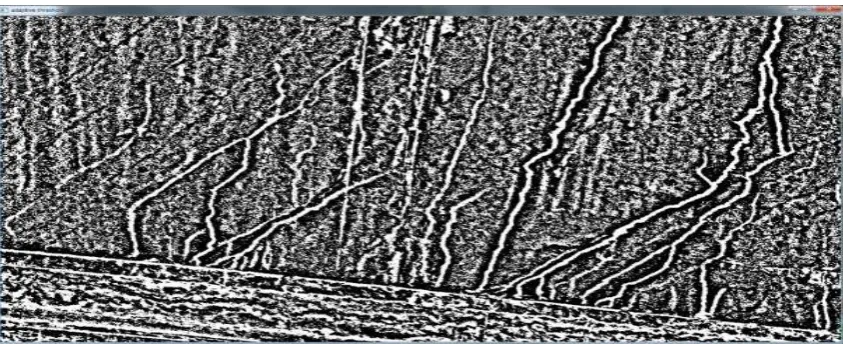
After extracting crack candidates 1, 2, and 3, all the detected intersections in each candidate were measured, and in stage 109, the areas with boundaries equal to or greater than a certain width and the areas with darker brightness values than the surrounding areas were assumed to be cracks.
Figure 15. Resulting image obtained from crack detection
of inspectors and explore such a possibility through comparative analysis. Therefore, only the cracks with a width of 0.5 mm or greater were taken into consideration, and the comparison was carried out only in the quarter span of the lower part of the bridge.
4.3. Analysis on Water Leak
Figure 16. Flowchart for water leak detection
To detect the leak in the image (Figure 16), the data for the brightness channel were used as the primary data, as in the case of the crack detection. The leak area also had a darker brightness value than the other areas. Therefore, to detect the leak area, the channel L data (Figure 17), which indicated the brightness in the Lab color format, were extracted through stages 701 and 702 (Figure 7). The data extracted from channel L were then used in the subsequent stages, i.e., 703 and 705. In stages 703 and 704, the binary images were extracted using the same method used in the crack detection. Darker areas were detected in the binary images to obtain the resulting image, as shown in Figure 18, and were used as leak candidate 1.
Figure 17. Channel L (luminance) data
morphological filter, a filter kernel with a size of 5 × 5 was used. Figure 20 shows the edge image to which the filter was applied and the image was then used as leak candidate 2.
The intersection of the areas detected in leak candidates 1 and 2 was measured, and the leak areas with darker brightness values than the surrounding areas and the edges in the darker areas were detected in stage 707. The resulting image is shown in Figure 21.
Figure 18. Resulting image obtained from Gaussian adaptive threshold method
Figure 19. Resulting image obtained from Canny edge detection
Figure 21. Resulting image obtained from water leak detection
4.4. Analysis on White-Coated(Efflorescence) Detection
Figure 22. Flowchart for white-coated area detection
Figure 23. Channel L (luminance) data
Figure 24. Resulting image obtained from Gaussian adaptive threshold method
Figure 26. Resulting image from white-coated detection
4.5. Benefit-Cost Analysis and Implications
The computer vision technology described above could be effectively applied to bridge inspection [12]. This result was confirmed by field technicians performing on-site inspection, but the number of technicians was not sufficiently large to quantify the result. Accordingly, further study is required to validate the technology.
The study results show that the proposed UAV image acquisition and analysis method for inaccessible bridge members overcomes the limitations of the existing bridge inspection methods and thus may successfully replace them. To confirm this possibility, a cost-benefit analysis was performed, whose details are listed in Table 3.
Table 3. Details of cost-benefit analysis Work
process Method Duration No. of staff Cost
Pylon
inspection methods Existing 1 day 3–4
Labor cost (4 staff): KRW 600,000/day
Equipment rental cost (18-ton crane): KRW 1 million/day
Drone 2 h 2 Labor cost (2 staff): KRW 400,000/day
Equipment rent and photographing: KRW 500,000–1 million/day (depending on work conditions)
Pier
inspection methods Existing 2 days 3–4
Labor cost (4 staff): KRW 600,000/day
Equipment rental cost (18-ton crane): KRW 1 million/day
Drone 4 h 2 Labor cost (2 staff): KRW 400,000/day
Equipment rent and photographing: KRW 1 million/day (depending on work conditions)
Bridge bearing inspection
Existing
methods 3 h 5–6
Labor cost (4 staff): KRW 600,000/day
Equipment rental cost (bridge inspection car): KRW 1.5 million/day
Drone 1 h 2 Labor cost (2 staff): KRW 600,000/day
Equipment lease: KRW 1 million/day (depending on work conditions)
bridge, our analysis might produce many unavoidable differences. When an elevated bridge is inspected, inaccessible members like the pylon, pier, and bridge bearing always require an inspection car and a crane. The cost for existing methods that use such equipment is two or three times that for the drone-based inspection method, and the existing methods also require more working hours. Moreover, as the UAV system is easier to transport and install, two or more bridges can be inspected in a single day, thereby boosting the advantages of the drone-based method.
5. Conclusions
The aim of this study was to enhance the efficiency of bridge maintenance and inspection. Korea is facing the problem of simultaneous deterioration of many infrastructure facilities because of its compressed economic growth. The shortage of manpower for maintenance and inspection is also aggravating the situation. In addition, the corresponding budget is continuously decreasing along with its reducing importance in policy agendas. Considering this background, the current maintenance and inspection methods have clear limitations, which undoubtedly threaten public safety. This study considered the use of a UAV, which has advantages in terms of economy, convenience, and data acquisition in inaccessible areas, as an alternative to the existing methods. We selected Wonjudaegyo Bridge as the test bed and used a rotary-wing UAV named Aibotix, which is manufactured by Leica. The images obtained by the UAV were displayed in a 3D viewer after an image matching process. Thus, the maintenance work could be carried out from any location. Machine vision technology, which is currently one of the most remarkable image analysis technologies, was applied to inspect the matched images. Crack detection, efflorescence analysis, and leak check were carried out, and the results were analyzed based on the bridge inspection list. We also developed software that included functions for each element technology to monitor the UAV-based maintenance and inspection of bridges. Finally, a cost-benefit analysis was performed to compare the UAV-based inspection method with existing methods. The proposed UAV-based method was found to be better in terms of economy, convenience, and objectivity.
Acknowledgments: This research was supported by a grant [MOIS-DP-2015-03] through the Disaster and Safety Management Institute funded by Ministry of the Interior and Safety of Korean government.
Author Contributions: Jae Kang Lee and Min Jun Kim originated this work and prepared the manuscript; Jung Ok Kim designed the experiments and contributed to the theory studies; improve the quality of this work. All authors reviewed the manuscripts.
Conflicts of Interest: The authors declare no conflict of interest.
References
1. Park, K.H.; Sun, J.W. Development of real-time bridge inspection application connected with bridge management system. Journal of the Korea Academia-Industrial cooperation Society 2015, 16, 7893-7901, DOI: 10.5762/KAIS.2015.16.11.7893.
2. Park, K.H.; Sun, J.W. Development of bridge life-cycle management system based on information and communication technology. Journal of the Korea Academia-Industrial cooperation Society 2016, 17, 13-20, DOI: 10.5762/KAIS.2016.17.10.13
3. Metni, N.; Hamel, T. A UAV for bridge inspection: visual servoring control law with orientation limits. Automation in Construction 2007, 17, 3-10, DOI: 10.1016/j.autcon.2006.12.010.
4. Oh, J.; Jang, G.; Oh, S.; Lee, J.H.; Yi, B.; Moon, Y.S.; Lee, J.S.; Choi, Y. Bridge inspection robot system with machine vision. Automation in Construction 2009, 18, 929-941, DOI: 10.1016/j.autcon.2009.04.003.
5. Mohan, A.; Poobal, S. Crack detection using image processing: a critical review and analysis, Alexandria Engineering Journal 2017, in press, DOI: 10.1016/j.aej.2017.01.020.
6. Prasanna, P.; Dana, K.; Gucunski, N.; Basily, B. Computer vision based crack detection and analysis. In Sensors and Smart Structures Technologies for Civil, Mechanical, and Aerospace Systems 2012, 8345, 834542, DOI: 10.1117/12.915384.
8. Li, G.; He, S.; Ju, Y.; Du, K. Long-distance precision inspection method for bridge cracks with image processing. Automation in Construction 2014, 41, 83-95, DOI: 10.1016/j.autcon.2013.10.021.
9. Adhikari, R.S.; Moselhi, O.; Bagchi, A.; Rahmatian, A. Tracking of defects in reinforced concrete bridges using digital images, Journal of Computing in Civil Engineering 2016, 30, 04016004, DOI: 10.1061/(ASCE)CP.1943-5487.0000566.
10. Li, G.; Zhao, X.; Du, K.; Ru, F.; Zhang, Y. Recognition and evaluation of bridge cracks with modified active contour model and greedy search-based support vector machine. Automation in Construction 2017, 78, 51-61, DOI: 10.1016/j.autcon.2017.01.019.
11. Wikipedia Lab color space. Available online: https://en.wikipedia.org/wiki/Lab_color_space (accessed on 16 March 2018).