Characterisation of Colloidal Particles in Seawater by Light Scattering
Techniques
Gireeshkumar Balakrishnan*, Fabienne Lagarde, Christophe Chassenieux, Taco Nicolai
IMMM UMR-CNRS6283, Le Mans Université, 72085 Le Mans Cedex 9, France.
*Corresponding author:
Dr. Gireeshkumar Balakrishnan
Postal address :IMMM UMR-CNRS6283, Le Mans Université, 72085 Le Mans Cedex 9, France.
Email address:[email protected]
ABSTRACT
Static (SLS) and dynamic (DLS) light scattering techniques are assessed for their capacity to
detect colloidal particles with diameters between d = 0.1 and 0.8 µm at very low concentrations
in seawater. The detection limit of the apparatus was determined using model monodisperse
spherical polystyrene latex particles with diameters 0.2 µm and 0.5 µm. It is shown that the
concentration and size of colloids can be determined down to about 10-6 g/L. Seawater obtained
from different locations in western Europe was characterized using light scattering. It was found
that seawater filtered through 0.45 µm pore size membrane filters was within the experimental
error the same as that of ultrapure Milli-Q water containing the same amount of sea salt and no
colloids could be detected with DLS. When the seawater was filtered through 0.8 µm pore size
filters, colloidal particles were detected. The measurements show that the concentration of
colloids in the seawater samples is not higher than 10-6 g/L and that they have an average
KEYWORDS. Nanoplastics, nanoparticles, seawater, colloids, static light scattering, dynamic
light scattering
INTRODUCTION
The fate of plastics that are dumped in the sea is currently attracting much attention1.
When discharged in the environment, plastics undergo mechanical (erosion, abrasion), chemical
(photo-oxidation under UV radiation, hydrolysis) and biological (degradation by
microorganisms) actions 1-6, which leads to ageing and fragmentation of macroplastics into
microplastics defined as plastic particles smaller than 5 mm 7. Microplastics were found to be
ubiquitous in the environment and in particular on the surface of the oceans. One important issue
that has recently emerged is whether microplastics continue to fragment into colloidal particles
with a diameter d < 1 µm that were called nanoplastics8, 9 although in general particles are
considered as nanoparticles only if they are smaller than 100 nm in at least one dimension.
Gigault et al.8 investigated the release of nanoplastics under UV light from weathered
polyethylene and polypropylene fragments sampled from the environment. They observed that
nanoplastics with a broad range of sizes were produced over a period of weeks. More recently,
Ter Halle et al.10 investigated seawater collected near the surface of the North Atlantic
subtropical gyre. The seawater was filtered through 1.2 µm pore size filters, and the filtrate was
inspected for the presence of nanoplastics with dynamic light scattering. Particles with diameters
suggested that these particles were mostly nanoplastics formed by degradation of microplastic,
but the authors did not provide an estimate of the concentration of nanoplastics in the seawater.
The presence of such small particles raises questions about their environmental
concentration and their potential accumulation in the trophic chain. Indeed, due to their small
size and specific properties, nanoplastics can be ingested by a very large range of aquatic
organisms and can interact with membranes and cells4. Nanoplastics dispersed in the seawater
could be part of the 'lost plastic' that has been dumped in the sea, but is no longer observed at the
surface 5, 11. Detection and quantification of nanoplastics in all aquatic compartments are,
therefore, an urgent need. A major difficulty is that even though the total amount of plastic in the
sea is huge, the concentration of nanoplastics in seawater is still expected to be very low.
It is possible to characterize the size and shape of individual nanoplastics using
microscopy12, but it is difficult to quantify their concentration and average size distribution.
Static and dynamic light scattering techniques have the potential to yield both the average size
and the concentration of colloidal particles even if they are present in very low concentrations.
The aim of the investigation reported here was twofold. First, we critically assess the potential of
these light scattering techniques to quantify the concentration and size distribution of model
nanoplastics in the form of polystyrene latex particles with d < 0.8 µm dispersed in seawater.
After a brief review of the relevant light scattering theory aimed for researchers that are not very
familiar with the technique, we will compare theoretical with experimental results on these
model nanoplastics in order to demonstrate the limits of the technique for current state of art light
scattering equipment. Then we will discuss light scattering measurements on seawater sampled
at different places near the coast of Western Europe. We show that the concentration of colloids
concentration of colloids with 0.45 < d < 0.8 µm is approximately 10-6 g/L and can be
characterized if care is taken. Of course, colloids that are detected in seawater do not necessarily
consist of plastic as mineral colloids are expected to be present. We will mention in the
Discussion section how the light scattering results depend on the type of material.
THEORY
Here we briefly resume the theory of static and dynamic light scattering techniques as
they are applied for the characterization of dilute colloidal particle suspensions. For more
detailed information about the techniques see refs 13-18
Static light scattering
Light scattering results are often expressed in terms of the Rayleigh ratio (Rθ), which is
related to the scattered light intensity (I) in dilute solutions as follows:
R = (1)
where Ii and Isol are intensities of the incident light and the light scattered by the solvent,
respectively, R is the distance between the scattering volume and the detector and V is the
scattering volume. We are considering here that the incident light is vertically polarized, which is
the case for most modern light scattering equipment. As it is often difficult to determine with
precision R and V, one measures the intensity relative to a standard with known Rθ taking into
consideration that V depends on the refractive index (n) of the medium.
where Ist, Rst and nst are the scattering intensity, the Rayleigh ratio and the refractive index of the
standard. For simplicity, we will assume here the Rayleigh-Gans approximation, which is valid
for dispersed particles smaller than the wavelength of the incident light (λ) or with a refractive
index very close to that of the solvent. In this case, Rθ is related as follows to the molar mass (M)
and weight concentration (C) of the dispersed particles:
R = K. C. M. S(q) (3)
where K is an optical constant that depends on the refractive index increment (n/c) and λ :
K = 4π n ( ) /λ N (4)
with Na Avogadro's number. S(q) is the structure factor and describes the dependence of the
scattering intensity on the scattering wave vector (q). The latter depends on the angle of
observation (θ) at which the experiment is done:
q = sin( ) (5)
For very dilute solutions that we are considering here, S(q) depends only on the shape of the
particles, e.g. for homogeneous spheres of diameter d:
S(q) = 3 (sin( ) − cos( ))/( ) (6)
For particles of any shape the initial q-dependence of S(q) can be expressed as a series expansion
in terms of the radius of gyration (Rg):
Notice that S(q)=1 for qRg<<1 so that one can determine M by extrapolation to q=0 for any
particle.
So far we considered only monodisperse spherical particles. If the suspension contains
particles with a range of sizes, the total scattering intensity is simply the integral of the
contribution by particles of each size:
R = K ∫ C(d)M(d)S(q, d)δd (8)
In this case, one obtains the weight average molar mass M = ∫ C(d)M(d)δd/C)at q→0
independent of the shape of the particles.
As was mentioned above, the Rayleigh-Gans approximation is valid only for particles
much smaller than λ or with a refractive index close to that of the solvent. If this is not the case,
the Mie theory needs to be used. Routines that calculate the q-dependent scattering intensity for
spherical particles using the Mie theory are freely available on the internet, e.g.
http://www.philiplaven.com/mieplot.htm.
Dynamic light scattering
With DLS one determines the correlation between the intensity at a given time with that
at a delay time (t) later. The average over many starting times yields the normalized
autocorrelation function of the scattered light intensity:
g2(t) is related to the normalized electric field autocorrelation function (g1(t)) through the
so-called Siegert relation:
𝑔 (𝑡) − 1 = 𝛽 𝑔 (𝑡) +⟨ ( )⟨ ⟩ ( )⟩ (10)
The prefactor β is smaller than unity and depends on the optical set-up. The second term in Eq.10
reflects the fluctuation in the number of particles (N) that are present in the scattering volume.
For a dilute suspension of monodisperse particle with q.d<1, g1(t) decreases exponentially:
g (t) = exp ( ) (11)
with a relaxation time 𝜏 that is related to the diffusion coefficient of the particles (D):
τ = (Dq ) (12)
The diffusion coefficient of spherical particles is related to their diameter and the solvent
viscosity ():
D = (13)
where k is the Boltzman constant and T is the absolute temperature. The same relationship can
be used to calculate a hydrodynamic diameter (dh) of particles of any shape. If q.dh > 1 one needs
to consider rotational motion and internal dynamics unless the particles are spherical, rigid and
homogeneous.
If the suspension contains particles with different size, the autocorrelation function
determined by DLS is the integral of exponential decays corresponding to each size with
g (t) = ∫ A() exp ( ) δ (14)
By fitting g1(t) to Eq.14, it is possible to determine the relaxation time distribution and the
corresponding size distribution of the particles in the suspension. It is important to realize though
that for a given mass concentration and if q.d<1, larger particles carry a stronger weight in the
average, because they scatter more light. If q.d<1 for all particles the average relaxation time
corresponds to the z-average hydrodynamic diameter. In practice, most often the average of the
relaxation rate (τ ) is used to calculate the z-average hydrodynamic diameter dhz:
d = ∫ C(d )M(d )d δd /(CM ) (15)
The current state of the art DLS equipment allows one to determine autocorrelation
functions over a very broad range of delay times. Therefore it should be straightforward to
determine the size of nanoplastics with DLS as long as the particle concentration is sufficiently
high so that the intensity scattered by the particles is in excess of that of water. However, when
the concentration is very low one needs to consider the fluctuation in the number of particles that
are present in the scattering volume, see Eq. 10. The number of particles in V is N= C.V.Na/M
with 𝑉 ≈ 0.3 mm3 for the apparatus used in experiments described below. We may consider that
the effect is negligible if N > 30, which is the case if C > 5 x 10⁻⁷ g/L for d = 0.2 µm and C ≥ 10-5
g/L for d = 0.5 µm, assuming spherical particles with density ρ = 1 g/cm3.
For monodisperse, rigid, homogeneous, spherical particles the relaxation time does not
depend on q. However, this is not true for polydisperse samples, because the relative intensity
particles, the measured value of dh increases with decreasing q until q is smaller than the inverse
MATERIALS AND METHODS
Materials
Model polystyrene latex particles with diameter d = 0.2 µm (Thermofisher, catalog
number: 5020A) and d =0.5 µm (Polysciences, catalog number: 15700) were used as received.
According to the provider, the 0.5-micron particles are negatively charged due to the presence of
carboxylate groups on the particle surface, whereas the 0.2-micron particles contain a trace
amount of surfactant to inhibit aggregation. The density of the polystyrene particles was given by
the provider as 1.05 g/ml. The solid content of the latex suspensions was 10 wt% and 2.5 wt%
for d = 0.2 µm and d = 0.5 µm, respectively. Particle suspensions were prepared by dilution with
salt-free Milli-Q water at different concentrations: C = 10-3, 10-4, 10-5 and 10-6 g/L.
Samples of seawater (about 2 L) were taken by hand near the surface at different
locations near the coast of France, Spain, and the Netherlands; Roscoff (48°43'35.9"N
3°58'57.0"W), Challans (47°03'49.4"N 2°00'41.2"W), Toulon 43°07'15.8"N 5°55'28.1"E),
(Lanzarote (28°57'23.8"N 13°33'16.6"W) and Wassenaar (52°08'55.5"N 4°19'46.6"E) in plastic
or glass bottles that had been extensively rinsed with the same seawater. At one of these
locations (Toulon), seawater was taken both near the surface and, by divers, at a depth of 10 m.
The samples were filtered through Acrodisc nylon membrane filters with pore sizes of 0.45 µm
or MF-Millipore cellulose ester membrane filters with pore sizes of 0.8 µm. No colloidal
particles could be detected with DLS in Milli-Q water filtered through 0.45 µm pore size filters.
When colloid free Milli-Q water was filtered through the 0.8 µm filters colloidal particles were
detected by static and dynamic light scattering. A number of other commercial filters were tested
(Acrodisc glass membrane filters (1µm), Whatman poly (ether sulphone) membrane filters (0.8
µm), Whatman glass fiber filter (1.5 µm)), but they released more particles and were therefore
discarded. We have tested the retention of the particles smaller than the pore size by comparing
the scattering intensity of latex particles before and after filtration and found it to be negligible.
In addition, we did not find that the scattering intensity decreased further if filtered solutions
were filtered a second time.
Methods
Dynamic and static light scattering measurements were done using a commercial
apparatus ALV/CGS3 (ALV-Langen, Germany). The light source was a He-Ne laser with
wavelength λ = 632 nm. The temperature was controlled by a thermostat bath to 20 ± 0.2 °C.
Measurements were made at angles of observation (θ) between 13 and 150 degrees. Intensity
autocorrelation functions were obtained using a digital multi-tau correlator. We have used
toluene as the standard for which R=1.3510-5 cm-1 at λ = 632 nm.
Results
Model particles
We tested the limitations for static and dynamic light scattering measurements for our
equipment with monodisperse polystyrene latex particles with d = 0.2 µm and d = 0.5 µm. Figure
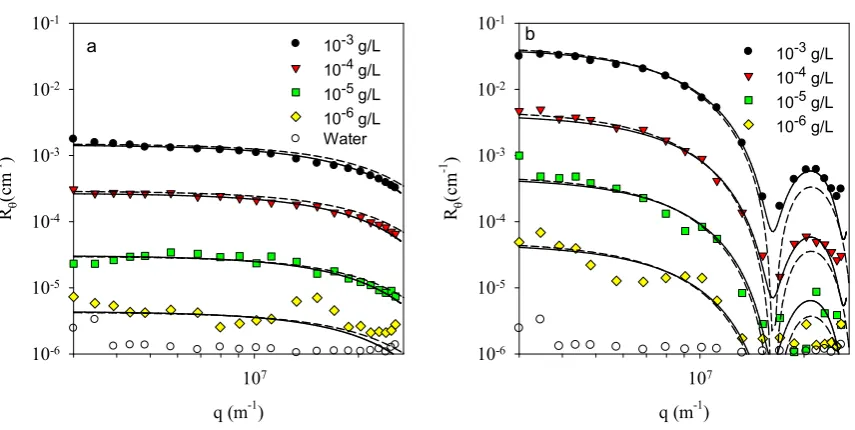
1 shows Rθ as a function of q for the aqueous latex suspensions at C = 10-3, 10-4, 10-5 and 10-6
g/L. For comparison we also show the results for pure Milli-Q water. From the density and the
2.3x10¹¹, 2.3x10¹⁰, 2.3x10⁹ and 2.4x10⁸ particles per liter for d = 0.2 µm and 1.5x10¹⁰, 1.5x10⁹,
1.5x10⁸, 1.5x10⁷ p/L for d = 0.5 µm. The dashed lines in Figure 1 represent fits to Eq. 3 and Eq.
6 with d = 0.2 µm and d = 0.50 µm, whereas the solid lines represent fits to the Mie theory. The
Rayleigh-Gans approximation (Eq. 3) gave similar results for the smaller particles, but the Mie
theory described the experimental results better for the larger particles at higher q-values. The
experimental values of Rθ for pure water found in this investigation are in good agreement with
the value reported in the literature19 and is shown for comparison in Figure 1a.
It is important to realize that as a consequence of the steep decrease of Rθ with increasing
q for q > d-1 suspensions of the smaller particles actually scattered more light for q > 2x10⁷ m-1
than those of the larger particles at the same concentration. The scattering intensity of the smaller
latex suspension was much larger than that of water down to C = 10-5 g/L over the whole
accessible q-range. However, Rθ of the larger latex suspension at C = 10-5 g/L approached that of
water at the highest q-values. As a general feature, the scattering intensity by suspensions of
homogeneous spherical particles at a fixed mass concentration increases with increasing size for
q.d << 1, but decreases for q.d > 1 as can be clearly seen from Figure 1. At a given value of q
and C, R is largest for particles with d 2/q. It is, therefore, necessary to do light scattering
measurements at small q-values if very low concentrations of large particles are investigated.
This is illustrated here for particles with d = 0.5 µm for which the scattering intensity is close to
that of water at C 10-5 g/L if q > 2×10⁷ m-1, i.e. if > 70°, but at smaller angles they still scatter
q (m-1) 107 R cm -1 ) 10-6 10-5 10-4 10-3 10-2 10-1
10-3 g/L
10-4 g/L
10-5 g/L
10-6 g/L
Water
a
q (m-1) 107 R cm -1 ) 10-6 10-5 10-4 10-3 10-2 10-1
10-3 g/L
10-4 g/L
10-5 g/L
10-6 g/L
b
Figure 1. Dependence of the Rayleigh ratio on the scattering wave vector for suspensions of latex particles with d = 0.2 µm (a) or d = 0.5 µm (b) at different concentrations. The dashed and
solid lines represent fits to Eq. 3 and Eq. 6 and the Mie theory, respectively.
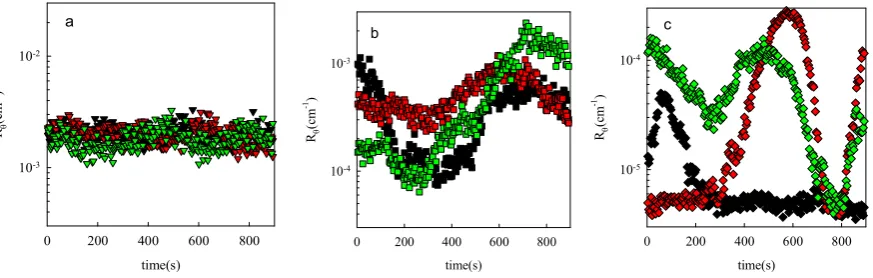
As was mentioned above, if the number of particles in the scattering volume (N) is not
large one needs to consider the fluctuation of N in time due to diffusion of particles in and out of
the scattering volume, see eq.10. This effect can be clearly seen from the time dependence of the
intensity at different concentrations. Figure 2 shows examples of R as a function of time for the
larger latex particles at C = 10-4, 10-5 and 10-6 g/L at q = 3.9 ×10⁶ m-1 (=17°). For each solution,
three measurements were done for a duration of 15 min. The average value of R decreases in
proportion to the concentration, but slow fluctuations became significant for C = 10-5 g/L and
were more important for C = 10-6 g/L. The scattering volume of the apparatus used here was
approximately 0.3 mm3. The average number of particles in this volume was 45 at C = 10-5 g/L
explains why the fluctuations in R are very slow. As a consequence, one needs to average over
very long time periods to obtained accurate averages.
time(s)
0 200 400 600 800
R (c m -1) 10-3 10-2 a time(s)
0 200 400 600 800
R (c m -1) 10-4 10-3 b time(s)
0 200 400 600 800
R (c m -1) 10-5 10-4 c
Figure 2. Time dependence of R for suspensions of latex particles (d = 0.5 µm) at C = 10-4 (a),
10-5 (b) and 10-6 (c) g/L at q = 3.9 ×10⁶ m-1 (=17°). Three measurements are shown for each
concentration.
Dynamic light scattering measurements could not be done reliably for suspensions of the
larger latex particles at C = 10-6 g/L, because the average number of particles in the scattering
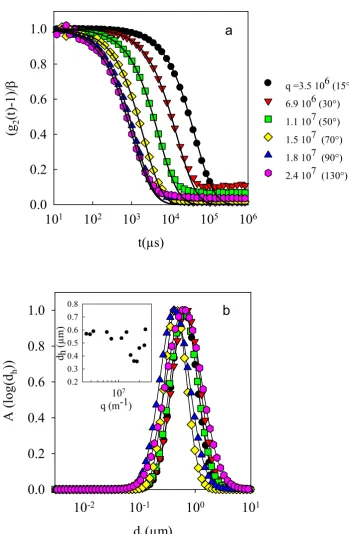
volume was too low to obtain reliable results. Figure 3a shows intensity autocorrelation functions
obtained at different scattering vectors for latex particles with d = 0.5 µm at C = 10-5 g/L. The
correlation functions were analyzed using Eq. 14 assuming a log-normal size distribution. The
solid lines in Figure 3a represent the fit results, and the corresponding size distributions are
shown in Figure 3b. The q-dependence of the z-average hydrodynamic diameter is shown as an
inset of Figure 3b. Even at this low concentration, the dhz values found with DLS were within
fluctuation of the number of particles in the scattering volume discussed above that causes an
additional slow relaxation time at very low particle concentrations. This problem was much
exacerbated at C = 10-6 g/L and is the reason why no reliable DLS results could be obtained for
t(µs)
10
110
210
310
410
510
6(g
2(t
)-1)
/
0.0
0.2
0.4
0.6
0.8
1.0
q =3.5 106 (15°) 6.9 106 (30°) 1.1 107 (50°) 1.5 107 (70°) 1.8 107 (90°) 2.4 107 (130°)
a
d
h(µm)
10
-210
-110
010
1A
(
lo
g(
d
h))
0.0
0.2
0.4
0.6
0.8
1.0
b
q (m-1) 107d h (
angles are indicated in brackets. The solid lines represent fit results to Eq. 14. b) Distributions of the hydrodynamic diameter corresponding to the fit results shown in figure 3a. The inset shows
the z-average hydrodynamic diameter as a function of q.
Colloidal particles in seawater
The capacity to detect and characterize colloidal nanoplastics in seawater was tested by
investigating samples of seawater. The seawater was filtered through 0.8 µm or 0.45 µm pore
size filters in order to assess the presence of particles smaller than 0.8 µm and smaller than 0.45
µm separately. This is necessary, because the presence of a small amount of large particles can
hide the light scattering signal from small particles. Figure 4 shows the q-dependence of Rθ in
comparison with that of Milli-Q water to which sea salt was added at the concentration found in
the sea. As expected, adding sea salt caused a small increase of the scattering intensity with
respect to pure water shown Figure 1a19.
The amount of light scattered by seawater filtered through 0.45 µm pores was within the
experimental error the same as for salted milli-Q water over the whole q-range. Considering
results obtained on model latex particles discussed in the previous section, such a result would be
obtained for suspensions of latex particles with d = 0.2 µm only if C < 10-6 g/L and for particles
with d = 0.5 µm only if C < 10-7 g/ L. The implication is that the concentration of particles in this
sample of seawater with d between 0.2 and 0.45 µm was less than 10-6 g/L, where we assume
that the refractive index increment and the density of the particles are close to that of
polystyrene, which is the case for most types of nanoplastics. Of course, this does not exclude
scattering intensity of very dilute suspensions of particles with d = 20 nm is a thousand times less
than for d = 0.2 µm at the same mass concentration.
q (m-1) 107
R
cm
-1 )
10-6
10-5
10-4
salted water seawater 0.45 µm seawater 0.8 µm surface seawater 0.8 µm 10 m
Figure 4. Dependence of the Rayleigh ratio on the scattering wave vector for seawater filtered using different pore sizes. For comparison, the results for Milli-Q water with added sea salt are
also shown. The solid lines represent a fit to Eqs 3 and 6 with d = 0.6 µm.
The time averaged value of R of seawater filtered through 0.8 µm pores was much larger
and decreased strongly with increasing q, which shows that it was dominated by the scattering
from large particles. The solid line through the data represents a fit to monodisperse spherical
between 0.45 and 0.8 µm not more than 10-6 g/L assuming that their refractive index and density
are close to that of polystyrene. Results obtained with seawater sampled at different locations
and different depths were similar.
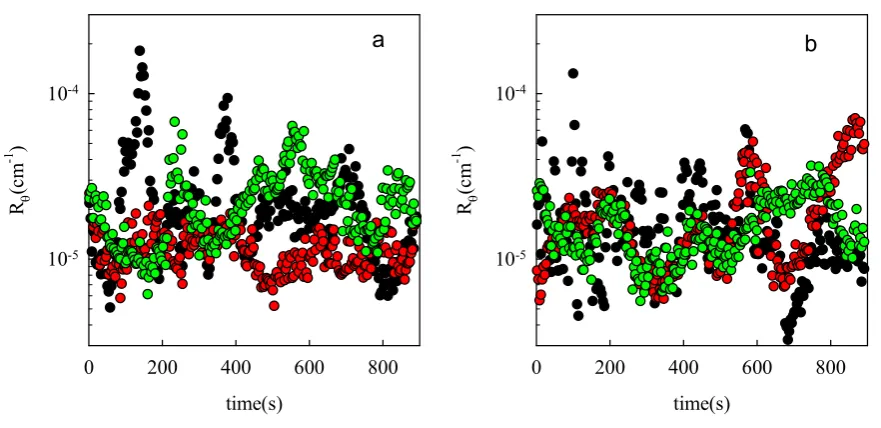
Figure 5 shows the scattering intensity as a function of time of seawater filtered through
0.8 µm pores taken at the surface and a depth of 10 m. Rθ fluctuated slowly with time, indicating
that the number of particles in the scattering volume was not large, as was discussed above.
However, the average value of Rθ was the same at the two different depths. Results obtained with
seawater samples taken at the surface of other locations were similar.
time(s)
0 200 400 600 800 R
(c
m
-1 )
10-5
10-4
a
time(s)
0 200 400 600 800 R
(c
m
-1 )
10-5
10-4
b
Figure 5. Time dependence of R at q = 3.9 ×10⁶ m-1 (=17°) for suspensions of seawater
filtered through 0.8 µm pore size filters taken at the surface (a) and 10m depth (b). Three
Autocorrelation functions of seawater filtered with pore size 0.45 µm did not show
significant relaxation with (g2(t)-1) 0 for t > 1 µs. This is expected as the scattering by seawater
is caused by density fluctuations and diffusion of ions, which relax on timescales shorter than 1
µs. Figure 6a shows examples of normalized intensity autocorrelation functions obtained at
different scattering angles for seawater filtered with pore size 0.8 µm. Notice that results
obtained at higher scattering angles were not trustworthy, because the scattering intensity was
close to that of seawater, see figure 4. The correlation functions show a well-defined fast decay
followed by an ill-defined slow decay. The fast decay is due to diffusion of particles, whereas the
slow decay is caused by fluctuations of the number of particles in the scattering volume.
Figure 6. a) Normalized intensity autocorrelation functions at different scattering wave vectors obtained for seawater filtered through 0.8 µm pores. The solid lines represent fit results to Eq.
14. b) Distributions of the hydrodynamic diameter corresponding to the fit results shown in time (µs)
101 102 103 104 105 106 107 108
(g2 (t )-1) / 0.0 0.2 0.4 0.6 0.8
1.0 q=3.5x10⁶ (15°)
3.9x10⁶ (17°)
5.7x10⁶ (25°)
8x10⁶ (35°)
15x106 (70°)
a
dh(µm)
10-3 10-2 10-1 100 101 102
A ( lo g( dh )) 0.0 0.2 0.4 0.6 0.8 1.0
q (106 m-1) 0 5 10 15 20
d h (
The fast decay was analyzed in terms of a relaxation time distribution that was converted
into a distribution of dh. The fit results are shown as solid lines in Figure 6a, and the
corresponding size distributions are shown in Figure 6b. In most cases, z-average hydrodynamic
diameters between 0.6 and 0.8 µm were obtained consistent with the diameter obtained from
fitting the structure factor (0.6 µm). The relatively weak dependence of dh on q implies that the
particles were roughly spherical and not very polydisperse, but the structure factor shows that
they are not perfect monodisperse spheres either. Notice that the size distribution extents to sizes
larger than the pore size. The reason is that the analysis method gives a distribution of sizes even
if the particles are monodisperse. This can be clearly seen from the results on monodisperse latex
particles shown in the previous section. The average diameter does, however, corresponds to the
true average diameter. A second reason why the distribution extents to larger values than the
nominal pore size is that the 0.8 µm filters contain a distribution of pore sizes and may therefore
allow some larger particles to pass..
DISCUSSION
It was demonstrated here that it is possible to quantitatively characterize colloidal
particles in aqueous suspension with static and dynamic light scattering as long as they scatter
significantly more than water and the scattering volume contains at least a few tens of particles.
These limitations depend on the size, shape, polydispersity and refractive index increment of the
colloids. Monodisperse spherical latex particles with d = 0.2 µm could be reliably characterized
by static light down to C = 10-5 g/L. Latex particles with d = 0.5 µm could be characterized by
static light scattering measurements down to C = 10-6 g/L, but only down to C = 10-5 g/L by
characterized by light scattering techniques. It is simply the case that the results become
progressively less reliable when the concentration decreases.
For samples of seawater, we found that the concentration of colloids with diameters
between 0.2 and 0.8 µm, was not more than 10-6 g/L assuming that they have the same refractive
index increment and density as polystyrene. This concentration was barely sufficient for
quantitative characterization by light scattering. The scattering of seawater filtered through 0.45
µm pores was within the experimental error the same as that of salted water. This means that the
intensity detected for seawater filtered through 0.8 µm pore size filters is due to scattering by
colloids with diameters between 0.45 µm and approximately 0.8 µm.
These results confirm and complement results obtained with other samples of seawater by
Ter Halle et al10. However, these authors did not perform static light scattering measurements
and were therefore not able to quantitatively estimate the concentration of colloidal particles.
They used different DLS equipment that allowed measurements only at a single high scattering
angle (θ = 170°, q=2.5.107m-1). As we showed above, at this q-value the scattering intensity was
very close to that of seawater itself, and it was not possible to characterize the particles by DLS
directly in seawater at θ = 170°. Therefore, Ter Halle et al. concentrated 1 L of seawater by a
factor 200 using ultrafiltration, which allowed them to obtain an autocorrelation function at θ =
170° similar to those shown in Figure 3. However, there is a risk that this procedure introduces
colloids into the sample.
Unfortunately, DLS cannot inform about the chemical composition of the detected
how light scattering results depend on the type of material. The radius of gyration and the
hydrodynamic radius do not depend on the material. However, the light scattering intensity of
particles with a given size and at a given weight concentration is proportional to their density and
the square of their refractive index increment. Mineral particles are denser and have a larger
refractive index increment 20. Therefore the estimated particle concentration would be even
lower if it was assumed that they consisted of minerals instead of plastic.
If we consider that the amount of 'lost plastic', which is estimated at about 1014 g 5, is
distributed equally in the form of colloids in the oceans with a total volume of about 1021 L, the
expected concentration of nanoplastics is at most 10-7 g/L, which was shown here to be below
the limit of detection by light scattering techniques. We did not observe major differences in the
amount of larger colloids for the seawater samples taken at different locations. However, these
samples were all taken near the coast of Europe and may therefore not be representative of the
global average concentration. On the other hand, Erikson et al.5 found that the distribution of
microplastics (between 0.33 and 1 mm) in the North Atlantic was within a factor of 2 the same as
in the other oceans. In addition, some of the samples presented here were taken in the
Mediterranean sea which is known to be a hotspot of plastic pollution21. More measurements of
the concentration of colloids at different locations and depths are needed to determine their
actual distribution in the oceans.
One also needs to consider that there are many natural sources of colloids in the ocean
22-24. Interestingly, it has been reported that colloidal particles form spontaneously within hours or
days in seawater that was filtered through 0.45µm or 0.22 µm pore size filters25, 26, which was
attributed either to association of dissolved organic matter into polymer gel particles25 or to
formed in the filtered seawater samples studied here with time for up to two weeks, but did not
observe that the scattering intensity increased in any of the seawater samples that were collected
for this study either when filtered through Anatope of MF-Millipore filters. A possible
explanation is that the glassware used in the studies reported in the literature slowly released
colloidal particles. We have ourselves noted this in the past.
It is likely that the colloids that were detected in the seawater samples studied here were
not all nanoplastics and other methodology has to be employed in order to identify the chemical
nature of these particles and discriminate plastics from non-anthropogenic particles. The present
study confirms that the detection and identification of nanoplastics in the environment is a very
challenging research area. It would involve isolating enough colloidal particles from large
quantities of seawater to allow for analysis with techniques such as Raman scattering and gas
chromatography combined with mass spectroscopy after pyrolysis. The challenge is to remove
all non-colloidal material and at the same not to introduce extraneous colloids during the
isolation process.
CONCLUSIONS
The light scattering of seawater samples taken at different spots off the coast of Western
Europe and the Mediterranean was within the experimental error the same as for pure water with
sea salt added in the same amount as in the seawater after filtration through 0.45 µm pore size
filters. Comparison with model colloidal particles show that this means that the concentration of
colloidal particles with diameters between 0.2 and 0.45 µm in the seawater samples was less than
particles had a distribution of sizes with an average hydrodynamic diameter of 0.6 µm. The
concentration of colloidal particles in the seawater samples is too low to be able to characterize
their composition. Measurements on model colloidal particles show that characterization of
colloidal particles in seawater requires the use of state of the art light scattering equipment that
allow for measurements as a function of the scattering wave vector.
AUTHOR CONTRIBUTIONS
All authors contributed to the conception of the research, interpretation of the results and writing
of the article.
FUNDING SOURCES
This work was funded by Ifremer (convention 17/1212947B, project MERLIN
MICROPLASTIQUES) and by the ANR CESA (ANR-15-CE34-0006-02, NANOPLASTICS
project).
ACKNOWLEDGEMENTS
François Galgani is acknowledged for providing the samples at different depths from the
REFERENCES
1. da Costa, J. P.; Santos, P. S. M.; Duarte, A. C.; Rocha-Santos, T., (Nano) plastics in the environmental sources, fates and effects. Science of The Total Environment 2016, 566, 15-26. 2. Andrady, A. L., The plastic in microplastics: a review. Marine pollution bulletin 2017,
119, (1), 12-22.
3. Barnes, D. K. A.; Galgani, F.; Thompson, R. C.; Barlaz, M., Accumulation and
fragmentation of plastic debris in global environments. Philosophical Transactions of the Royal Society B: Biological Sciences 2009, 364, (1526), 1985-1998.
4. Koelmans, A. A.; Besseling, E.; Shim, W. J., Nanoplastics in the aquatic environment. Critical review. In Marine anthropogenic litter, Springer, Cham: 2015; pp 325-340.
5. Eriksen, M.; Lebreton, L. C. M.; Carson, H. S.; Thiel, M.; Moore, C. J.; Borerro, J. C.; Galgani, F.; Ryan, P. G.; Reisser, J., Plastic pollution in the world's oceans: more than 5 trillion plastic pieces weighing over 250,000 tons afloat at sea. PloS one 2014, 9, (12), e111913. 6. Moore, C. J., Synthetic polymers in the marine environment: a rapidly increasing, long-term threat. Environmental research 2008, 108, (2), 131-139.
7. In Proceedings of the International Research Workshop on the Occurrence, Effects, and Fate of Microplastic Marine Debris, University of Washington Tacoma, Tacoma, WA, USA, 2008; Arthur, C.; Baker, J. E.; Bamford, H. A., Eds. University of Washington Tacoma, Tacoma, WA, USA, 2008.
8. Gigault, J.; Pedrono, B.; Maxit, B. t.; Ter Halle, A., Marine plastic litter: the unanalyzed nano-fraction. Environmental Science: Nano 2016, 3, (2), 346-350.
9. Gigault, J.; Ter Halle, A.; Baudrimont, M.; Pascal, P.-Y.; Gauffre, F.; Phi, T.-L.; El Hadri, H.; Grassl, B.; Reynaud, S. p., Current opinion: What is a nanoplastic? Environmental Pollution 2018, 235, 1030-1034.
10. Ter Halle, A.; Jeanneau, L.; Martignac, M.; JardeÌ , E.; Pedrono, B.; Brach, L.; Gigault, J., Nanoplastic in the North Atlantic subtropical gyre. Environmental science & technology 2017,
51, (23), 13689-13697.
11. Koelmans, A. A.; Kooi, M.; Law, K. L.; van Sebille, E., All is not lost: deriving a top-down mass budget of plastic at sea. Environmental Research Letters 2017, 12, (11), 114028. 12. Shim, W. J.; Hong, S. H.; Eo, S. E., Identification methods in microplastic analysis: a review. Anal Methods In 2017; Vol. 9, pp 1384-1391.
13. Schurtenberger, P.; Newman, M. E., Characterization of biological and environmental particles using static and dynamic light scattering. In IUPAC Series on Analytical and Physical Chemistry of Environmental Systems, Vol. 2., Buffle, J.; van Leeuwen, H. P., Eds. Lewis: Boca Raton, 1993; pp 37–115.
14. Filella, M.; Zhang, J.; Newman, M. E.; Buffle, J., Analytical applications of photon correlation spectroscopy for size distribution measurements of natural colloidal suspensions: capabilities and limitations. Colloids and Surfaces A: Physicochemical and Engineering Aspects
1997, 120, (1-3), 27-46.
15. van de Hulst, H. C., Light scattering by small particles. Academic Press: New York, 1981.
18. Jonasz, M.; Fournier, G., Light scattering by particles in water: theoretical and experimental foundations. Elsevier: London, 2010.
19. Morel, A., Optical properties of pure water and pure sea water. In Optical aspects of oceanography, Jerov, N. E.; Nielson, E. S., Eds. Academic: London, 1974; pp 1-24.
20. Babin, M.; Morel, A.; Fournier-Sicre, V.; Fell, F.; Stramski, D., Light scattering properties of marine particles in coastal and open ocean waters as related to the particle mass concentration. Limnology and Oceanography 2003, 48, (2), 843-859.
21. Cozar, A.; Sanz-Martin, M.; Marti, E.; Gonzalez-Gordillo, J. I.; Ubeda, B.; Galvez, J. A.; Irigoien, X.; Duarte, C. M., Plastic accumulation in the Mediterranean Sea. PloS one 2015, 10, (4), e0121762.
22. Wilkinson, K. J.; Lead, J. R., Environmental colloids and particles: behaviour, separation and characterisation. John Wiley & Sons: Chichester, UK,
, 2007; Vol. 10, p 1–687.
23. Delay, M.; Frimmel, F. H., Nanoparticles in aquatic systems. Analytical and Bioanalytical Chemistry 2012, 402, (2), 583-592.
24. Linders, T.; Infantes, E.; Joyce, A.; Karlsson, T.; Ploug, H.; Hassellov, M.; Skold, M.; Zetsche, E.-M., Particle sources and transport in stratified Nordic coastal seas in the
Anthropocene. Elem Sci Anth 2018, 6, (1), art 29.
25. Chin, W.-C.; Orellana, M. V.; Verdugo, P., Spontaneous assembly of marine dissolved organic matter into polymer gels. Nature 1998, 391, (6667), 568.