Augmented Virtuality for Coastal Management: a
2
holistic use of in-situ and remote sensing for large
3
scale definition of coastal dynamics
4
Sandro Bartolini1, Alessandro Mecocci1,Alessandro Pozzebon1*,Claudia Zoppetti1, Duccio 5
Bertoni2, Giovanni Sarti2, Andrea Caiti3, Riccardo Costanzi3, Filippo Catani4, Andrea 6
Ciampalini2,4and Sandro Moretti4 7
1 Department of Information Engineering and Mathematical Sciences, University of Siena, Via Roma 56, 8
53100 Siena, Italy; bartolini@dii.unisi.it, alemecoc@alice.it, alessandro.pozzebon@unisi.it, 9
claudia.zoppetti@gmail.com 10
2 Department of Earth Sciences, University of Pisa, Via Santa Maria 53, 56126 Pisa, 11
duccio.bertoni@for.unipi.it, sarti@dst.unipi.it 12
3 Department of Information Engineering, University of Pisa, Via Girolamo Caruso 16, 56122 Pisa; Research 13
Center "E.Piaggio", Via Diotisalvi, 1, 56122 Pisa; ISME - Interuniversity Research Center on Integrated 14
Systems for the Marine Environment; andrea.caiti@unipi.it, riccardo.costanzi@unipi.it 15
4 Department of Earth Sciences, University of Florence, Via Giorgio La Pira 4, 50121 Firenze; 16
filippo.catani@unifi.it, andrea.ciampalini@unifi.it, sandro.moretti@unifi.it 17
* Correspondence: alessandro.pozzebon@unisi.it; Tel.: +39-349-424-5468 18
Abstract: In this paper the authors describe the architecture of a multidisciplinary data acquisition 19
and visualization platform devoted to the management of coastal environments. The platform 20
integrates heterogeneous data acquisition sub-systems that can be roughly divided in two main 21
categories: remote sensing systems and in-situ sensing systems. Remote sensing solutions that 22
are going to be implemented include aerial and underwater data acquisition while in-situ sensing 23
solutions include the use of RFID tracers, Wireless Sensor Networks and imaging techniques. All 24
the data collected by these subsystems are stored, integrated and fused on a single platform that 25
is also in charge of data visualization and analysis. This last task is carried out according to the 26
paradigm of Augmented Virtuality which foresees the augmentation of a virtually reconstructed 27
environment with data collected in the real world. The described solution proposes a novel 28
holistic approach where different disciplines concur, with different data acquisition techniques, to 29
a large scale definition of coastal dynamics, in order to better describe and face the coastal erosion 30
phenomenon. The overall framework has been conceived by the so-called Team COSTE, a joint 31
research team between the Universities of Pisa, Siena and Florence. 32
Keywords: Coastal Monitoring, Remote Sensing, In-Situ Sensing, Augmented Virtuality, AUV, 33
Drones, RFID, Wireless Sensor Networks, 3D imaging 34
1. Introduction 35
The preservation of coastal areas is a major challenge that any administration has to deal with 36
in the new millennium. Coastal areas are paramount for several reasons, spanning from economic 37
factors to naturalistic aspects. For instance, the economy of many littoral territories is based on 38
tourism (e.g., beach resorts, restoration, leisure activities) or port activities (e.g., commerce, industries, 39
tourism); environmental features such as dunes, sea fauna and flora, also draw the attention of 40
dedicated tourism, not to mention the importance of the naturalistic value. Coastal erosion has 41
been a worldwide issue since the Eighties [1], affecting more than 70% of sandy coasts, and this 42
percentage has never decreased. It is a complex process, characterized by the interaction of a variety 43
of different factors: for instance, it can be either more or less intense locally along the very same 44
beach. In general terms, the erosion processes are triggered by a significant decrease in river bedload 45
transport rates: the sediments do not reach the sea and the littoral currents, once responsible for 46
the longshore distribution of the river sediments to feed the adjacent beaches, begin to entrain the 47
grains that already constitute the beaches [2]. The sediments would shift according to the direction 48
of the littoral drift, but they would not be replaced. Progressively, the updrift sector of the beach 49
would be eroded, whereas the downdrift sector might experience accretion unless the sediments 50
are lost offshore. The factors that may induce river bedload reduction include changes in land use, 51
the proliferation of hard embankments covering the river banks and dams hampering the sediment 52
movement towards the coast, the extensive quarrying of the riverbed, and also the protection of 53
mountain slopes from hydrological processes, which reduce soil erosion and the production of loose 54
sediments [3]. Not only human-related activities along the river catchment contribute to worsening 55
the erosion processes, at least at the local scale: for instance, port structures such as piers or seawalls 56
interrupt the natural longshore distribution of sediments, leading to updrift accretion and downdrift 57
erosion at either sides of the structure. Sometimes breakwaters and groynes that were built to protect 58
the beach might end up intensifying the erosive drive as well as port structures. Erosion effects are 59
also magnified by progressive sea level rise [4,5]. 60
In the past decades coastal erosion issues were often addressed with the realization of hard 61
protection structures (e.g., groynes, breakwaters, seawalls) to counteract the erosion effect. The 62
so-called "hard approach" [6] was not intended to solve, nor to reduce, the primary factors responsible 63
for the erosion processes, but rather to fix an apparent equilibrium state of a specific sector of the 64
coast by confining the sediments within the very same sector. While this approach may work locally 65
despite the unpleasant visual impact of the structures that leads to a deterioration of the landscape, 66
sometimes it does not take into full account the consequences on the adjacent sectors of the coast. The 67
transmission of the erosion effects downdrift is a major shortcoming of these protection schemes, 68
which basically need in-depth investigations prior to the construction and frequent monitoring 69
afterwards. Based on the double-edged efficacy of this approach, projects requiring the utilization of 70
hard structures potentially affecting local morphodynamics were preferably discarded and replaced 71
by operations intended to artificially restore the suffering sectors of coast. Beach feeding activities, or 72
replenishments, generally constitute the so-called "soft approach" [6]. As replenishments involve the 73
input of additional sediment volumes into a starving system, often softer approaches are favorably 74
accepted by decision makers and the communities. Nonetheless they are far from being considered 75
the ultimate solution. As a matter of fact, beach feeding does not come cheap and needs frequent 76
integrations because sediments would keep on being displaced according to the direction of the 77
littoral drift; besides, strong attention must be paid to textural and morphometric parameters of the 78
filling sediments, as compatibility with the native sediments should be maintained as far as possible 79
to extend the durability of the intervention and to avoid environmental issues; at last, they are still 80
intended to fix a local problem rather than act on the primary causes. 81
Therefore, the concept that needs to permeate any layer, from the decision makers to the 82
stakeholders, from the private citizens to the scientists, is to start thinking of the coastal system at 83
a larger scale, from the drainage basin to the sea along an imaginary cross-shore transect, and also in 84
terms of physiographic unit along the coast. A wise and effective coastal management depends on a 85
strong and influential governance that might be able to cross the administrative limits, thus allowing 86
to consider the erosion issue in terms of littoral cells and no more just locally. 87
The first step is to accept a paradigm shift: the evolution of the coastal environment is not just 88
affected by the processes acting along the shoreline, but also on the drainage basin and along river 89
courses. The transversal scale (the well-known "source-to-sink" approach) needs to be taken into full 90
consideration because a paramount question still without a clear answer is how much sediment is 91
delivered by rivers to the coast; and as a consequence, how much of this sediment is further displaced 92
offshore to a depth where no process is able to bring it back to the beach. Two questions in need of 93
urgent response, because no evaluation of sediment budget can ever be made without quantitative 94
answers to these burning questions. Nonetheless, the longitudinal scale must be addressed in terms 95
consequences that these kinds of interventions may have on adjacent coastal sectors. A wise plan 97
to counteract the erosion effects and to a further extent to manage the coastlines includes a proper 98
redistribution of the sand, which must not depend on the administrative limits of municipalities. It 99
is imperative that the redistribution of sediments from accreting areas to retreating areas via either 100
by-passing or back-passing has to be managed without any interference due to city limits. In all 101
this, the collaboration between any social layer should be particularly stressed: sharing knowledge 102
and setting up actions involving universities, local governments, stakeholders, professionals, schools, 103
and the communities as a whole must be the focal point to make conscious decisions in accordance 104
with the precautionary approach and to efficiently counteract the erosion issue along any coast. 105
This paper is structured as follows: section 2 focuses on the importance of the holistic approach 106
for coastal management, describing how cooperation between different disciplines is crucial for a 107
360 degrees data acquisition on coastal phenomena. Section 3 and 4 are devoted to the presentation 108
of a base set of different techniques and instruments that are currently expected to be employed in 109
data collection for the proposed platform: these include all the knowledges currently available in 110
the working team. Additional techniques and instruments (for example GNSS signal reflectometry, 111
terrestrial Mobile Mapping, current and wave meters) have not been cited in the paper because at 112
the moment not present among the skills of the working team, but are expected to be added in the 113
next future according to the open and inclusive approach of the proposed solution. Regarding the 114
description of the techniques, section 3 is devoted to remote sensing techniques that are currently 115
employed or expected to be used for remote data acquisition, while section 4 focuses on in situ sensing 116
techniques. Section 5 describes the proposed Augmented Virtuality visualization paradigm and the 117
overall data acquisition and management architecture. Finally, section 6 presents some concluding 118
remarks. 119
2. A holistic approach for coastal management 120
The coastal environment is usually defined by the dunes, the beach and the nearshore. In 121
that sense, the coastal system is just a tight strip, almost negligible relative to the width of other 122
environments. Nonetheless, several processes acting on the coasts are strictly connected to the 123
adjacent systems: as already pointed out, coastal erosion shows its effects along the shore, but many 124
of its causes have to be looked for in river catchments. Likewise, the sediments that are entrained 125
by the wave motion and distributed elsewhere by the currents might accumulate beyond the surf 126
zone. Therefore, it is crucial for any study concerning the coastal system to take into account all the 127
processes acting on the other environments because their effects also spread along the coast. This 128
notion is not as common as it should, mainly due to the complexity to deal with so many different 129
factors coming from so many different settings and, very likely, in so many different timespans. 130
Similarly, coastal erosion is basically a geological process, being the result of complex interactions 131
between coastal geomorphology and several hydrodynamic factors (e.g., waves, tides, surges). 132
Nevertheless, a wide range of critical factors can be listed both as collateral causes and as possible 133
mitigating solutions. For example, the chemical composition of seawater and its interaction with 134
beach sediments, especially on artificial coarse-clastic beaches, may end up in corrosive processes 135
that could eventually lead to a remarkable volume loss (preliminary laboratory tests performed on 136
marble samples collected from artificial beaches along the Tuscany coast point out that mass loss 137
due to sea water - sediment interaction is not negligible), while the presence of specific vegetation 138
species may have a positive effect in slowing down the erosive process on dunes. This means that the 139
cooperation between different scientific disciplines is crucial for a broader in-depth comprehension 140
of the erosion phenomena: according to [7], a multidisciplinary approach would be then the perfect 141
starting point to gain immediate benefits in terms of coastal management. Coastal morphodynamics, 142
river supply processes, sedimentology, geomorphology, applied geology, hydrogeology, biology, 143
coastal engineering, robotics, remote sensing, positioning and navigation are the most significant 144
farther scientific sectors like economy, management or law may have a crucial role in tackling specific 146
issues. 147
The holistic approach is also paramount for the development and improvement of the techniques 148
and technologies employed in the data collection, storage and elaboration activities. Each of the 149
disciplines listed above contributes with its own methodologies to the creation of datasets that can 150
be fused with the other ones to create a large amount of heterogeneous information. One of the main 151
goals of the proposed framework is to provide each scientific field with innovative technological 152
instruments coming from its joint work with experts coming from the ICT sector. In Sections 3 and 153
4 a list of mature and innovative technological solutions, which can be applied for data collection 154
in different scientific fields and from different points of view, is presented. These solutions allow 155
to define the coastal erosion phenomenon at different scales and with different approaches: each 156
technique is then complementary to the others and concurs in defining a global overview of the 157
morphological processes. Transversal to all the techniques is data acquisition and elaboration: each 158
collected dataset can be either individually analyzed or fused with other datasets to obtain higher 159
levels of abstraction. Complementary to the data acquisition process is the last brick of the proposed 160
framework: data visualization. Information needs to be available to a wide range of users: not only 161
scientists have to analyze the data, but also common citizens may be interested in consulting high 162
level information. This means that knowledges in the field of interaction design and 3D imaging are 163
also required for this final step. 164
The holistic approach for coastal management has already been discussed, for example in [8] but 165
real implementations can be hardly found in marine monitoring systems. Some on-line coastal data 166
navigation tools can be found in different parts of the world. Among them it is possible to cite in the 167
USA the Coastwide Reference Monitoring System (https://www.lacoast.gov/crms2/Home.aspx), 168
that collects data regarding the wetlands in the state of Luisiana, and the Delaware Coastal Flood 169
Monitoring System (http://coastal-flood.udel.edu), that provides information about flood risk in the 170
coastal areas of the state of Delaware. Outside the USA it is possible to cite the Web portal of the 171
UK Environment Agency (https://www.gov.uk/government/organisations/environment-agency), 172
that provides data sets from different environmental domains, including coastal areas, and the 173
Coastal Management Information System (CMIS - http://45.79.129.215/index.html) of the state of 174
Karnataka, India, providing different interaction modalities. Anyway, all these systems are mainly 175
Geographic Information Systems (GIS) with a very low level of interaction and a monodisciplinary 176
approach. One interesting example is the European Multidisciplinary Seafloor and Water-column 177
Observatory (EMSO) [9]: this European-scale infrastructure deals with the collection and analysis 178
of heterogeneous marine data, with an approach similar to the one proposed in this paper, 179
but in a larger scale. Another interesting data management infrastructure is the Digital Coast 180
platform, developed by the US National Oceanographic and Atmospheric Administration (NOAA) 181
(https://coast.noaa.gov/digitalcoast/), which provides a wide range of tools to access a large 182
quantity of heterogeneous data about seas and oceans. Nevertheless, this platform lacks a 183
ready-to-use 3D navigation tool based on the Augmented Virtuality paradigm as the one proposed 184
in this paper. This makes the platform very useful to scientists and experts but hardly usable by 185
private citizens. Moreover, the Digital Coast platform lacks a crowdsourcing approach that may 186
become crucial for the creation of large, participative datasets. Some solutions have focused on 187
the multidisciplinary approach only in regards to the instrumentation [10] and the methodologies 188
[11,12], without widening the scale of the monitoring infrastructure. At our knowledge, such a 189
3. Remote Data Acquisition 191
3.1. Proximal and distal remote sensing 192
Since the 1980s remote sensing techniques and products have been used to monitor the evolution 193
of coastal zones. During the last 15 years the improvement of the available sensors from spatial and 194
temporal point of views encouraged the use of these techniques in coastal studies. Today, remote 195
sensing techniques represent inexpensive and fast methods to obtain a huge amount of data over 196
wide areas and/or very specific information. Coastal studies can benefit from the use of very different 197
sensors. Proximal and remote sensing can be used in combination in order to obtain data from 198
different point of views. For example the hyperspectral portable spectroradiometer, which operates 199
at a distance of few centimeters from the sample, has been used to retrieve information about grain 200
size, mineralogical composition [13], surface moisture [14], salinity [15] of coastal sediments from 201
their spectral properties. The most employed portable spectroradiometer is the Analytical Spectral 202
Device (ASD) Fieldspec which measures reflectance in 3-10 nm bandwidths over the 350-2500 nm 203
range. This sensor can be used both directly on the field or in laboratory under controlled conditions. 204
Proximal sensors, such as the ADS Fieldspec, allow obtaining a huge amount of punctual information 205
about physic-chemical information of the materials which form the coastline (sand, silt, rocks). This 206
information can be profitably used to produce thematic maps interpolating the obtained results. 207
Considering other available ground based sensors, coastal studies can also benefit from the use of 208
the Terrestrial Laser Scanner (TLS) which is able to produce a dense point cloud that can be used to 209
build a 3D model of a selected area. The point cloud is formed by a mesh of points characterized by 210
(x,y,z) cartesian coordinates. This technique is particularly useful to monitor the stability of coastal 211
cliffs or coastal structures (e.g. harbors, defense structures) affected by erosion [16] at the toe acquiring 212
point clouds in different periods (e.g. before and after a storm or seasonally). In fact this technique 213
allows measuring ground 3D temporal displacements by comparing sequential datasets of the same 214
scenario. 215
The monitoring of coastal cliffs and/or coastal slopes [17,18] can also be achieved using a 216
Ground Based interferometer (GB-InSAR) which is a computer-controlled microwave transceiver 217
equipped with a moving antenna capable of synthesizing a linear aperture along the azimuth 218
direction. The system can acquire Synthetic Aperture Radar (SAR) image each around 1 minute. The 219
phase difference between images (interferogram) acquired in different moments are used to produce 220
displacement maps. The GB-InSAR operates at a distance typically less than 3 km, thus it can be used 221
to monitor the deformation of a relatively small area. This technique can also be used to monitor the 222
deformation of man-made coastal structures. Moving far from the target, another useful technique 223
is represented by the Digital Photogrammetry (DP) by means of Unmanned Aerial Vehicles (UAV). 224
DP is a well-established technique for acquiring dense 3D geometric information from stereoscopic 225
images acquired in sequence by a calibrated digital camera [19]. This technique can provide both 226
very high resolution optical images (5cm of spatial resolution) and high resolution Digital Elevation 227
Models (0.05 m/pix) of a study area [20]. Multiple acquisitions over time can be used to monitor the 228
morphological evolution of the area of interest over time. 229
The above mentioned sensors and technologies need for specific acquisition campaigns and 230
allow acquiring information on relatively small areas. In order to carry out a complete study by 231
means of a holistic approach, which includes not only a wide sector of coast but also the inland 232
sector, we need for sensors to be able to cover very wide areas. Airborne and satellite remote sensing 233
imagery can help to retrieve data over wider areas with respect to ground-based sensors. Optical and 234
SAR sensors are commonly used to study and monitor the landscape evolution [19,21,22]. Optical 235
imagery represents low cost and/or freely-available products extensively used to monitor the coastal 236
environment [13,21,23–27,68]. Space-borne multispectral sensors (e.g., Landsat 8 and Sentinel-2) are 237
considered powerful tools for the identification and mapping of coastal geomorphological features 238
they can be profitably used instead of high-cost, Very High Resolution (VHR) airborne or commercial 240
satellite imagery. Considering their cost the latter can be used in smaller areas since their price 241
is size-related. The main advantage of multispectral imagery is given by the acquisition through 242
different spectral bands of the electromagnetic spectrum and the capability to perform multi-temporal 243
analysis. The former advantage is commonly used to map chemical and physical characteristics of 244
sediments and rocks, to evaluate water turbidity [29,30], identify currents [13], detect pollutant or 245
algal bloom [31]. The multi-temporal analysis helps to measure major changes in coastline [32–34]. 246
At the same time, SAR images can be used to obtain information on the coastal environment. 247
SAR is an active sensor that uses microwaves which are based on the same technology of the 248
GB-InSAR described above but mounted on satellite. Microwaves are transmitted from the sensor, 249
backscattered from targets located at the ground and received again by the sensor. The received signal 250
is then transformed into a grey-scale image. The main advantage of this kind of sensors with respect 251
to the optical ones is represented by the possibility to acquire images in all-weather conditions and 252
also during the night. Today the most important sensor is represented by the new mission Sentinel-1 253
composed by two satellites which acquire images each six days. 254
The single SAR image can be used to automatically extract the coastline, thus by using a set of 255
images acquired in different periods it is possible to monitor the coastline evolution [35,36]. Each 256
SAR image is composed by pixels characterized by a value of amplitude and phase. The latter can be 257
used to measure ground displacement using of at least two SAR images [37,38]. The multi-temporal 258
interferometric techniques (MIT) are based on the analysis of a stack of coregistered SAR imagery 259
[39] processed by means of different algorithms (e.g. Permanent Scatterers Interferometry, PSInSAR, 260
[40–42]. These techniques allow measuring the deformation of coherent radar targets (Permanent 261
Scatterers, PS) along the Line of Sight (LOS) of the sensor, with millimetric accuracy and with respect 262
to a stable point. MIT techniques can be applied from regional to local scale detecting ground 263
deformation occurred during a specific time interval detecting coastal subsidence [22,43] and slope 264
instability of high coasts [44]. PSI technique can fail in case of wide sandy beaches because of the 265
high backscattering of the radar signal due to the terrain roughness. The problem can be partially 266
solved using the SqueeSAR technique [39] which allows the measurement of ground deformation 267
by using point-wise coherent scatterers (PS) and partially coherent Distributed Scatterers (DS). The 268
latter correspond to groups of pixels sharing similar radar returns during the same period. Coastal 269
subsidence can be detected not only along the coastline but also several kilometers inland, especially 270
in case of coastal plains where sediments compaction can provoke regional subsidence. Benchmarks 271
or local permanent references are needed for an accurate georeferencing of point clouds obtained 272
through both the TLS system and drone survey. Reference points are also useful for PSI analysis. 273
Despite the limited number of measurable points that can be acquired in the same period with respect 274
to PSI and TLS systems, Global Navigation Satellite System (GNSS) positioning (based on Network or 275
traditional Real Time Kinematic) is the most accurate positioning technique [45]. In order to improve 276
the spatial accuracy of the TLS, drone and PSI measurements, the GNSS positioning will be used to 277
establish control points. 278
The aforementioned techniques can be fruitfully integrated to characterize the coastal 279
environment and its evolution at different scales, from local to regional, and in time reconstructing 280
changes of the coastal morphology and of the environmental characteristics (vegetation, pollution, 281
turbidity, etc.). Results produced using proximal and distal remote sensing techniques will be 282
represented by thematic maps (i.e. grain size, mineralogy, ground deformation, elevation) and maps 283
of coastal evolution (i.e. change in the coastline, land cover changes). These maps will feed the 284
Coastal Management (CosMan) system representing a sort of zero reference epoch at the beginning 285
of the project and its temporal evolution over time. Thematic maps can be used to plan other kinds 286
of investigations and multi-temporal products can help to plan mitigation actions in areas affected by 287
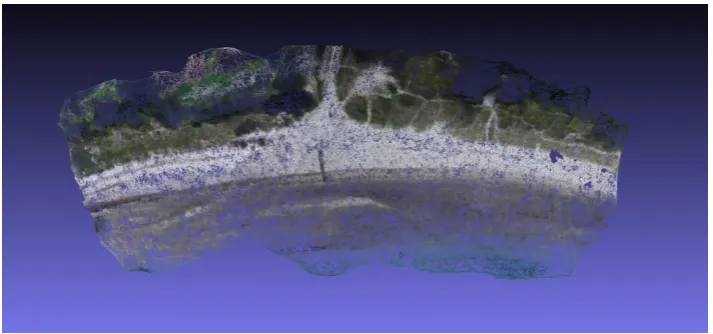
Figure 1.Ground deformation velocity map obtained using Envisat SAR data (period 2003-2010) on a true color image in RGB mode (8,5,2) of the study area acquired using the airborne multispectral sensor Daedalus.
3.2. Underwater remote sensing techniques 289
The possibility of exploiting advanced remote sensing technologies plays a fundamental role 290
also for the collection of data from the submerged part of the coastal area. Information about 291
the morphology of the sea bottom within the target area and about its modification during the 292
time is precious to understand the dynamics of the analyzed coastal system. Underwater Robots, 293
in particular Autonomous Underwater Vehicles (AUVs), represent the ideal tool to perform the 294
necessary tasks of this activity limiting or totally avoiding the presence of human operators in the 295
water, with immediate positive consequences in terms of safety. 296
Different examples of bathymetric surveys carried out by means of commercial AUVs are 297
reported in the literature, including several shallow water applications. They are based both on small 298
size AUVs (e.g. REMUS 100 [46,47]) and large size ones (e.g. HUGIN in [48]). At the same time, 299
AUVs technology became mature and reliable enough in the last years to guarantee advantageous 300
operational costs and associated mission time, turning to be the convenient choice for a wide range 301
of different applications. AUVs technology is then expected to be extensively and systematically 302
employed for activities of sea bottom mapping and monitoring. DII (Department of Information 303
Engineering) of the University of Pisa (UNIPI) collaborated in recent years in projects that, among 304
their goals, had the development of AUVs. The main result in this sense is the outcome of the 305
regional (Tuscany) project THESAURUS1: a dyad of 300m rated AUV prototypes - respectively named 306
TifOne (Fig. 2) and TifTwo (Tifone class) - were produced, for underwater archaeology applications, 307
in the framework of a collaboration between University of Pisa and the Department of Industrial 308
Engineering of the University of Florence (DIEF-UNIFI) - both of them ISME2 nodes. AUVs in 309
Figure 2.TifOne AUV performing a survey mission.
general, and Tifone class AUVs in particular, are thought to be vector vehicles for the transportation 310
on the target area of the desired payload sensors [49]. 311
From the maneuverability point of view, AUVs like Tifone class ones can manage to navigate 312
very close to the shore thanks to their redundant actuation along the different degrees of freedom. 313
Under this aspect Tifone AUVs differs from AUVs with a standard propulsion system based on a 314
single main propeller and rudders (e.g. REMUS 100 and HUGIN themselves). In addition to a couple 315
of stern main propellers for longitudinal propulsion and heading correction, they are equipped with 316
two pairs (a lateral one and a vertical one) of tunnel thrusters for low speed maneuvers and hovering 317
even in the presence of currents up to 1-2 knots. 318
AUVs are then expected to periodically cover the submerged area of the target coastal system 319
with acoustic sensors suitable of providing a set of information including, according to the necessity, 320
bathymetry, morphology or stratigraphy. Through the analysis of the data collected by means of the 321
AUVs and their integration with all the information from all the different sensor systems adopted and 322
described in this work, it will be possible to understand the local dynamics of volume shifts under 323
nominal conditions and, potentially, as a consequence of extraordinary phenomena. Acoustic devices 324
that could provide significant information about the dynamics of the coastal system and that could 325
be integrated on AUVs as payload sensors are: 326
• Side Scan Sonar (SSS) - this sensor allows to cover wide areas in a brief amount of time, 327
the information that can be extracted from SSS data is a rough bathymetry in addition to the 328
morphology of the sea bottom; 329
• Bathymetric Multi Beam EchoSounder (MBES) - this sensor provides a detailed 330
(measurements of the seabed elevation are determined with a down to centimeter resolution) 331
representation of the sea bottom profile suitable for 3D reconstruction as e.g. Digital Elevation 332
Model (DEM); 333
• Sub Bottom Profiler (SBP) - this sensor is a low frequency sonar that emits acoustic waves 334
capable of penetrating the sea bottom and of interpreting the echo coming from the first meters 335
to discriminate the nature of the different stratigraphic layers. 336
All the named sensors are commercially available in versions suitable for their integration on a 337
limited size vehicle (as e.g. AUVs). After their acquisition, payload data are integrated with the 338
the processing chain. The resulting geographical position of the payload measurements are affected 340
by an error that can be even up to few tens of meters according to the quality of the available sensor 341
set for georeferencing. This is mainly due to the impossibility of using the GNSS when the vehicle is 342
underwater. Alternative solutions have to be adopted. This problem is strongly studied within the 343
scientific community and recently led to related reference surveys (e.g. [50,51]). A considerable effort 344
in last years was dedicated by the authors to the problem of AUV localization and, consequently, 345
payload data georeferencing, mainly working on two complementary lines: 346
• Estimation based on proprioceptive data - methods, mainly based on the Kalman filter 347
approach, for the fusion of proprioceptive sensor (e.g. DVL - Doppler Velocity Log, AHRS 348
- Attitude and Heading Reference Systems) signals and dynamic evolution knowledge, have 349
been investigated and experimentally validated [52]. 350
• Estimation aided by acoustic systems - strategies based on measurements of relative distance 351
and/or direction of the AUV with respect to a set ofa prioriknown or unknown acoustic nodes 352
[53]. This includes also cooperative localization strategies based on relative measurements 353
between different AUVs and on communication of synthetic navigation data [54]. 354
Navigation systems exploiting both of the approaches could reach very low errors on the estimated 355
position: down to few meters of error with respect to the GNSS signal assumed as ground truth [55]. 356
All the proposed approaches have been iteratively evolved and experimentally validated exploiting 357
AUVs developed with the involvement of University of Pisa personnel during the last years. 358
Finally, it is worth to highlight that AUVs can easily follow the bottom profile thanks to onboard 359
sensors for environment perception. In the case of some parts of the operational area with very 360
low depths (lower than the sensors range) the AUV could comply with its mission also emerging 361
and moving on the surface, acting as an ASV (Autonomous Surface Vehicle). According to the best 362
practice methodology the authors developed over the years, on the basis of their on-field experience, 363
except for extremely favorable weather and sea conditions, this choice is to be avoided when not in 364
contrast with safety issues. The main reason is that the sea surface dynamics considerably affect the 365
motion regularity of the vehicle, whose dimensions are commonly comparable with the sea wave 366
length. This, commonly, has an extremely negative impact on the quality of the data collected by the 367
payload. On the contrary, by navigating even at few meters of depth, the effect of the surface irregular 368
phenomena is strongly mitigated. Only in the case of nearshore operations with sea state not greater 369
than 1, it is preferable to make the AUV navigate on the surface as an ASV. The main advantage 370
is related to the localization that, in these conditions, can exploit the GNSS signal with positive 371
consequences on the payload data georeferencing. Moreover, ASVs could be a suitable alternative 372
to AUVs, or a complementary asset, when the survey area is a very shallow water zone and the 373
weather and sea conditions are extremely favorable. 374
4. In Situ Sensing 375
In situ sensing techniques to be applied can be summarized based on three main categories: 376
• RFID and tracking technologies 377
• Wireless Sensor Networks 378
• Video Monitoring 379
Nevertheless, possible additional technological assets are expected to be integrated in the next future. 380
4.1. RFID and tracking technologies 381
The tracking of sediments is of key importance to define coastal and fluvial dynamics. Different 382
techniques have been studied in the last decades to study the movement of both sand [56,57] and 383
pebbles [58,59]. While sand movements cannot be studied tracking every single grain, punctual 384
Figure 3.A Smart Pebble and a moment of the pebble localization operations
tracing technique is based on the use of fluorescent tracers [60], while some cases exist where magnetic 386
and radioactive tracers have been employed [61]. To our knowledge, no technique currently exists 387
based on the use of real-time ICT solutions. A wider range of solutions exists for coarse-grained 388
beaches. In this case, while the techniques listed for sand beaches have been employed, painted 389
tracers have also been widely used. Moreover, some solutions also exploit Radio technologies [62]. 390
In this context, the CosMan framework is expected to integrate different tracing techniques, with 391
a specific focus on a technique named "Smart Pebble" [63,64]. This technique is based on the use of 392
Low Frequency RFID transponders embedded inside common pebbles collected directly on the beach 393
under study. The pebbles are holed using a common drill, a transponder is glued on the bottom, and 394
then the hole is sealed. Three different typologies of transponders can be used: 35mm disc tags, 32mm 395
glass cylinders and 12mm glass cylinders [65]: according to the different typology of transponders, 396
pebbles of varying dimensions and shapes can be traced. 397
The tracing operations follow this procedure: 398
• The tagged pebble (the so-called Smart Pebble) is positioned on the beach in a specific position, 399
according to a pre-defined scheme; 400
• Following the positioning, the exact position of the Smart Pebble is recorded by means of an 401
RTK-DGPS instrument, whose horizontal and vertical accuracy is about 1 cm, and associated 402
with the ID of the embedded transponder; 403
• After a pre-defined span of time the Smart Pebble is localized and identified by reading the 404
ID of the transponder through an ad-hoc waterproof RFID reader that is employed as a sort of 405
metal detector to perform a full scanning of the beach; 406
• The new position of the Smart Pebble is recorded; 407
• The Smart Pebble can be either left on site to go on with the tracking or recovered to perform 408
morphological analysis. 409
Such a technique allows the sediment tracking for both the emerged and the submerged portions of 410
the beach: underwater pebbles are usually recovered in the nearshore at depths hardly over 2 m. 411
the Smart Pebbles and the reader have been designed to be waterproof, and the operating frequency 413
(125kHz) allows a long range (up to 60cm) underwater data transmission (A Smart Pebble and the 414
reader can be seen in Fig. 3). Different typologies of experiments can be set up: short term (6, 415
24 and 48 hours) tracking experiments, long term tracking experiments (1, 2 months up to 1 year) 416
and morphological experiments where together with the position, also morphological data about 417
the pebble (weight, shape, roundness) are recorded. All the data collected by the Smart Pebble 418
sub-system are made available to the CosMan platform as a collection of datasets: each dataset 419
keeps the pebble ID and the x, y and t values identifying the position of the pebble at a specific 420
time. Additional fields in the dataset are used for the morphological data. 421
4.2. Wireless Sensor Networks 422
Wireless Sensor Networks (WSN) are widely employed for environmental monitoring: in [66] 423
several solutions in different contexts are presented. WSNs have also been employed for the 424
monitoring of coastal and marine environments [67,68]. Nevertheless, most of the applications focus 425
on the analysis of water quality and are based on the use of floating devices. Several examples of 426
Underwater Sensor Networks can also be found [69]. Indeed, only few solutions focus on the analysis 427
of coastal dynamics. 428
In this framework, WSN are expected to be employed for several purposes, among them: 429
• Analysis of coastal morphodynamics for sandy beaches; 430
• Analysis of bedload and suspended sediment transport; 431
• Monitoring of marine weather and marine parameters; 432
• Monitoring of water quality; 433
• Measurement of river sediment discharge into the sea. 434
Regarding the CosMan ecosystem, three different WSN architectures are expected to be 435
employed, according to the three different segments of the area under study: Beach WSNs,Marine 436
WSNs and Fluvial WSNs. Regarding the Beach segment, WSNs are expected to be integrated in 437
the CosMan architecture to analyze the beach morphodynamics [70]. The structures will integrate 438
different kinds of Wireless Sensor Nodes, in charge of collecting different data typologies which, if 439
fused, allow to estimate remotely and in real time the sand transport in a sample portion of a beach. 440
These Nodes include Sand Level Sensor Nodes in charge of measuring in real-time height variations 441
of the sand level, in order to dynamically assess the morphological variations, Sand Collector Sensor 442
Nodes in charge of measuring in real-time the amount of sand transported by the wind and thus 443
to assess the dynamic behavior of the sand layer, and Environmental Sensor Nodes, collecting 444
atmospheric data and thus allowing to correlate data about the transported sand, with information 445
about winds and weather (See fig.4). 446
TheMarineWSNs are expected to be composed of a set of Sensor Nodes to be positioned in the 447
near-shore portion of sea. Each Sensor Node is expected to include wavemeters and current meters 448
as well as Sand Trap structures to analyze the seabed sediment transport. While the sensing devices 449
are expected to be positioned close to the seabed, they will be linked to floating structures housing 450
data acquisition, elaboration and transmission modules. These WSNs are also expected to integrate 451
floating sensing vehicles in charge of analyzing water quality parameters, thus developing a network 452
architecture composed by fixed and mobile Sensor Nodes. 453
TheFluvial WSNs aim at studying the sediment transport. In this case the main issue is the 454
calculation of the sediment transport, concerning both bed load and suspended sediments. The 455
proposed structures are expected to be employed for short spans of time (ranging from few hours to 456
some days) and will integrate two different typologies of Sensor Nodes: Suspended Sediment Sensor 457
Nodes and Bed Load Sensor Nodes. Suspended Sediment Sensor Nodes are basically densimeters 458
provided with network connection: these nodes are also expected to integrate Water Flow Sensors 459
in order to calculate the effective hourly sediment transport rate. Bed Load Sensor Nodes are under 460
Figure 4.A deployedBeachWSN
All these WSNs will be locally based on either ZigBee or LPWAN (LoRa) connection, according to 462
the specific network requirements, and will rely on a Cloud infrastructure for remote data acquisition: 463
this will allow the data post directly on the CosMan platform. Each dataset provided to the CosMan 464
platform will be made available according to a standard data format including the collected numeric 465
values, the position of the sensor node and a timestamp. 466
4.3. Video Monitoring 467
The use of video cameras for in situ coastal management has become a valuable system [71], 468
in order to perform ship traffic and tourist flow control. Video cameras can also be used for 469
monitoring the coastal evolution, from an in situ perspective, eventually integrated with other sensing 470
systems dedicated to the same purpose. These systems often provide a "unified" type of data that 471
can be processed to extract meaningful statistics related to the shoreline mutations. For example, 472
Time-exposure (or timex) images have been the primary output product of the Argus protocol: each 473
image represents the mathematical time-mean of all acquired frames computed over a fixed interval 474
of time. In these "pictures", moving objects, as well as waves, are averaged so that is possible to 475
visualize their fluctuations as bright pixels in the timex images. The peculiarity of time-exposure 476
images is then the delineation of areas where wave breaking occurs as a white stripe. Similar to the 477
mathematical time-mean representation, there is also the variance image, where pixels associated to 478
moving objects have higher values in the image dynamic range. 479
4.3.1. Acquisition Systems 480
In the following, a short list of popular surveillance and monitoring system found in literature 481
is presented:. 482
• The Argus Video system ([A] - http://www.planetargus.com/). The Argus video system is the 483
first system based on video acquisition for coastal monitoring and it is considered a standard. 484
It has been especially implemented for the coastline change detection on a long-term basis 485
exploiting timex images analysis [72,73]. 486
The system typically consists of four to five cameras, with a total coverage of 180 487
degrees of HFOV (Horizontal Field Of View). The snapshot image, time exposure 488
exposure time for the last two types of data. The range varies from 40m up to 490
2.5km. The the resolution (following the conventional reference system of coordinates 491
[http://www.coastalwiki.org/wiki/Argus_image_types_and_conventions]) is stated as 0.1m 492
on the x and z-axis and 0.5m on the y-axis at 100m from the sensing station; it becomes 0.5m on 493
the x and z-axis and 12.5m on the y-axis at 1km from the sensing station. The accuracy of the 494
measurements on the shoreline evolution has been assessed through comparison with DGPS 495
(Differential Global Positioning System) results, leading to 0.35-2.4m in cross-shore and 10-20m 496
in altimetry. 497
• The EVS Video system system ([B] - Erdman Video Systems - http://video-monitoring.com/). 498
The EVS system is based on high resolution digital camera acquisition and a web-based fruition 499
and manipulation of these resources: in fact, the built-in video server integrated in the system 500
allows to access the camera parameters (pan/tilt/zoom) as well as the image database. 501
One of the installations of the EVS system, based in Italy (Tarracina), has been located at 502
44m a.s.l. and 100m from the shoreline for beach monitoring purposes. The data sampling 503
was settled to acquire five long time-exposure images every day. Also rectified images are 504
produced, based on the nominal spatial resolution of the pixel footprint, allowing respectively 505
for 1.2m on cross-shore (x-axis following the convention) and 14m longshore (y-axis following 506
the convention). 507
• The Beachkeeper video system ([C] - [74]). The image elaboration system of Beachkeeper is 508
particularly valuable because it exploits the pre-installed webcams along the beaches, while it 509
also consents to retrieve georeferenced and rectified images as well as the timex (mean and 510
variance) images. 511
Giving the variability of the composition of this system, it is hard to provide a general 512
performance reference, because any assessment on the accuracy depends on the single sensor 513
characteristics. As an example, the installed system in Pietra Ligure is composed of one 514
webcam, which acquires 25 images every 30s. The georeferenced images are provided and 515
the accuracy has been estimated by comparing the coordinates obtained through the automatic 516
procedure of some GCP (Ground Control Points) and their real world coordinates. For this 517
site, the accuracy corresponds to one pixel, whose size varies from 0.15 m to 0.35 m cross-shore 518
(x-axis following the convention) and from 0.55 m to 2.90 m longshore (y-axis following the 519
convention). 520
• The KOSTA Video system ([D] - www.kostasystem.com). KOSTA coastal video monitoring is 521
based on a photogrammetric technique which allows transforming 2D image coordinates into 522
the corresponding 3D real world coordinates [75]. This is an important feature, because the 3D 523
information provides a description of the acquired scene at a different level, introducing the 524
possibility of performing metric measures on the data. 525
Since 2006, 3 KOSTA systems have been installed (www.kostasystem.com): depending on the 526
number of sensors, their resolution and their location, the monitored area and the quality of the 527
video images are defined. For the system in Bakio, the transversal resolution at 1km from the 528
acquisition system is 0.4m and the longitudinal resolution is 5m. 529
• The COSMOS System ([E] - [82]). The COSMOS system is based on the geometric correction 530
of the acquired images followed by the feature extraction (e.g. timex and variance images). 531
Another important characteristic of this system is the fact that it is designed to work with 532
any type of camera, providing to the final users a flexible platform in terms of installation 533
constraints. Various sites, especially in Portugal, employ a COSMOS installation, for various 534
purposes (coastline evolution, beach nourishment evolution, wave breaking patterns..). In order 535
to estimate the accuracy, comparison with 30 GCPs is reported. The location error in cross-shore 536
are below 5 m (even at distance >1Km from the sensor), while in the along-shore direction varies 537
From the above mentioned systems [A], [B], [C], [D], [E] it results that few efforts in processing 539
the beach data have been pushed, in terms of degree of automation and then rendering. The systems 540
presented provide macro features of the monitored site (e.g. the automatically extracted shoreline) 541
only in some cases, while in most cases the automatic processing they are equipped with is mainly 542
applied for the geometric correction or for the orthorectification of the acquired data. The output 543
visual rendering is therefore often made up of the orthorectified and georefenced image, to provide 544
the user with an overview of the monitored site. This type of output, however, has a spatial resolution 545
that is not always optimal, varying with respect to the distance from the sensor. Moreover, if 546
the shoreline was also provided (even superimposed on the orthorectified output), this is typically 547
obtained from timex images, so that the temporal resolution of these systems is not very high. 548
4.3.2. Shoreline Change Detection for coastal monitoring 549
In general, the term "change detection" is used to refer to those automatic processing techniques 550
that provide a map of changes in the monitored context as output. Therefore, both the acquisition 551
technique (that is, the type of sensor used), and the format of the outgoing change map, can be of any 552
type. The implementation of change detection frameworks for image (or video) systems typically 553
means that changes are to be found in the temporal sequence of the acquired data, that is, a set of 554
images or a stream video. For the context regarding the monitoring of the evolution of the coast, 555
therefore, we will look for the changes in time of the shoreline itself, that will be extracted from each 556
image/video frame, such as the variation of the position with respect to a previous instant or a fixed 557
baseline. Then, the changed pixels will compose the output map, retrieved with the same spatial 558
and temporal resolution of the input data. Depending on the processing data domain chosen and 559
the implemented algorithms, the change detection framework (considered for video based systems) 560
could benefit from better spatial and temporal resolution, then increasing the availability of data for 561
macro indicators evaluations. Moreover, following the change detection methods applied in SAR 562
remote sensing, some principles can also be applied to the video based systems employed for coastal 563
monitoring [72,76]. 564
As introduced above for the systems reported in literature, timestack analysis can be useful to 565
represent the changes of coastal features in time. A distinctive and representative feature of the coastal 566
evolution has always been the shoreline: in [77], the authors demonstrated how the high-frequency 567
data availability, with respect of time, and efficient shoreline detection techniques can increase the 568
reliability of the evolutionary trend of the beach. The shoreline is defined as the intersection curve 569
between the beach surface and the sea surface. The difficulty in the analysis of the variability in time 570
of this feature is the fact that, depending on the duration of the interval of observation (short or long 571
term analysis), different and ambiguous results can be obtained. Therefore, the detection interval 572
must be chosen properly, in order to both reject rapid oscillations of sea backwash and retrieve 573
the instantaneous water level. This is the main reason why the video based systems in literature 574
provide timex images, which natively filter out rapid variations in the scene. In this way, it is possible 575
to correctly model the shoreline behavior through isodepths, as defined in [78], but it requires an 576
appropriate sizing of the phases of acquisition of the system. Temporal series of isodepths acquired 577
during a tidal cycle allow to retrieve a three-dimensional representation of the beach. Timex images 578
are also used to perform clustering on pixels in the HSV (Hue Saturation Value) domain to obtain 579
the wet/dry segmentation and then retrieve the separating line, corresponding to the shoreline. 580
In order to quantify multitemporal changes of the shoreline fluctuations, the MIP (Mean Inertidal 581
Position) indicator is often used, together with the MICL (Momentary Inertidal Coast Line). In the 582
last years, various techniques and composite systems of video acquisition have been employed in 583
shoreline evolution monitoring. Terrain systems [79] are both costly and incapable of collecting 584
data at the proper spatial and temporal resolution [80]. Alternative systems are more compact, 585
easy to install and use fixed video imagery [81] in order to provide lower-cost continuous data at 586
summarize, new video acquisition systems should be re-designed in order to improve both spatial 588
and temporal resolution (possibly near real-time), while equipped with automatic shoreline change 589
detection algorithms. 590
The recent advancements in hardware multi-processing and 3D stereo computer vision have 591
triggered the diffusion of new Stereo devices for a range of applications. Stereo Vision Camera 592
Sensors or Systems are identified in the following major categories: 3D Stereo Defense Camera, 593
3D Stereo Robot Camera, 3D Stereo WebCamera, 3D Stereo Medical Imaging Camera, 3D Mobile 594
Smartphones. Stereo cameras acquire two overlapping images at the same instant, as the human 595
vision system: this overlapping zone allows to measure the disparity between corresponding points 596
in the two images. This disparity, computed in pixels, can be then rescaled in metric units to obtain 597
the 3D map [83]. 598
Stereo vision devices are advanced video systems, capable of recording frames as well as 599
standard video cameras, but they continuously store (at least) two synchronized (in time) frames 600
at each fixed instant of acquisition. The depth map, which provides 3D information on the scene, can 601
be then obtained in real-time, allowing for a constant monitoring rate. The resolution in time can be 602
then highly improved, also allowing the application of 3D processing techniques in real-time. From 603
the depth map, the "point cloud" can be then computed, representing the formal 3D description of 604
the objects in the scene [84]. Then, the key feature of stereo vision is that it can be used to locate an 605
object in 3D space [85]. It can also give valuable information about that object (such as color, texture, 606
and patterns that can be used by intelligent learning machines for classification). 607
As reported in Table 1, the CosMan video sub-system is designed to process a different type of 608
data, the RGB stereo couple, instead of a single image/frame: this is crucial, because the shoreline 609
(and other macro-indicators) extraction can be performed directly in the 3D domain. In fact, each 610
vision module of the CosMan system can provide the disparity/depth image. These data can be then 611
processed to extract the desired synthetic features and confer them to the fusion level. 612
5. Data fusion and Augmented Virtuality 613
5.1. Overall System Architecture 614
The implementation of a Coastal Management (CosMan) system through data acquisition and 615
fusion, as well as Augmented Virtuality representation, requires a tailored ICT3system architecture 616
able to integrate a number of heterogeneous functionalities and technologies. Major features of the 617
system can be summarized in the following macro-points: 618
• Ability to manage (feed (in), storing, elaboration, distribution to users and/or other systems 619
(out) ) of heterogeneous data with high flexibility and interoperability with different systems 620
and technologies; 621
• Management of data with georeferenced and time-referenced features; 622
• Advanced capability of data elaboration, fusion, 3D, as well as modularity of the software 623
design in order to effectively re-use software components (i.e. input/output interface, 624
elaboration) across specific data items, from existing libraries and effectively compose them 625
together for fusion and related time/space elaborations. 626
In particular, there is profound variability in the interesting data feeds of this domain: for 627
example in their intrinsic nature and software format, in the way they are a) physically collected 628
from the field (e.g. automatically, semi-supervised, supervised), b) transmitted to the management 629
system (e.g. directly and immediately through a telecommunication link, directly but when a link is, 630
or is made, available). Other facets of each data feed are their timing and geo-localization, as well as, 631
Table 1.Characteristics of the monitoring video systems. For each system, the following description is reported: a) sensors employed (type and number, where available); b) range (with respect to the sensor location); c) frame rate of the system; d) type of provided (processed) data; e) resolution (referred to the sensor itself or other, if specified); f) accuracy.
Acquisition system
Sensor(s) Range Frame rate Type of
processed data
Resolution Accuracy
ARGUS From 4
to 5 RGB cameras
From 40m up to 2.5km
1 hour (10 min exposure for timex and variance images) Snapshot- timex-variance images + rectified image (referred to the rectified image) -0.1m (x,z), 0.5m (y) at 100m from the station / 0.5m (x,z), 12.5m (y) at 1km from the station (Estimated with DGPS w.r.t. GCP), 0.35-2.4m in cross range, 10-20m in vertical range EVS (ex. Terracina installation) From 4
to 5 RGB cameras
n.a. 5 timex
images per day Snapshot- timex-variance images + rectified image (referred to the rectified image) -1.2m in cross range - 14m in along range n.a. BeachKeeper (ex. Pietra Ligure installation) One webcamera
n.a. 25 images / 30 s Snapshot- timex-variance images + rectified image depends on the single sensor resolution characteristics (Estimated with DGPS w.r.t. GCP) -0.15-0.5m in cross range -0.55-2.9m in along range KOSTA (ex. Bakio installation) 5 RGB cameras (1 6mm lens + 4 with 12mm lens)
n.a. 1 hour
(10 min exposure for timex and variance images) Snapshot- timex-variance images + rectified image (referred to the rectified image) -0.4m in cross range - 5m in along range at 1km from the station n.a. COSMOS (ex. Norte Beach, Nazaré installation) One MOTOBIX camera at 3.1 Mpx
n.a. n.a.
Snapshot- timex-variance images + rectified image (referred to the rectified image) -0.1m-10m in cross range - <2m in along range at 1km from the station
(Estimated with DGPS w.r.t. GCP) -rms = 1.18m in cross range - rms = 9.93m in along range CosMan (if ZEDcam is employed) 4Mpx, 1/3” RGB Stereo module From 0.5m up to 20m (Depth range with 12cm of baseline)
From 15 up to 100 fps
Disparity-depth image + 3D point cloud
From WVGA up to 2.2K - depth resolution is the same as the video resolution
n.a.
CosMan (iif arbitrary RGB sensor is used with arbitrary baseline) Arbitrary resolution and focal length From 5m up to 1km (Depth range with >=90cm and <= 1,5m of baseline)
From 15 up to 30 fps
Disparity-depth image + 3D point cloud
Depth resolution is the same as the video resolution
Table 2. Example of some of the coastal data to be managed in the designed Coastal Management system. A concise description of each data is given, along with its electronic format, nature of the data (e.g. numeric, vector) and spatio-temporal features.
Data Details Format Notes
Waves period, direction, height record Numeric + vector, spot (pos), continuous (time) Granulometry various parameters on samples record Numeric + vector, spot (pos), spot/periodic (time) Pebble displacement per pebble
movement vs previous position record Vector, zone+spot (pos), spot+delta (time) Pebble sizes and weight changes
abrasion per pebble record Numeric + vector, zone (pos), spot+delta (time)
Topographic height from sea limit to first dune record Numeric, spot (pos), spot (time) profile on shore-orthogonal lines
Topographic height profiles shape Shape file, zone (pos), spot (time) shape
Maps vector maps of specific zones map Vector pdf, zone (pos), spot (time) Map shapefile specific studies shape shapefile, zone (pos), spot (time)
Wind direction, speed, temperature, rain record Number + vector, spot (pos), continuous (time) Coastal lines photo mosaics, tables, polygons shape
record Numeric + images, zone(pos), spot(time) LiDAR Specific zones (year 2010) asc Lidar format, zone (pos), spot (time)
the possible frequency in their sampling, when their collection and transmission can be automated. 632
Table2exemplifies some data that we have considered as a reference for devising a flexible software 633
architecture able to comply with their variability and with the need to analyze, fuse and elaborate 634
them for the overall objectives of this project. 635
Undoubtedly, the such data expose a high degree of variability and we have verified that a 636
system able to cope with these, is able to potentially manage, with zero or minimal modifications and 637
adaptations, a wide range of other data which are typically collected on the field. 638
Lastly, a number of auxiliary data feeds are envisioned in this project and they do not necessarily 639
aim to directly measure some physical properties of the coastal entities, or their evolution over time. 640
We planned to provide some input channels toinformal, and alsosocial, data collection fluxes directly 641
contributed by citizens to enrich the historical coastal status monitoring over time. Dually, some 642
specific Augmented Virtuality views and services can be made public also to encourage the use 643
of end-user applications and promote feeds of data through them. For example, registered people 644
will be entitled to upload photos, comments or other environmental information (e.g. light, ambient 645
pressure, noise) through their personal devices - smartphones and tablets - and mediated by the apps 646
developed for this platform. On top of this, also crowd positioning and movement information will be 647
collected for seasonal, daily and even real-time insight. This support ofsocialdata appears to be very 648
useful for two main reasons. First, the correlation between human activities (e.g. bathing facilities and 649
related seasonal phenomena) and the coastal data evolution can be analyzed and cross-referenced 650
with the other instrumental data for enriched insight. Secondly, a number of ancillary services to 651
people could be enabled, and fed, by this heterogeneous and multi-layered platform; for instance, 652
sand granulometry, weather and storm-related variations in the coastal profile collected by meteo 653
stations, seasonal/weekly/daily crowd presence information could constitute the raw data on top of 654
which organized and personal tourism guidance applications could be built. 655
All the considered data are, directly or indirectly, georeferenced. Some data havespotpositional 656
attributes (e.g. wind direction in a certain measurement station) while other havezone positional 657
information (e.g. maps or shapefiles relative to specific areas). Data are time-referenced too and 658
typically they have a spot timing attribute, a time-stamp. Some data are collected in a way that 659
makes them a continuous series of samples, usually periodic and relatively fast (minutes, hours). 660
Input modules
and adaptors Output modules
Auxiliary modules Enterprise
Management
Orchestration Fusion engine
Enterprise DBs GIS DB
GIS application
GIS module
… From devices or other systems
(Web) Apps and social feeds …
From people
…
Enterprise System
… To other
systems
(Web) Apps and social …
To people
… Management, monitoring,
configuration (Web) Apps
Online GIS resources
Figure 5. Overall architecture of the proposed Coastal Management System (CosMan) platform, highlighting the major modules and their relationships.
are the result of manual measurements campaigns (e.g. pebble displacement/abrasion estimation) 662
performed episodically, sometimes with a slow periodicity (days, weeks, months) or at random 663
moments in time. 664
In order to cope with georeferenced and timestamped data, and with specific data formats, in 665
an efficient and standard way, we chose to integrate a GIS software into the overall CosMan system. 666
Furthermore, in this way the overall system can rely on existing, well-known, GIS functionalities 667
without needing to re-implement them. The only concern adopting this approach is the compatibility, 668
integrability and programmability of the GIS software module within the enterprise infrastructure of 669
the overall CosMan system. In fact, our elaboration engine requires to seamlessly use and interact 670
with the encompassed GIS software for implementing ad-hoc algorithms. 671
The requirement of advanced programmability of our CosMan system derives from its complex 672
requirements, which go far beyond the mandatory collection and sharing of heterogeneous coastal 673
data, which is complex in itself. On top of that, data elaboration, fusion, filtering, investigation, 674
analytics as well as 3D elaboration and Augmented Virtuality implementation, will constitute crucial 675
non-trivial macro-features of the overall system. Therefore, the coreengineof our CosMan system 676
needs to be programmable in languages and ecosystems that support modular development for reuse 677
and productivity, powerful abstraction mechanisms, rich set of third party libraries, compatibility 678
with existing code-bases and scalability in the deployment and management. 679
5.1.1. System Architecture 680
Based on the exposed requirements and features of our envisioned CosMan system, we have 681
defined its reference architecture that is summarized in figure5. 682
Black-box 683
Specifically, from a black-box perspective, the CosMan system interfaces with three classes of 684