Article
Analysis of farmers’ stated risk and their perceptions
towards climate change in the northwest of Mexico.
Miguel Angel Orduño Torres1*, Zein Kallas 2 and Selene Ivette Ornelas Herrera 3
1 Institute for Research in Sustainability Science and Technology (ISST.UPC); [email protected] 2 Center for Research in Agrofood Economy and Development (CREDA-UPC-IRTA); [email protected] 3 Faculty of Mathematics and Statistics. UPC; [email protected]
* Correspondence: [email protected]; Tel.: +34-651-78-76-31
Abstract: Risk attitudes are relevant factors affecting the production and investment decisions at farm level. They are key factors that are related to farmers’ attitudes towards environment and climate change. Several methodological approaches are available to measure the level of stated risk of an economic agent. The Multiple Price List (MPL) method is one of the methods that is gaining relevance. In this study we apply the MPL and relate the risk outcomes with farmers’ characteristics and their perception towards environment and climate change. Data was collected using a face to face survey carried out for a group of 370 agricultural producers of the irrigation district located in northwest of Mexico. Results showed an average risk of about 0.32, locating the agricultural producers of the region in a group with risk aversion, according to the MPL scale. The heterogeneity analysis showed that the socioeconomic factors and the perceptions towards climate change are related to the farmers´ stated risk level. Farmers who are young women with propensity to use public support to invest were shown to be greater risk lovers. Farmers in the region have perceived climate change to a greater extent like floods, hail, diseases and pests, and changing vegetation.
Keywords: Risk attitude, farmers, multiple price list, climate change.
1. Introduction and objectives
Climate change is one of the greatest challenges of our times. This phenomenon refers to the variation of the climate generated by natural causes or by human actions that affect the distortion of climatic parameters such as temperature, rainfall, drought, etc. [1]. The way in which weather events occur represent a risk especially on agricultural production due to floods, storms, droughts and heat waves [2]. Climate is the most significant component in the practice of agricultural production which is continuously affecting farmers’ activities mainly by increasing the production uncertainty [3].
Farmers’ perceptions towards climate changes are increasingly playing an important role in affecting agriculture production and investment decisions. These perceptions are multidimensional and are mainly related to farmers’ risk attitudes and socio-economic characteristics [4,5]. Farmers’ perceptions, attitudes and opinions towards the environment and climate change may have also a significant influence over producers’ decisions [6-8]. They may also have a direct impact on the development of public policy programs regarding the agricultural production sector, as well as on individual actions related to energy consumption [9-11].
The risk attitude is an aspect related to the behavior of the human being, especially affecting their economic decisions. In general terms, individuals are risk averse, exhibiting low risk tolerance and tending towards profit maximization [12]. Risk attitude is individual-specific behavior, affecting personal and professional decision, in particular, investment options such as the amount and periodicity in any economic activity.
To analyze the risk attitudes, several methodological approaches are available that are developed and implemented with a great emphasis on those focused on economic activities such as agriculture. The stated risk elicitation is one of the most used approach in which individual are asked in a survey about their risk behavior. This approach can rely on the multi-affirmation method that often include self-assessment of risk attitude. It can also rely on the methods that are based on the
empirical data analysis and on the expected utility theory. In this last approach, the decisions taken under risk are analyzed as an option between different alternatives, assuming that the decisions have an order of preference, and are defined given a probability distribution for a certain number of affirmations or sentences [13].
According to some studies, the risk attitude cannot be only measured directly based on the expected utility, u(x), because it also depends on the strength of the preference “not to risk”, represented as v(x) [14-16]; where x corresponds to the income (a specific amount), in order to obtain a more accurate measure of the risk attitude, which is known as a "True Equivalent" measure [17]. True equivalent, is the certain amount of money, in which a person is indifferent between that secure payment and the uncertain payments of a certain investment [18].
In this context, the main objective of this paper is to analyze the farmers’ stated risk attitude in an agricultural region in Mexico, using the Multiple Price Lists (MPL) method, known "Lotteries", as an alternative method that belong to the expected utility risk elicitation approach. We also seek to analyze the heterogeneity of the risk attitude level with farmers’ attitudes and perceptions towards the climate change. The heterogeneity analysis will also be completed by analyzing the risk attitudes with the socioeconomic characteristics of farmers and his farming activities. Farmers´ attitudes and sensibility towards environment will be also included. Finally, to identify attitudes patterns that allow differentiating groups of producers whose characteristics help to understand the decisions they make about their productive activities in order to inform policy makers regarding farmers’ preference.
This paper contributes to the existing literature of the farmers’ risk attitude analysis by adding new insight using the MPL method in Mexico. Reviewing the existing literature, to our knowledge, there is a very scarce or no information regarding the measurement of risk aversion level of the farmers’ stated risk in Mexico using the MPL. This paper contributes to verify, in a specific empirical application, the effectiveness and reliability of this risk analysis technic that is easily understood by farmers, without the need for specific prior knowledge of the interviewees. It also offers the opportunity to compare our results with other agricultural systems with similar or different management practices and crops.
2. Theoretical framework of the stated risk analysis
Risk is an essential part in all decisions under uncertainty. Each involved individual or decision maker has a different attitude towards risk, hence the need to quantify the degree of risk aversion in order to identify differences and similarities. There are numerous methods used successfully in economics and agricultural management to measure risk stated attitude based on surveys of the individuals involved in economic activities. Through the review of the literature they could be divided into: i) methods based on an attitude scale to multiple affirmations, ii) methods based on the theory of expected utility and iii) methods that make a combination of the previous ones.
The Attitudinal scale methods are constructed based on the score assigned to multiple statements using a certain scale of values [19]. In these methods the risk attitude is considered a latent construct (a dependent variable) not directly observable, but through other explanatory variables, which are related to the questions or statements proposed by different researchers depending on the topic of study.
The empirical methods based on the economic theory of expected utility [20,21] estimate an indicator of risk aversion as a function of probabilities in a non-parametric framework since it is not a function of the utility that is supposed to govern the behavior of farmers. The following is a brief description of main applications measuring the stated risk level in agriculture based on surveys and interviews.
2.1 Attitudinal scale of 5-points with 31 statements of Bardhan.
negatively to reduce bias. The answers take values between 1 to 5, showing the individual perception towards each source of risk, corresponding to 1 - irrelevant, 2- something irrelevant, 3 - neutral, 4 - something relevant and 5 - relevant. The survey included self-evaluation risk question in which the farmer rated himself on what his risk level is from 0 to 10 where 0 is high averse to risk and 10 is low averse to risk [23].
2.2 Risk attitude measuring instrument RAMI
Fausti and Gillespie designed a risk attitude measuring instrument (RAMI) applied to cattle producers in United States [24]. The instrument was made up of 5 questions, the last three defined according to the certainty equivalence framework associated with the expected utility model. Question I is a self-assessment with three options. Respondents should indicate where they are located between the extreme options of risk aversion and risk lover [25], or according to their preference for risk in eleven investment decisions. The scale used is: 1 = tend to avoid risk in investment decisions, 2 = do not seek to avoid risk in investments and 3 = tend to take a substantial risk in investments. Question II presents to respondents with a hypothetical option of maintaining their current job or taking an alternative one, based on the fact that risk aversion measures depend on income [26]. Question III includes a variable with different probabilities in relation to a hypothetical investment with five different returns and expected variations [27]. Question IV focused on the interval approach method [28]. And Question V corresponds to a hypothetical livestock marketing question in two stages [29]. The limitations of this instrument are that the questions included in each survey form are in the same order for all the respondents, which can generate learning effects and generate inconsistent responses during the survey. Another limitation found is that some of the questions are not easy to understand by all respondents according to their comments.
2.3 Scale of measurement of risk attitude based on 3 factors
Allub based his scale on the hypothesis that risk aversion and income diversification are the factors that influenced the farmers’ decision in a case study in Argentina [30]. It considered that risk aversion is determined by 3 factors: the socio-economic status of the farmer, the degree of involvement or participation in the rural development program, and the farmer's perception of the agro ecological conditions of the farm. They used a linear model that measure the level of risk aversion. They found that only the socioeconomic factor was correlated with the risk attitude.
2.4 Method of measuring the risk attitude with 3 components
Another method to assess the risk attitudes of agricultural producers is the one developed by Bard [22]. This scale was implemented on grain producers in the United States. The method consists of 3 components: the risk attitude scale, a self-assessment question and a model based on the expected utility. The scale evaluates farmers' risk attitudes according to the opinions expressed towards three sources of agricultural production risk: financial, marketing and production; using a Likert scale [31,32]. The score of each individual surveyed is calculated by adding the scores of the multiple elements. The self-assessment question consisted of the evaluation of attitudes towards tolerance or risk aversion using a scale from 0 to 10, where 0 represents the attitudes of risk aversion and 10 represents attitudes of risk lover.
2.5 MPL Multiple Price List "Lotteries"
"closed” in a range of the indifference curve of the respondent, thus identifying a range for the risk attitude [22].
Olbrich, Quaas, and Baumgärtner analyzed the risk attitude of livestock producers in Namibia's pastures using the MPL format [33,34] proposed by Binswanger [35] and studied by Holt and Laury [36]. Respondent had to choose between participating in a lottery and receiving a fixed payment. They proposed 6 scenarios with determined quantities that increase from the first to the last scenario in a procedure applied to cattle auction with two possible sales results and same probability. The expected value of the auction reflected 1/3 of the average annual net income of the farmer. The farmers could decide between participating in the auction and selling directly at certain amount. The fixed amount increase, in each subsequent scenario, until reaches the sixth scenario. Based on the results obtained, the parameters of the expected utility function for each scenario were estimated.
They defined the values of the Aversion Relative to Constant Risk (CRRA) based on the function U(y) = y (1-r) / (1-r);where y is the income and r the relative risk aversion coefficient for each of the 6 stages. Then the coefficient r is estimated by means of the logarithmic maximum likelihood function, conditioned to the expected utility model and the CRRA specification defined on the difference of the expected (∇EU = EUA– EUB). In this case, the maximum likelihood equation used is:
=
+
=
=
i EUT
0))
z
|
EU)
-(ln(1
1)
z
|
EU)
((ln(
X)
z,
(r,
lnL
(1)where zi = (0,1), the 1 indicates that the respondent chose the auction in scenario i, or 0 indicates that he/she chooses the safe amount, and X corresponds to a vector of variables of personal, agricultural and environmental characteristics and environmental risk.
3. Materials and Methods
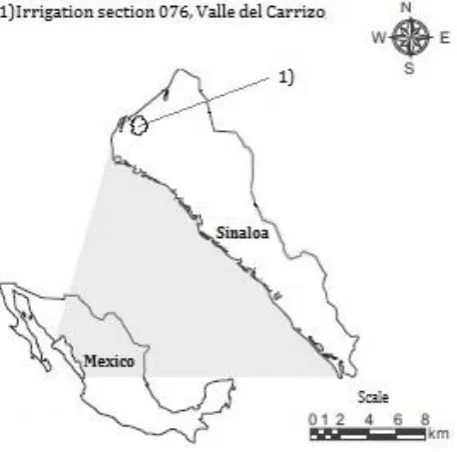
The data collected corresponds to a representative sample of a total of 370 agricultural producers from irrigation district 076 located in the northwest region of Mexico (Figure 1), the sample size was determined based on the formula of finite populations with a confidence level of 95% and an error level of 4.99% [37].
Figure 1. Location of the study area.
farm and the type of planting, as well as different opinions and criteria related to weather events and environmental actions. On average, the application of the interview lasted 40 minutes with each farmer and was carried out with the support of a group of students from the Intercultural Autonomous University of Sinaloa who were instructed prior to the application of the survey.
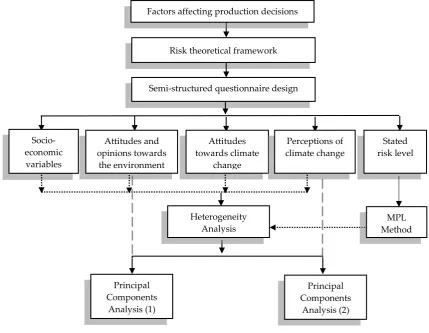
In the following diagram (Figure 2) we summarize the methodological approach applied in this study.
Figure 2. Methodological research approach
The main characteristics of the 370 farmers and their farming activity are summarized in the next Table:
Table 1. Description of agricultural producers and their farms.
Variables Average Std. Deviation
Number of members of the family nucleus 3.79 1.74
Number of generations of the family dedicated to
agriculture 2.28 0.83
Percentage of income from agriculture 0.76 0.28
Total area for cultivation 10.66 9.28
Irrigation by cycle 7.56 4.61
Volume of water irrigated (m3 per hectare) 15.46 78.12
Permanent employees 1.52 1.73
Temporary employees 3.79 9.39
Table 1. Description of agricultural producers and their farms (continuation)
Variable Percent Variable Percent
Factors affecting production decisions
Risk theoretical framework
Semi-structured questionnaire design
Socio-economic variables
Attitudes and opinions towards
the environment
Attitudes towards climate
change
Stated risk level
Principal Components
Analysis (1)
Heterogeneity Analysis
Perceptions of climate change
MPL Method
Principal Components
Gender of the agricultural producer Type of crop harvest
Male 88.92% Manual 17.03%
Female 11.08% Mechanic 82.97%
Age range Loan for agricultural activity
Under 40 years 19.46% No 54.05%
From 41 to 60 years old 52.16% Yes 45.95%
Above 60 years 28.38% Receive some help or subsidy for agriculture
Land tenure regime No 31.62%
Private property 32.97% Yes 68.38%
Ejidal* 67.03% Purpose of the aid received
Property management regime He does not receive help 28.65%
Owner 79.19% Cover operating expenses 41.35%
Owner's family without salary 5.95% For investment in agricultural land 8.38% Salaried family 0.27% For improvement of agricultural land 8.65% Tenant or associate 14.59% Other agricultural expenses 12.97% Water availability problems Agricultural insurance
No 84.05% No 63.24%
Yes Yes 36.76%
Experience in water collection Origin of their agricultural training
No 83.78% Agrarian Experience 88.92%
Yes Agricultural professional-university training 6.76%
Type of irrigation Courses, conferences, workshops, etc. 2.43%
Irrigation by gravity 95.68% Undefined 1.89%
Sprinkler irrigation 1.62% Motorized watering 0.81%
Drip irrigation / localized 1.89%
* Form of farmers’ organization in Mexico
Each agricultural producer was presented with a questionnaire with openended questions divided into several blocks according to the type of information collected. This questionnaire was tested before its final application on a sample of about 25 farmers. The blocks of variables were: i) socio-economic variables of farmers, farm characteristics (economic and management), investment and land use following the classification presented by Kallas et al. [38], ii) environmental attitudes and opinions, using the New Ecological Paradigm Scale NEP [39], iii) attitudes or willingness to carry out actions to reduce climate change, and iv) perception of climate change constructed from literature.
3.1 Measuring farmers’ perceptions towards climate change
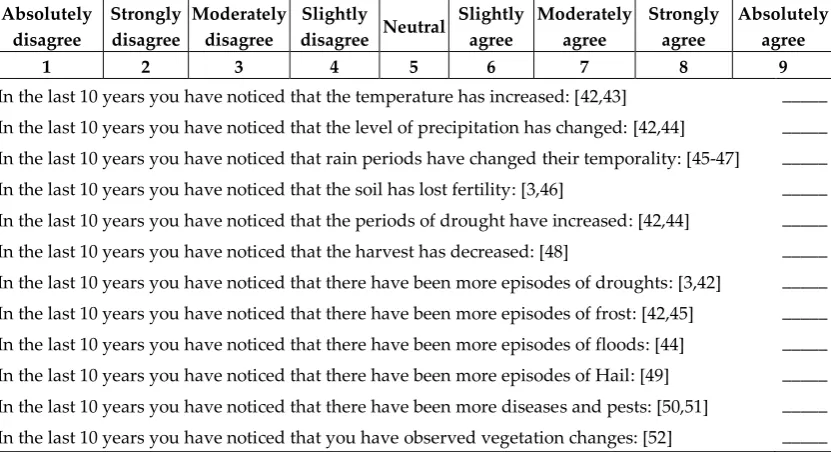
The perception of climate change involves the analysis, according to each individual, of whether he/she has observed variability in certain meteorological factors or events related to the climate. To address this issue, an array of statements, collected from a literature review (Table 2) and related to climate change was to be evaluated according to the farmer's own perception on a 9-points Likert scale (from 1 to 9). The following table shows the statements and studies from where were collected.
Table 2. Items included to analyze the farmers’ perception of climate change.
3.2 Measuring farmers risk attitude
The MLP described previously and proposed by Holt and Laury was selected [36], specifically the variant developed by Brick, Visser and Burns [33]. This decision was taken because of the characteristics of the study target population, which does not have a high level of education but is familiar with the concept of lotteries. The selected method is also characterized by the simplicity and relatively short time of data collection. In addition, its application does not require prior knowledge of the concepts of uncertainty, risk nor requires extensive analysis of multiple statements. The MPL method has been used in many studies to measure the risk attitude of individuals, among which are those made by Olbrich et al. [34] and Brick et al. [33]
3.2.1 Model definition
Each respondent was presented with a set of different lottery pairs, within which one of the lottery options must be chosen for each pair [53]. (It relates the levels of risk aversion with a prize or profit). In the definition of the model, a list of 8 scenarios was generated with a pair of hypothetical lotteries called option A and option B, similar to the theoretical model used by Brick et al. [33] In this model, as in Brick´s, the probabilities of each one of the options to keep the experiment as simple as possible remain constant. In option A the probability of obtaining the amount presented was set at 100% (safe option) and within option B (risky option) was set at the probability 50% of obtaining the amount of ($ 100) and the same probability of 50% of not getting anything ($ 0) (tossing a coin to heads or tails) in all scenarios, while the safe amount presented in option A in each of the 8 scenarios is modified in a decreasing manner according to the following amounts ($ 100, $ 75, $ 60, $ 50, $ 40, $ 30, $ 20 and $ 10).
Table 3 shows the experimental design used. The level of risk aversion is based on the number of safe answers (option A) that the interviewee selects. According to the experimental design structure, only a risk-loving participant would select option B in the first scenario; while an extremely averse participant would be the one who in the 8 scenarios would select option B and a
risk-Absolutely disagree
Strongly disagree
Moderately disagree
Slightly
disagree Neutral
Slightly agree
Moderately agree
Strongly agree
Absolutely agree
1 2 3 4 5 6 7 8 9
In the last 10 years you have noticed that the temperature has increased: [42,43] _____ In the last 10 years you have noticed that the level of precipitation has changed: [42,44] _____ In the last 10 years you have noticed that rain periods have changed their temporality: [45-47] _____ In the last 10 years you have noticed that the soil has lost fertility: [3,46] _____
In the last 10 years you have noticed that the periods of drought have increased: [42,44] _____ In the last 10 years you have noticed that the harvest has decreased: [48] _____ In the last 10 years you have noticed that there have been more episodes of droughts: [3,42] _____
In the last 10 years you have noticed that there have been more episodes of frost: [42,45] _____ In the last 10 years you have noticed that there have been more episodes of floods: [44] _____ In the last 10 years you have noticed that there have been more episodes of Hail: [49] _____ In the last 10 years you have noticed that there have been more diseases and pests: [50,51] _____
neutral participant would be the one who selects option A in the first 3 scenarios and from the fourth scenario changes to option B. [54]
Table 3. Experimental design of risk choice. [33]
Next, I am going to ask you to participate in a Simple "Hypothetical" Lottery Game in which you can earn some money. The question is based on whether you prefer to earn a small amount of money safely or earn a greater amount of money where there is some risk that you do not win anything.
Question 1: What alternative do you choose? (Check the corresponding option)
Option A: You get $ 100 safely.
Option B: We flip a coin: if the coin comes out HEAD, you get $ 100, if TAIL comes out, you get nothing.
Question 2: What alternative do you choose? (Check the corresponding option)
Option A: You get $ 75 safely.
Option B: We flip a coin: if the coin comes out HEAD, you get $ 100, if TAIL comes out, you get nothing.
Question 3: What alternative do you choose? (Check the corresponding option)
Option A: You get $ 60 safely.
Option B: We flip a coin: if the coin comes out HEAD, you get $ 100, if TAIL comes out, you get nothing.
Question 4: What alternative do you choose? (Check the corresponding option)
Option A: You get $ 50 safely.
Option B: We flip a coin: if the coin comes out HEAD, you get $ 100, if TAIL comes out, you get nothing.
Question 5: What alternative do you choose? (Check the corresponding option)
Option A: You get $ 40 safely.
Option B: We flip a coin: if the coin comes out HEAD, you get $ 100, if TAIL comes out, you get nothing.
Question 6: What alternative do you choose? (Check the corresponding option)
Option A: You get $ 30 safely.
Option B: We flip a coin: if the coin comes out HEAD, you get $ 100, if TAIL comes out, you get nothing.
Question 7: What alternative do you choose? (Check the corresponding option)
Option A: You get $ 20 safely.
Option B: We flip a coin: if the coin comes out HEAD, you get $ 100, if TAIL comes out, you get nothing.
Question 8: What alternative do you choose? (Check the corresponding option)
Option A: You get $ 10 safely.
Option B: We flip a coin: if the coin comes out HEAD, you get $ 100, if TAIL comes out, you get nothing.
3.2.2 Estimation of the relative risk aversion coefficient "r"
Once the structure of the experiment is established, according to the specification of the choice of theory of expected utility (EUT) under uncertainty, the parameters of the function of aversion relative to constant risk (CRRA) are estimated, which allow modeling the behavior or participants' risk preferences [36,55]. "According to the theory of the expected utility (EUT Expected Utility Theory) proposed by Von Neumann-Morgoestern, different utility functions have been generated that shape the behavior of people according to their risk preferences. Among the most common is CRRA (aversion relative to constant risk), which allows estimating the implicit risk in decision making" [21].
The expected utility EU of each lottery is calculated by means of the function:
) ) U(X * (p
EU=
i iwhere pi is the probability of occurrence of the utility of the prize Xi and U (Xi) is the utility of the prize Xi. The CRRA function is defined on a non-negative lottery prize, according to the following equation:
r
1
x
U(x)
r 1
−
=
− (3)where x corresponds to the lottery prize, r is the latent risk aversion coefficient, where r = 0 indicates risk neutrality, r > 0 indicates risk aversion and r < 0 indicates taste or love for risk. [55]
To determine CRRA values, a scenario and its immediate continuum are related, given that each scenario is independent of the rest and the model is defined with a decreasing level of risk aversion, so it is not necessary to relate it to the subsequent scenarios, meaning that the level of risk aversion is determined by the first change of option A by option B. (Because of this, any inconsistency subsequent to B's decision can be eliminated).
Table 4. Levels of risk aversion [36]
Number of safe choices "A"
Range of relative risk Aversion CRRA for
U(x)= X(1-r) /(1-r)
Classification of risk preference
0-1 ∞ > r < -0.95 highly risk loving
2 -0.95 > r < -0.49 very risk loving
3 -0.49 > r < -0.15 risk loving
4 -0.15 > r < 0.14 risk neutral
5 0.14 > r < 0.41 slightly risk averse
6 0.41 > r < 0.68 risk averse
7 0.68 > r < 0.97 very risk averse
8 0.97 > r < 1.37 highly risk averse
For instance, with the observation of the choices of an individual who chooses option A in the first three scenarios and then changes to option B, which corresponds to a risk aversion coefficient in the range of -0.15 and 0.14, what would define it as risk neutral; while a person who always chooses Option A (the secure lotteries), the CRRA rank that corresponds to it is 0.97 - 1.37, which defines it as extremely risk-averse.
The expected values of options A and B of each of the scenarios of the previous experimental design can be seen in Table 5; this also includes the ranges of relative risk aversion coefficients implicit in each possible choice under the assumption of relative aversion to constant risk (CRRA).
Table 5. Matrix of payments in the risk aversion experiment
Lottery Option A Option B Expected value
CRRA* Interval Question
(scenario) A PA* B1 PB1* B2 PB2* E(A) E(B) Difference
1 100 1 100 0.5 0 0.5 100 50 50 -1.71, -0.95
2 75 1 100 0.5 0 0.5 75 50 25 -0.95, -0.49
3 60 1 100 0.5 0 0.5 60 50 10 -0.49, -0.15
4 50 1 100 0.5 0 0.5 50 50 0 -0.15, 0.14
5 40 1 100 0.5 0 0.5 40 50 -10 0.14, 0.41
6 30 1 100 0.5 0 0.5 30 50 -20 0.41, 0.68
7 20 1 100 0.5 0 0.5 20 50 -30 0.68, 0.97
8 10 1 100 0.5 0 0.5 10 50 -40 0.97, 1.37
Once the CRRA values are estimated, the choices made by each individual on each pair of options presented in the 8 scenarios are taken and their level of aversion to individual risk is estimated.
The instructions and differences regarding the lotteries presented in each scenario were explained in detail to farmers. Then, they were given the sheet to make their choices. The level of individual risk was determined and consecutively the group results were aggregated. By means of contingency tables and the analysis of the variance by means of the ANOVA method, the relationship of the data with the variable response level of aversion to risk presented by the farmers is explored. Subsequently, the statistical technique of Principal Component Analysis (PCA) was used to reduce the dimensionality that is based on the estimation of correlations. Obtained results are interpreted trying to characterize the agricultural producers of the study section.
4. Results and discussion
In this section briefly describes the results. Firstly, we present the results of the level of risk aversion, and then the results of the heterogeneity analysis.
4.1 Results on the level of risk attitude
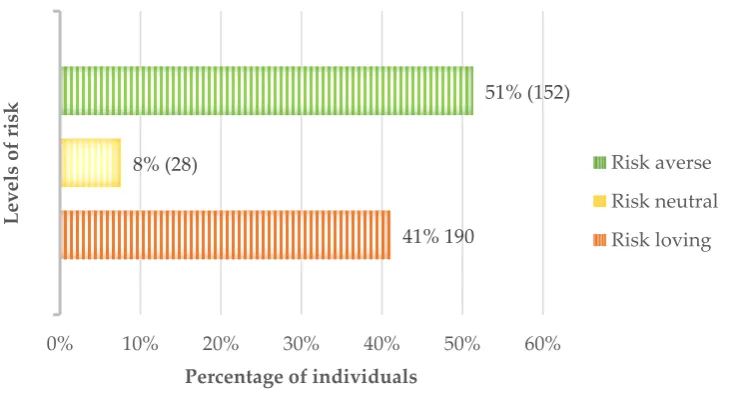
The analysis of the collected data gives a result of a risk aversion level of 0.32 which globally defines the study population within the range of 0.14 and 0.41 corresponding to a slightly risk-averse attitude according to the scale de Holt and Laury [36]. The result obtained is comparable with applied research in agricultural activities through the use of similar tools, such as the one carried out by Trujillo et al. on small pineapple producers in Santander, Colombia, in which producers are identified as risk-averse [56]; the research by Brick et al., applied to the fishing production sector in which they obtained a risk aversion coefficient of 0.393 [33] is very similar to that obtained in this work, or Galarza's research in 2009, applied to cotton producers in southern Peru, in which the results presented a risk aversion coefficient of 0.45, also places them in a risk-averse range [33]. Another example that serves as a comparison is the study conducted by Pennings and Garcia, applied to 373 farmers, in which, the average risk level at which they were located was 0.371. [17]
The results presented in the following graph show how the distribution of the different levels of risk attitude over the 370 producers.
Figure 3. Distribution of producers grouped according to their risk attitude.
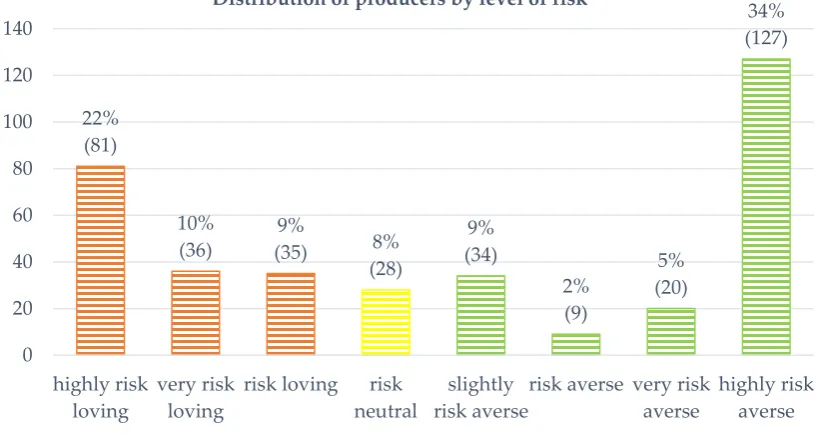
With a slightly more detailed analysis based on the scale of Holt and Laury [36], we can see (Figure 4) that almost 34% of agricultural producers are highly risk averse; their risk aversion
41% 190 8% (28)
51% (152)
0% 10% 20% 30% 40% 50% 60%
1
Percentage of individuals
L
eve
ls
of
r
isk
coefficient is within the range of (0.97, 1.37), in contrast to the 22% of farmers who are highly risk loving, for whom their risk aversion coefficient is within the range of (-1.71, -0.95) of the same scale mentioned above.
Figure 4. Distribution of the producers according to their risk level.
4.2 Risk Heterogeneity analysis
The risk response (risk-CRRA) is a categorical variable and represents the risk level of the farmers according to the scale used by Holt and Lauri. The results of the heterogeneity analysis indicate that the variables related to the level of risk aversion are: the purpose of the subsidies received (p value = 0.002), the gender of the agricultural producer (p value = 0.046) and the age (p value = 0.000). We also find that women declare themselves a bit riskier than their counterparts (percentage of men who love risk = 39%, percentage of women who love risk = 61%). The average level of estimated risk for women was -0.035 and the level of risk aversion of men was 0.361 contrary to what literature reported regarding the risk score for women. Brick et al. [33] indicated that women are the most risk averse, with a level of aversion of 0.254.
The variable collecting the main use of the subsidy was highly significant to the level of risk. Farmers who receive economic support and use it to structural investment at farm level are more risk-loving while those who do not, have adverse profile to risk. Age was also associated to the risk level similar to the findings of Brick et al, in their experiment on African fishing communities [18]. In our case, we find that farmers "above 60 years of age" show that the experience acquired over time allows them to have a lower risk aversion on average, compared to farmers in the range of 41 to 60 years’ old that are more conservative with a higher level of risk aversion.
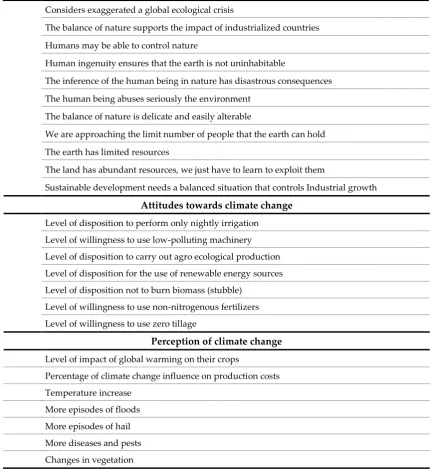
The variables shown in the following table correspond to the heterogeneity analysis relating the risk level and attitudes and perception toward environment and climate change.
Table 6. Variables related to the level of risk based on the ANOVA, classified by type of information.
Type of information Variables
Farm size Number of hectares of rain fed crops
Water use Volume of water irrigated (m3 per hectare)
Income Percentage of income from agriculture
22% (81)
10% (36)
9%
(35) 8%
(28)
9% (34)
2% (9)
5% (20)
34% (127)
0 20 40 60 80 100 120 140
highly risk loving
very risk loving
risk loving risk
neutral
slightly risk averse
risk averse very risk averse
highly risk averse
Table 6. Variables related to the level of risk based on the ANOVA, classified by type of information (continuation)
Attitudes and Opinions towards the environment (NEP statements)
Considers exaggerated a global ecological crisis
The balance of nature supports the impact of industrialized countries
Humans may be able to control nature
Human ingenuity ensures that the earth is not uninhabitable
The inference of the human being in nature has disastrous consequences
The human being abuses seriously the environment
The balance of nature is delicate and easily alterable
We are approaching the limit number of people that the earth can hold
The earth has limited resources
The land has abundant resources, we just have to learn to exploit them
Sustainable development needs a balanced situation that controls Industrial growth
Attitudes towards climate change
Level of disposition to perform only nightly irrigation
Level of willingness to use low-polluting machinery
Level of disposition to carry out agro ecological production
Level of disposition for the use of renewable energy sources
Level of disposition not to burn biomass (stubble)
Level of willingness to use non-nitrogenous fertilizers
Level of willingness to use zero tillage
Perception of climate change
Level of impact of global warming on their crops
Percentage of climate change influence on production costs
Temperature increase
More episodes of floods
More episodes of hail
More diseases and pests
Changes in vegetation
Source: Own elaboration, based on the data provided by the interviewees.
Given that there is a main interest in the perception of farmers in the region with respect to climate change, we reduced the dimensionality of this group of variables, seeking a minimum loss of information through an ACP Principal Components Analysis. The objective is to determine a smaller set of unrelated variables that explain the existing relationships between the observed variables; identify the number of underlying variables; evaluate the individuals on these new variables; and to interpret the component extracted. Before starting the analysis, the KMO test (Kaiser-Meyer-Olkin) was applied to verify the applicability of the set of variables that are available. The result obtained of 0.697 indicates that the relation of these is between medium and low.
component (0.84), indicating that it can be assumed that the first component characterizes the perception of agricultural producers about greater negative events (effects of climate change), which affect their agricultural productivity, constituting the first component, a factor defined Factor Size.
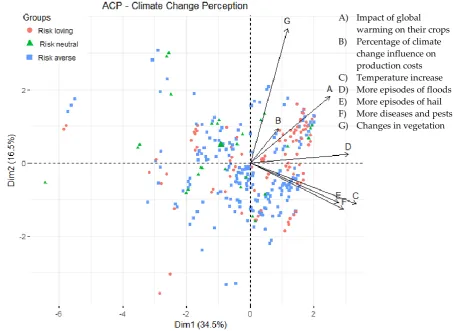
Figure 5. Distribution of interviewed farmers according to their perception of climate change
The previous figure shows the distribution of the points cloud that represents the farmers on the two main components, it is here through the interpretation of the communalities found in each component that we can relate patterns on the agricultural producers, identifying that the producers´ agricultural sectors that have perceived greater impacts due to climate change are located more loaded to the right on the factorial plane and to the left are those that have perceived to a lesser extent such effects of climate change; likewise, the more upwards on the second dimension points are located, it will mean that you have perceived to a greater extent the influence of climate change on production costs.
In this same figure, in relation to the stated risk level elicited from the MPL, we can observe according to the number of points, that in the majority of the risk-loving producers (identified with the red dots) are the ones who have most perceived that the climate change has affected their productivity and production activities, being one of the our main contributions to literatire. We also observed that that risk-neutral farmers do not have a well-defined perceptions regading the climate change nor the effects that climate change could have on their productivity.
A) Impact of global warming on their crops B) Percentage of climate
Figure 6. Distribution of farmers interviewed according to their environmental opinions
In relation to the opinions and attitudes toward the environment using the NEP scale, the results obtained from the analysis of the main components are captured in the previous graph (Figure 6), where it is observed that the first two components explain an accumulated variability of 47.4%. As shown, only variables 2, 3, and 4 (The balance of nature supports the impact of industrialized countries, Human beings may be able to control nature, Human ingenuity ensures that the earth is not uninhabitable, respectively) are negatively related to the second component (-0.57, -0.71, -0.53). According to the numerical results it was found that the opinion that "The land has limited resources" is the one that contributes most to the first component (14.46) "variable 9" and the one that contributes the most to the second component is the opinion that "Human beings may be able to control nature" (27.10) "variable 3".
Based on the points dispersion, we can observe that farmers with more risk-loving attitude have positive perception regarding the aspects related to the control of nature. The risk-loving producers are those that allow a better differentiation of the aspects related to their environmental opinions, that is, they have a clearer vision of the aspects related to their environmental opinions.
5. Conclusions
Although there is a wide variety of stated methods to measure the level of risk aversion, the method of multiple price lists MPL "lotteries" is one of the most applied given the characteristics of the population interviewed, resulting in easy understanding for farmers, that in general in the studied area, do not have a high academic preparation. The results showed that the MPL is a useful tool to compare stated risk attitudes of different individuals who face the same lottery game.
From the empirical point of view, we observed that the farmers of the study region are risk averse (level = 0.32), a comparable situation with that of other agricultural producers in other studies. Analyzing the factors related to the risk level, this study showed the importance of the marketing 1) Considers exaggerated a
global ecological crisis 2) The balance of nature
supports the impact of industrialized countries 3) Humans may be able to
control nature
4) Human ingenuity ensures that the earth is not uninhabitable
5) The inference of the human being in nature has disastrous consequences 6) The human being abuses
seriously the environment 7) The balance of nature is
delicate and easily alterable 8) We are approaching the
limit number of people that the earth can hold
9) The earth has limited resources
10) The land has abundant resources; we just have to learn to exploit them 11) Sustainable development
channels used for their products, the type of tillage, and the control of pests are the largest as the most important variables within the group of improvements required in the agricultural environment. Likewise, in relation to the perception of climate change, the adverse effects perceived to a greater extent by agricultural producers are the diseases and pests on their crops, changes in vegetation, the increase in temperature, and the change in the temporality of the periods of rain. The analysis of heterogeneity allowed us to verify that both sex and age are related to the level of risk. Women in the region are more risk-loving than men and producers over 60 are more risk loving.
As part of the findings of this research, we found that farmers who love risk are the ones who perceive the most climate change effect on production and are the most sustainable towards the environment, which may generate greater resilience in the region. It would be recommended to involve these farmers in the process of generating public policies aimed at improving productivity. Therefore, since women were found to be more risk-loving, it would be also important to involve them in the agricultural decision-making at farm level. Additionally, it is recommended to generate policies that generate a higher level of confidence for farmer who are more averse to risk in order to improve their perceptions and adaptive capacities to climate change.
One of the limitations of this paper is that the comparability of the results on the level of risk depends on the use of the MPL method under the same payment scheme, given that the difference in payments can generate heterogeneous results. Thus, for future research actions, it is considered that the applicability and validity test of MPL could be verified by its application in other agricultural areas with similar characteristics, in order to corroborate and validate the results that generate a comparative map of attitudes towards risk and climate change perceptions.
Author Contributions: M.A.O.T conceived and designed the study, investigate, performed data collection, and wrote manuscript; Z.K. designed the research, made review and editing and was the supervisor of all procedures; S.I.O.H made the formal analysis of the data and wrote the manuscript.
Funding: This research received no external funding.
Acknowledgments: The National Council of Science and Technology (CONACYT) is thanked for the support to carry out this research.
Conflicts of Interest: The authors declare no conflicts of interest.
References
1. Ministerio de Agricultura, Pesca y Alimentación - Ministerio para la Transición Ecológica. Qué es el cambio climático 2018. Available online: URL http://www.mapama.gob.es/es/cambio-climatico/temas/cumbre-cambio-climaticocop21/el-cambio-climatico/ (accessed on: 06-07-2018)
2. Greenpeace. México Ante El Cambio Clomático: Evidencias, Impactos, Vulnearablidad y Adapatación. México Ante El Cambio Climático 2010, 1–68.
3. Rivera, I & Di Paola, M. Cambio Climático: Impacto e incidencias de las políticas públicas en el sector agropecuario. 2013. Available online: URL http://www.farn.org.ar/wp-content/uploads/2014/07/informe2013-1.268-291.pdf (accessed on: 06-07-2018)
4. Saqib, S. E., Ahmad, M. M., Panezai, S., & Rana, I. A. An empirical assessment of farmers’ risk attitudes in
flood-prone areas of Pakistan. International Journal of Disaster Risk Reduction. 2016, 18, 107–114. https://doi.org/10.1016/j.ijdrr.2016.06.007
5. Whitmarsh, L., & Capstick, S. Perceptions of climate change. In S. Clayton & C. Manning (Eds.), Psychology and Climate Change (pp. 13–33). Academic Press. 2016, https://doi.org/https://doi.org/10.1016/B978-0-12-813130-5.00002-3
6. Bonatti, M. Cambios climáticos, percepciones humanas y desarrollo rural. 2011.
7. Makuvaro, V., Walker, S., Masere, T. P., & Dimes, J. Smallholder farmer perceived effects of climate change on agricultural productivity and adaptation strategies. Journal of Arid Environments. 2018, 152(January), 75– 82. https://doi.org/10.1016/j.jaridenv.2018.01.016
9. Jori, G. El cambio climático como problema y el diálogo social como solución. Investigaciones Geográficas. 2009, 48, 125–160.
10. Ayuntamiento de Vitoria Gasteiz. Agenda 21. 2018. Available online: URL http://app05.ottawa.ca/sirepub/cache/2/yfoiqw0dd2sygaf2fpln4mim/50206303282018080034948.PDF. (accessed on: 10-07-2018)
11. Espada, R. L. Percepción de la ciudadanía viguesa sobre el cambio climático. 2016, p.209
12. Mejìa, J. Tolerancia y aversión al riesgo. 2015. Available online: URL
https://www.21tradingcoach.com/es/formaci%C3%B3n-gratuita/an%C3%A1lisis-cuantitativo/128-tolerancia-y-aversi%C3%B3n-al-riesgo
13. Fishburn, P.C. Transitive Measurable Utility. J. Econ. Theory. 1983, 31, pp.293–317. 14. Dyer, J.S., and R.K. Sarin. Relative Risk Aversion. Manage. Sci. 1982, 28:875–86.
15. Keller, L.R. An Empirical Investigation of Relative Risk Aversion. IEEE Trans. Systems Man Cybernetics. 1985, 15(July/August 1985):475–82. Available online: URL http://eprints.ucm.es/20720/1/Cano53.pdf. (accessed on: 10-07-2018)
16. Smidts, A. The Relationship Between Risk Attitude and Strength of Preference: A Test of Intrinsic Risk Attitude. Manage. Sci. 1997, 43:357–70.
17. Pennings, J.M.E. & Garcia, P. Measuring producers’ risk preferences: A global risk-attitude construct. American Journal of Agricultural Economics. 2001, 83(4), pp.993–1009.
18. Roqueiro, C. L. A. La aversión al riesgo en el mercado español de renta variable y sus determinantes, 2005. 19. Choi, A. S., Papandrea, F., & Bennett, J. Assessing cultural values: Developing an attitudinal scale. Journal
of Cultural Economics. 2007, 31(4), 311–335. https://doi.org/10.1007/s10824-007-9045-8 20. Avalos, E. Uncertainty: lotteries and risk. Munich Personal REPEC. 2011. Archive (64342).
21. Capinski, M. J., Kopp, E. & Ski, M. J. C. Portfolio theory and risk management. Cambridge, Reino Unido: Cambridge University Press. 2014.
22. Bard, S. Developing a scale for assessing risk attitudes of agricultural decision makers. The International Food and Agribusiness Management Review. 2000, 3(1), pp.9–25.
23. Bardhan, D. et al. An assessment of risk attitude of dairy farmers in Uttaranchal (India). In Agricultural Economists Conference. January 2006, pp.12–18.
24. Fausti, S. y Gillespie, J.M. Measuring risk attitude of agricultural producers using a mail survey: How consistent are the methods? Australian Journal of Agricultural and Resource Economics. 2006, 50(2), pp.171–188.
25. Cardona, O. Evaluación de la Amenaza la Vulnerabilidad y el Riesgo. Elementos para el ordenamiento y la planeación del desarrollo. Los Desastres no son Naturales. 1993, pp.51–74.
26. Barsky, R.B., Juster, F.T., Kimball, M.S. & Shapiro, M.D. Preference parameters and behavioral heterogeneity: an experimental approach in the health and retirement study, Quarterly Journal of Economics. 1997, 112, 537–579.
27. Gunjal, K. and Legault, B. Risk preferences of dairy and hog producers in Quebec, Canadian Journal of Agricultural Economics. 1995, 43, 23–36.
28. King, R.P., and L.J. Robison. An Interval Approach to Measuring Decision Maker Preferences.” Amer. J.
Agr. Econ. 1981, 63(August 1981):510–20.
29. Fausti, S. Factors Influencing Cash Marketing Decisions for Fed Cattle, Staff. Department of Economics, South Dakota State University, Brookings. 1998, 98-1
30. Allub, L. Aversión al riesgo y adopción de innovaciones tecnológicas en pequeños productores rurales de zonas áridas: un enfoque causal. Estudios Sociológicos. 2001, 19(88), pp.467–493. Available at: http://www.jstor.org.ezproxy.unal.edu.co/stable/40420990. (accessed on: 18-07-2018)
31. DeVellis, R.F. Scale development: Theory and applications, Applied Social Research Methods Series, 1991, Vol. 26. Newbury Park, CA; Sage Publications
32. Spector, P. E. Summated rating scale construction; an introduction. Sage Publications: Quantitative Applications in the Social Sciences Series. 1982, 82
33. Brick, K., Visser, M. & Burns, J. Risk Aversion: Experimental Evidence From South African Fishing Communities. American Journal of Agricultural Economics. 2012, 94(July), pp.133–152.
34. Olbrich, R., Quaas, M. & Baumgärtner, S. Risk preferences under multiple risk conditions – survey evidence from semi-arid rangelands I. Introduction. 2014, (February 2014), pp.1–15.
36. Holt, Ch.A., & Laury S. K.. Risk Aversion and Incentive Effects, American Economic Review. 2002 92(5), pp1644-1655.
37. Rojas, R.. Guía para Realizar Investigaciones Sociales. 40a ed. Plaza y Valdez S.A. México, D.F., 237 p. 2005.
38. Kallas, Z.; Serra, T.; Gil, J. Farmers’ objectives as determinants of organic farming adoption: the case of
Catalonian vineyard production. Agricultural Economics, 2010, 41(5): 409–423.
39. Vozmediano S.L y San Juan G.C. Escala Nuevo Paradigma Ecológico: propiedades psicométricas con una muestra española obtenida a través de Internet. Medio Ambiente y Comportamiento Humano. 2005, 6(1): 37-49.
40. Massey Jr, F. J.The Kolmogorov-Smirnov test for goodness of fit. Journal of the American statistical Association. 1951, 46(253), 68-78.
41. Hair, J.; Anderson, E.; Tatham, R.; Black, W. Multivarte Data Analysis. Prentice-Hall International, Inc. New Jersey, USA. 730 p. 1998.
42. Altieri MA. Agroecology: the science of natural resource management for poor farmers in marginal environments Agriculture, Ecosystems and Environment. 2002, 93: 1-24.
43. Panel Intergubernamental de Cambio Climático IPCC. CAMBIO CLIMÁTICO 2014.
44. Doering, O.C. et al. Effects of climate change and variability on agricultural production systems. Kluwer Academic Publishers. Dordrecht, Netherlands. 2002.
45. Al-Khatiab.K; Altieri, M. A; et al. La Agricultura Mexicana Y El Cambio. GREENPEACE. 2010, 1 (1): 31. 46. Altieri, M.A; Nicholls C. Cambio Climático y Agricultura Campesina: impactos y respuestas adaptativas.
2009.
47. Bates, Kundzewicz, Wu, y Palutikof. “EL CAMBIO CLIMÁTICO Y EL AGUA Grupo Intergubernamental
de Expertos Sobre El Cambio Climático.” 2008.
48. Araus, J; Slafer, G; Royo, C; and Serret, M. Breeding for yield potential and stress adaptation in cereals. Critical Reviews in Plant Science. 2008, 27: 377-412.
49. Stocker, Thomas F, Dahe Qin, Gian-Kasper Plattner, Melinda M B Tignor, Simon K Allen, Judith Boschung, Alexander Nauels, Yu Xia, Vincent Bex, and Pauline M Midgley. Cambio Climático. 2013. Bases Físicas. https://www.ipcc.ch/pdf/assessment-report/ar5/wg1/WG1AR5_SummaryVolume_FINAL_SPANISH.pdf 50. Quiroga, A. Impactos del cambio climático en la incidencia de plagas y enfermedades de los cultivos.
Available online: URL https://www.croplifela.org/es/actualidad/articulos/197-impactos-del-cambio-climatico-en-la-incidencia-de-plagas-y-enfermedades-de-los-cultivos. (accessed on: 12-09-2017)
51. Vásquez, L. Cambio climático, incidencia de plagas y prácticas agroecológicas resilientes. Instituto Nacional de Ciencias Agrícolas (INCA). La Habana. 2011, 242p
52. Galindo, L.M. La Economía Del Cambio Climático En México. Shcp Semarnat. 2013, 53 (9): 1689–99. doi:10.1017/CBO9781107415324.004.
53. Andersen, S. et al. Elicitation using multiple price list formats. Experimental Economics. 2006, 9(4), pp.383– 405.
54. Harrison, G. W., Johnson, E., McInnes, M. M. & Rutstrom, E. E. Individual choice and risk aversion in the laboratory: comment. American Economic Review. 2005, 95(3), 897-901.
55. Andersen, S. et al. Eliciting Risk and Time Preferences Published by: The Econometric Society Stable. 2008, 76(3), pp.583–618. Available online: URL: http://www.jstor.org/stable/40056458 (accessed on: 25-07-2018) 56. Trujillo, J. C., Escobar, J. L., e Iglesias, W. J. Medición de las actitudes hacia el riesgo en los pequeños
![Table 4. Levels of risk aversion [36]](https://thumb-us.123doks.com/thumbv2/123dok_us/1032178.1603401/9.595.83.515.592.746/table-levels-of-risk-aversion.webp)