Received 24 Jul 2015|Accepted 12 Feb 2016|Published 29 Mar 2016
Energy cost and return for hunting in African wild
dogs and cheetahs
Tatjana Y. Hubel
1, Julia P. Myatt
1,2, Neil R. Jordan
3,4,5, Oliver P. Dewhirst
1, J. Weldon McNutt
3& Alan M. Wilson
1African wild dogs (Lycaon pictus) are reported to hunt with energetically costly long chase distances. We used high-resolution GPS and inertial technology to record 1,119 high-speed chases of all members of a pack of six adult African wild dogs in northern Botswana. Dogs performed multiple short, high-speed, mostly unsuccessful chases to capture prey, while cheetahs (Acinonyx jubatus) undertook even shorter, higher-speed hunts. We used an energy balance model to show that the energy return from group hunting and feeding substantially outweighs the cost of multiple short chases, which indicates that African wild dogs are more energetically robust than previously believed. Comparison with cheetah illustrates the trade-off between sheer athleticism and high individual kill rate characteristic of cheetahs, and the energetic robustness of frequent opportunistic group hunting and feeding by African wild dogs.
DOI: 10.1038/ncomms11034 OPEN
1Structure and Motion Laboratory, Royal Veterinary College, University of London, Hatfield AL97TA, UK.2School of Biosciences, University of Birmingham,
H
unting requires a predator to outperform their prey using a combination of stealth, speed, agility and endurance1–4. Cursorial hunting strategies range from one extreme of transient acceleration, power and speed to the other extreme of persistence and endurance with prey being fatigued to facilitate capture. Cheetahs use high acceleration, speed and manoeuvrability to capture prey in a relatively short chase4. Dogs5–9 and humans10 are considered to rely on endurance rather than outright speed and manoeuvrability for success when hunting cursorially. Examples include domestic hounds (Canis lupus familiaris) capturing red deer (Cervus elaphus) after following it for 3 h over 19 km (1.8 ms1)5; and San bushman hunters in the Kalahari Desert running down eland (Taurotragus oryx) and greater kudu (Tragelaphus strepsiceros) in midday heat over distances of 15–35 km with a mean speed of 1.7–2.8 ms1 (refs 10,11).African wild dogs (also referred to as dogs) have been described as the ultimate cooperative persistence predator6,8,9,12–14, using sight and scent to hunt individual prey over many kilometres at moderate speed, rather than the outright athleticism of the cheetah7,15. A perceived high energetic cost of protracted hunting locomotion16 compared with ambush predation has led to African wild dogs being attributed with a low margin of energy intake over that required for maintenance16 leading to negative energy balance if a large proportion of kills are lost to kleptoparasites16.
This description of African wild dogs as persistent hunters, also a recurrent theme in sporting safari literature17, is primarily based on observations of the species hunting in open short-grass plains habitats, such as those found in the Serengeti of Tanzania13,18–22. More recent and detailed knowledge of their range and distribution shows the remaining population of the highly endangered African wild dogs live primarily in woodland and woodland savannah habitats6,14,16,18where direct observation of their hunting strategies is considerably more difficult. The survival of African wild dog packs in areas with denser vegetation and often an abundance of medium-sized, easily subdued prey23 raises questions about their hunting strategies, energetics and vulnerability to kletoparasitism, particularly in this environment. Similar questions have been raised about cheetahs24–27.
We deployed innovative GPS IMU (inertial measurement unit) collars on all members of a free ranging pack of six adult African wild dogs and recorded their movement at sample rates depending on their activity. Position and speed were recorded at 5-min intervals for moving individuals and hourly fixes for inactive individuals. The 5-min GPS fix rate was increased to 10-s intervals for 2 h daily during the peak hunting period. When individuals were running the collar recorded 300 Hz IMU and 5 Hz GPS data. We also deployed one or more collars in each of 13 other African wild dog packs living in the surrounding area. We analysed previously collected data on five cheetahs in the same study area4 to extract the same parameters as for the African wild dogs. Since there is a lack of consistent definition of terms used to describe hunting, we used the following definition in our study; hunting: all locomotion to find food; hunt: the search and pursuit of prey ending in a high-speed run (chase), covering the time and distance from the end of one chase till the end of the next chase by the same individual, regardless of pack activity; chase: runs when maximum stride speeds exceeded 6 ms1(galloping). We assume all chases to be the end of a hunt. Individual kill rate: the number of chases ending in a kill versus the total number of chases by that individual; pack kill rate: individual kill rate multiplied by number of actively hunting dogs. Gormanet al.16measured metabolic rates in six adult African wild dogs using double-labelled water measurements and
found them to be high. They attributed all locomotor energy expenditure to hunting and developed a net rate model balancing energy expenditure with energy gain. They concluded African wild dogs to be highly susceptible to kletoparasitism due to their high hunting costs. Gormanet al.’s16conclusion of high hunting costs in African wild dogs has been cited extensively and has been used as a baseline to calculate foraging success and associated survival28–30. However, the applicability of Gorman’s model has been questioned by Jongelinget al.31who reran the model with different parameters to conclude that food availability, intake and energy content are all higher than assumed by Gormanet al., and that kleptoparasitism does not have a major detrimental effect. Here we modify the original model to take into account our ability to capture the distance covered in hunts and relate that to the number of dogs participating. Specifically, we used the information gathered about daily ranging distance, hunting distance and speed, as well as kill rate to calculate the energy margin under which our pack operates, assuming medium-sized prey and different levels of kleptoparasitism. We expanded the model to examine whether the return is sufficient to maintain a positive energy balance when supporting dependent offspring, a consideration lacking in the original model and recently identified as an important factor31.
Finally, we populate the same model with equivalent data for hunting cheetah to determine the relative energy balance and susceptibility of kleptoparasitism to explore the difference in energetic cost of high-investment and opportunistic hunting strategies.
We determined the energetic cost and return for a pack of African wild dogs hunting antelope and examined whether the return was sufficient to maintain a positive energy balance with different pack sizes and levels of kleptoparasitism. Our results show that short opportunistic hunts of medium-sized prey are relatively cheap, and African wild dogs using this hunting strategy will most likely have a large safety margin with respect to the effects of kleptoparasitism. Comparing the opportunistic hunting style of the African wild dog pack with the same calculations for the high-investment cheetah chases detailed in ref. 4 shows that the higher individual kill rate and gain-to-cost ratio are offset by the group sharing of kills by African wild dogs.
Results
Distance covered per day and activity. The GPS collars provided position and speed information on individual African wild dogs at sample rates determined by activity and time of day (Fig. 1). The mean distance covered by 18 members of 13 other packs in the area was (±s.d.) 13.78±8.47 km per day (ref 32; Fig. 2a,b; Supplementary Table 2). This is comparable with the study pack, which travelled (±s.d.) 13.20±7.7 km per day (ref. 32; denning female excluded; Supplementary Fig. 1; Supplementary Table 2) and was most active around dawn and dusk33 (Fig. 2c). The distance was covered mostly at walk (49% of total distance) and trot (31% of total distance; Fig. 2d)34,35. The pack travelled up to 42.9 km in 24 h and up to 30 km on consecutive days (Fig. 2d).
–5,000 –4,000 –3,000 –2,000 –1,000 0 1,000 2,000 3,000 4,000 5,000 0
1,000 2,000 3,000 4,000 5,000
0 5 10 15 20
10:00 15:00 20:00
Time of day (h) 5:00
0:00
East (m)
Speed (ms
–1
)
North (m)
a
b
1 2
5
6 3
4
8
9 7
9
8
7
6 5
4
1
2 3
< 1.5 ms–1 1.5–3 ms–1 3–6 ms–1 > 6 ms–1 Den site
Figure 1 | Example day’s speed and track for an African wild dog.(a) GPS data trace for one individual, dog position at the beginning of the day (0/0), GPS position colour coded based on speed bins, black arrow shows the direction of the movement, inset shows range covered by dogs during 5 months of observation and trace of example day. (b) Speed profile at local time for one individual colour coded based on speed bins (legend ina). (a,b) Movement is interspersed by six fast chases (circles 1–5 and 7). The GPS sample rate varies throughout the day and is set to capture high-resolution data when the animal is moving. When the animal is stationary, the sampling interval is once an hour (circles 6 and 9). Between 18:00 and 20:00, it is at 10-s intervals (when moving, circle 8), when high-speed chases are detected, it is increased to 5 Hz (circles 1–5 and 7). At all other times, it is once every 5 min when moving.
13 Apr 25 May 07 Jul 19 Aug 01 Oct0 10
20 30 40
Distance per day (km)
b
Count
f e
d c
Distance per day (km) Distance per day (km)
Count
a
Hour of day
10 15 20 25
0 5
Date
> 6 ms–1 3–6 ms–1
1.5–3 ms–1 < 1.5 ms–1
0 10 20 30 40 0
20 40 60
0 10 20 30 40 0
50 100 150
Other packs Focal pack
Median Mean
Median Mean
Count
0 20 40 60 80 100 120
n1=909
n2=210
0 20 40 60 80 100 120 140
10 15 20 25 5
Top horizontal speed (ms–1) Chase distance (m) 0 500 1,000 1,500
Count
0 20 40 60 80 100 120
Count
Median Mean
Median Mean
covered (Fig. 2d; Supplementary Fig. 1) was faster than 6 ms1 (0.98±1.12 km per day).
We define the length of a hunt as the total distance (metres) covered to find, approach and chase a prey animal. Hunt distance and duration were determined by calculating the distance and duration between the end of one chase and the end of the next chase of the same dog (Fig. 3a,b; Supplementary Fig. 4). Figure 1 shows five consecutive hunts by one individual in the morning.
A successful hunt (ending in a kill) was defined as a chase after which the animal remained within 50 m of the chase end point for at least 5 min (Fig. 3c). The kill rate expressed on the basis of individual dogs is 0.155 (ref. 32). Applying the same criteria to cheetah data yielded a kill rate of 0.26.
African wild dogs showed distinct preferred locomotion speeds (outside of chases) which we attributed to maximum locomotor economy for each gait34,35. To prove this concept, we display instantaneous velocity, measured by the GPS module, for 10 s GPS fixes (walking and trotting) during the morning hunting period (Fig. 4a). African wild dogs show a preference to move at speeds around (0.35 ms1, walking) and (2.5 ms1, trotting) with the measured trotting speed close to the 2.3 ms1predicted by the equation of ref. 36 of 1.09body mass0.222.
To estimate the difference in distance travelled by dogs chasing (hunters) versus non-chasing dogs (followers, presumably following a straighter path), we compared instantaneous GPS-derived velocity values with position-differentiated velocity (both high-speed (5 Hz) and low-speed (10 s) data were averaged over 30 s windows). If travelling in a straight line, then the instantaneous and differentiated velocity will be in agreement (slope¼1), while deviations from a straight path are reflected in higher instantaneous velocity and lower slope. Figure 4b shows that while at slow speeds animals do not travel in an exactly straight line (slope¼0.84) the tortuosity during chase is considerably higher (slope¼0.47). We therefore conclude the distance travelled by a follower to be approximately half that of a hunter during chases.
Cheetah comparison. Cheetah and African wild dogs differ in the pre-chase phase as well as in their chase performance. In 10 min preceding a chase, an African wild dog covered 700 m (median) and a cheetah only 317 m (median), reflecting stalking versus coursing (Fig. 5). African wild dog chases contained 87±52 (mean±s.d.) strides while cheetah chases contained only 40±25 (mean±s.d.). African wild dog chases showed much lower peak centripetal acceleration than cheetahs4 (7.0 ms2 versus 13.1 ms2) as well as lower tangential accelerations4
(8.0 ms2 versus 13.0 ms2) and a proportionally larger number of straight strides at lower, constant speeds (Fig. 6).
Model of energetic cost and return from hunting. To calculate the energy margin for free ranging African wild dogs, Gorman
et al.16 conducted double-labelled water measurements on the adult members of a pack comprised of six adults, 16 yearlings and 27 pups. They then used a net rate model to balance energy gain with expenditure:
Hd¼ 24
Er IþErEh
; ð1Þ
whereHdis the daily required hunting time,Iis the prey capture
rate (intake rate), andErandEhare the energy expenditure rates
when resting (basal metabolic rate) and hunting (hunting rates include locomotor and resting costs), respectively. They measured an energy expenditure of 15.3 MJ and derived a resting cost of 4.47 MJ from the literature (20.55 h217.5 kJ resting rate). The remaining 10.83 MJ was assumed to be expended during the 3.45 h per day the pack was absent from the den, yielding a cost of 3.14 MJ1 and an intake of 4.43 MJ1 during hunting. The assumption was made that the entire period and energy expenditure was attributable to hunting. They then concluded that a loss of 25% of their prey would increase hunting times to over 12 h a day. The same formula has subsequently been used to
Hunt distance (km) a
Hunt duration (minutes) b
Median Mean Mean of individual medians
50 100 150 200 250
Count
0 10 20 30 40 50 60 70 80
10 12 14
Count
0 10 20 30 40 50 60
0 6 8
0 2 4
Distance covered 5 min after chase (m) c
0 500 1,000 1,500 0
20 40 60 80 100 120 140
Count
Figure 3 | Hunt parameters in African wild dogs.(a) Histogram of hunt distance covered from end of a chase to end of next chase by the same individual (the distance of 1,870 m used in the energetic calculation is the mean of the individual dog median values,n¼1,119). (b) Histogram of time elapsed between end of one chase and end of next chase by the same individual (n¼1,119). (c) Histogram of distance covered by individual dogs in 5 min after the end of each of their chases (n¼1,119, bin width 25 m).
Instantaneous velocity (ms–1)
Differentiation derived velocity
5 10 15 20 25
5 Hz 0.1 Hz
5 10 15 20 25
Count
0 2 4 6 8 10 12
0 2 4 6 8
b a
Instantaneous velocity (ms–1)
×103
30 s window based on:
Figure 4 | Preferred speed and tortuosity estimates based on
calculate predator–prey body size correlations37, substituting the direct metabolic measurements with resting38 and hunting39 costs derived from the literature using estimated average travel speeds (v) proportional to body weight (Mb)38,39,
Eh¼10.7Mb0.684nþ6.03Mb0.684. For a 25-kg African wild
dog, this results in a hunting cost of 1.37 MJ when hunting for 3.45 h or 2.40 MJ when hunting for 6 h as suggested by Carbone37. This is in stark contrast to Gorman16, who attributes 10.83 MJ of the daily expenditure to hunting of which 10.08 MJ are net locomotion costs (15.3 MJ24 h217.5 kJ).
Median: 235 m Median: 66 m Median: 317 m
Distance 5 min before chase (m)
Distance between 10 and 5 min before chase (m)
Distance 10 min before chase (m)
a b c
d e f
Distance 5 min before chase (m)
Distance between 10 and 5 min before chase (m)
Distance 10 min before chase (m)
Mean: 255 m Mean: 88 m Mean: 343 m
0 1,000 2,000
Count
0 10 20 30 40
0 1,000 2,000 3,000
Count
0 5 10 15 20 25 30 35 40 45
0 500 1,000 1,500
Count
0 50 100 150
0 1,000 2,000 0 500 1,000 1,500 0 1,000 2,000 3,000
Count
0 40 80 120 160
Count
0 100 200 300 400
Count
0 40 80 120
Median: 473 m
Median: 216 m Median: 700 m
Mean: 255 m
Mean: 88 m
Mean: 343 m
A. wild dog Cheetah
Figure 5 | Comparison of African wild dog and cheetah hunt parameters.Histogram and kernel density estimate for cheetah (a–c; number of cheetahsN¼5; number of huntsn¼381) and African wild dog (d–f; number of dogsN¼6; number of huntsn¼1,119; including cheetah kernel density estimate normalized to African wild dog count (blue)). Distance covered 5 min before the start of chase (a,d) between 5 and 10 min before chase (b,e) and 10 min before chase (c,f).
Count
0 200 400 600 800
Count
0 500 1,000 1,500 2,000 2,500
Count
0 500 1,000 1,500
Count
0 2,000 4,000 6,000 8,000
10,000 ×10
4
0 2 4 6
Count
×104
0 1 2 3
Speed (ms–1)
10 15 20 25
Centripetal acceleration (ms–2)
–10 –5 10
Tangential acceleration (ms–2)
–10 –5 10
0 5 0 5 0 5
f e
d
Median: 5.7 ms–1
Mean: 6.4 ms–1
Count
Speed (ms–1)
10 15 20 25
Centripetal acceleration (ms–2)
–10 –5 10
Tangential acceleration (ms–2)
–10 –5 10
0 5 0 5 0 5
a b c
Median: 11.0 ms–1 Mean: 10.6 ms–1
A. wild dog Cheetah
This major discrepancy suggests that either (i) African wild dogs have considerably higher hunting locomotion costs than body size suggests (ii) not all locomotor costs are attributed to hunting or (iii) the energy gained in 3.45 h of hunting exceeded the daily energy expenditure. The neglect of the food intake of dependants (yearlings and pups) in Gorman’s calculation has been raised previously31.
Here we develop that model as follows. The additional energy consumption during hunting (compared with resting) is largely attributable to locomotion, and the actual cost incurred can be determined from the distance each dog covers at low and at high speed while hunting (and separate from ranging). We determine the distance covered at low and high speed in each hunt along with hunt outcome (kill or no kill) and calculate a cost for actively hunting dogs and following (non-hunting) dogs. We separate the hunting and following dogs, since their energy consumption does differ because the hunters undertake high-speed locomotion and cover a greater overall distance. Hunters also actively contribute to increase the pack’s kill rate. We then explored the impact on energy return of pack composition, prey size, hunt distance (which implies prey density), cost of transport (COT) estimates and kleptoparasitism. The model development is also displayed in Supplementary Fig. 5.
The Gorman model balances energy expenditure (resting and hunting) with energy gain and takes the form:
HdI¼24ErþHdEhHdEr ð2Þ
Given that our expenditure calculation is based on distance covered and COT, we parameterise the model power as total energy inputs (EIn) in MJ per day and convert to hunting
time at the final stage. In addition, our locomotion costs (ELocomotion¼HdEhHdEr) are net locomotion costs, that
is, costs in excess of the daily basal metabolic costs (EBMR¼24
hEr). Gorman’s model therefore takes the form:
EIn¼EBMRþELocomotion ð3Þ
We then distinguish between locomotion costs for hunting (EHunting) and non-hunting (ERange) purpose to take the form:
EIn¼EBMRþERangeþEHunting ð4Þ
ERange and EHunting are net locomotion costs above the resting
cost, and are based on the distance travelled during each activity and net metabolic cost of moving a metre (netCOT, J m1).COT
is assumed to be lowest and almost independent of gait35when moving at a preferred speed within a gait, but increases, when deviating from preferred speeds35,40. All costs are calculated in mega Joule (MJ) for a 29 kg dog. BothEInandEHuntingdepend on
the number of kills per day (nK):
nKEK In¼EBMRþERangeþnKEK Out ð5Þ
whereEK_Inis the energy intake per kill (depending on prey size,
energy value and average daily consumption) and EK_Outis the
energetic cost per kill:
nK¼
EBMRþERange EK InEK Out
ð6Þ
The cost per kill for an individual dog depends on the locomotor cost per hunt (EHunt) and the number of hunts an individual has
to perform, on average, to make a kill (individual kill rate,KRi).
EK Out¼ EHunt
KRi
ð7Þ
A hunt is subdivided into low-speed (walking and trotting at preferred speed) phases and high-speed chase phases (canter and gallop), and different locomotor costs (COT) are attributed to low
(preferred) and high speeds40.
EHunt¼COTLowDLowþCOTHighDHigh ð8Þ
where DLow and DHigh are the distances covered at low and
high speeds, respectively, and COTLow and COTHigh are the
corresponding net costs of transport. So these equations give the energy required for a solitary dog to make one kill and relate that to the daily requirements for maintaining energy balance.
Extending model to account for pack size and composition. The next stage extends the model to account for the fact that the cost per kill depends on pack size and composition in a nonlinear fashion. The number of kills is then represented by equation (6) multiplied by the number of dogs, for fixed costs such as ranging and resting and pack-specific kill gains and costs. The energy balance for the pack is:
nK¼
nDogsEBMRþnDogsERange EPK InEPK Out
ð9Þ
where nDogs is the total number of dogs in pack,EPK_Out is the
pack’s energy expenditure per kill andEPK_Inis the pack’s energy
gain per kill.
EPK_In depends on number of dogs eating, their average
consumption in kg and energy value of content eaten in MJ kg1 and has an upper limit based on the prey size.
EPK_Out changes with pack composition, and is the sum of
locomotion cost associated with the number of dogs actively hunting (nHunters) and the locomotion cost incurred by the
number of dogs travelling with the hunting party (nFollowers), but
not participating in hunting:
EPK Out¼EK OutðHuntersÞþEK OutðFollowersÞ ð10Þ
where EK_Out(Hunters) is the energy expenditure per kill for all
hunters (equation 11) and EK_Out(Followers) the cost for all
followers (equation 12). The distinction is required to reflect the fact that hunters run at high speed, incurring a higher cost and covering a greater distance (Fig. 4) and increase the pack’s kill rate. In a pack such as ours that is comprised entirely of actively hunting members EPK_Out¼EK_Out(Hunters). The pack’s
kill rate (KRp) increases proportionally with the number of dogs
hunting (KRp¼KRinHunters); or in other words, the number of
hunts per kill stays the same, but multiple hunts can be conducted simultaneously, as illustrated in Fig. 7, distributing the distance travelled per kill between individuals as well as reducing the time to achieve a kill (assumptions: no cooperation; individuals act as solitary hunters even if chases happen simultaneously, no change in individual kill rate when in a group32):
EK OutðHuntersÞ¼
EHuntðHuntersÞ
KRP
nHunters
¼EHuntðHuntersÞ
KRinHunters
nHunters¼EK Out ð11Þ
Followers do not contribute to the pack’s kill rate or chase frequency, but incur additional locomotor cost:
EK OutðFollowersÞ¼
EHuntðFollowersÞ
KRP
nFollowers
¼EHuntðFollowersÞ
KRinHunters
nFollowers ð12Þ
The cost per killEHuntis higher for hunters than followers due to
therefore:
EHunt Huntersð Þ¼COTLowDLowþCOTHighDHigh ð13Þ
EHuntðFollowersÞ¼COTLowDLowþCOTLow DHigh
2 ð14Þ
To calculate the daily hunt time (Hd) based on number of kills
(nK), hunt duration (HH) and pack’s kill rate (KRP):
Hd¼nK HH KRP
ð15Þ
Basal metabolic cost. To populate equation (9), we calculate
EBMRat 243.2 kJ h1for our 29 kg (mean mass of adults in the
pack) African wild dogs using the same empirically derived for-mula for domestic dogs41that was used by Gorman for his 25 kg dogs;EBMR¼24 h243.2 kJ h1¼5.84 MJ.
Ranging cost. Not all locomotion is hunting and we assume that dogs move at preferred speeds when ranging (Fig. 4a).ERange is
the result of ranging distance and COT35. Having established the use of preferred walking and trotting speeds in our dogs, we use the same COT for walking and trotting. A published, speed-independent energetic COT for African wild dogs taken from regression line of ref. 39 results in a net cost (COTLow) of 107 J m1 for 29 kg dogs. Using a ranging
distance of 7,176 m per day (median distance travelled per day (11,720 m)–median hunt distance (1,870 m)chases per day (2.43));ERange¼7,176 m107 J m1¼0.77 MJ.
Kill gain. We calculate the food intake based on the upper end of an average daily consumption of 2.5–3.5 kg (refs 7,16,19). Assuming the carcass to contain a median of published energy values of 6 MJ kg1 (refs 16,19), the average maximum energy gained from a kill is 3.5 kg6 MJ kg1¼21 MJ per dog.
No direct information on prey size and species is available for our data set. However, over 80% of prey captured by African wild
dogs in this study area are impala (Aepyceros melampus)42. Impala calving occurs at the beginning of the wet season43 in November. This study ran from April to September, so small calves were not available, leaving a range of impala size between juvenile (5 months growing to 10 months through the study) and male adults, that is, from 20 to 60 kg (ref. 44). For the purpose of this model, we assume an average prey weight of 40 kg (female impala) of which at least 60% is edible19, leaving a maximum energy gain of 40 kg0.66 MJ kg1¼144 MJ.
For a pack of dogs, the energy gained per kill (EPK_In) increases
linearly with the number of dogs eating until a number of dogs is reached that consume the entire prey. EPK_In¼21 MJnDogs;
limit 144 MJ.
Kill cost. The cost per kill depends on distance travelled in a hunt, the kill rate, theCOTand the pack’s size and composition. We measured a 0.155 individual kill rate for hunts (Fig. 3c) when treated as solitary event KRi¼0.155. We analysed the hunting
energetics data for each dog separately, meaning that values were calculated for each individual and then combined when evaluating the pack’s performance and energy balance. We used the mean of individual dog median values to populate the model as a representative measure of typical hunts.
We calculate hunt cost (EHunt) based on distance covered and COT. WhileCOTat preferred speeds is gait independent, it has been argued that for dog-sized animals theCOTis approximately four times higher than at preferred speeds when manoeuvring, accelerating and chasing at high speeds40. We therefore divided the hunt into two phases: the phase to seek out prey, which is covered at low (preferred) speed, and the chase phase that is covered at high speed. Median distance per hunt is 1,870 m (Fig. 3a; Supplementary Table 2), with a median chase distance of 324 m, and the remaining 1,546 m at preferred speeds of walk and trot: EHunt (Hunter)¼107 J m1
1,546 mþ(4107 J m1)324 m¼0.30 MJ (equation 13). If a dog does not participate in the chase, the distance of the chase is halved due to reduced tortuosity (Fig. 4) and covered at lower speed: EHunt(Follower)¼107 J m11,546 mþ107 J m1
(0.5324 m)¼0.18 MJ (equation 14).
For a pack entirely composed of hunters (so dogs are hunting simultaneously but not necessarily chasing simultaneously),
EPK_Out¼EK_Out¼0.3 MJ/0.155¼1.96 MJ (equation 11).
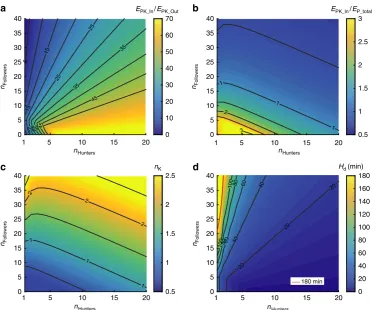
Pack size and composition. We calculated the kill gain to kill cost (EPK_In/EPK_Out) ratio for packs of different size and
composition (Fig. 8a) and showed that this ratio is very favourable for a large range of pack sizes and compositions. When expressed as the ratio of kill gain to total daily expenditure (EPK_In/EP_total; Fig. 8b) it shows that one 40 kg impala can sustain
a large number of dogs. If the need arises to hunt again, the cost of making an additional kill (EPK_Out) is easily balanced
energe-tically. The number of kills necessary to sustain a pack (Fig. 8c) is quite low even for very unfavourable pack compositions of one or two hunters and many followers. However, while the energetic costs are low, total hunting duration may be considerably more critical. Figure 8d shows the total daily hunting time (Hd)
required to make the required number of kills rises sharply with a decreasing number of hunting individuals in a pack with many followers. The effects of kleptoparasitism and variation in prey size andCOTare displayed in Fig. 9a,b.
Discussion
Accounts and public perceptions of African wild dog hunting are of large packs chasing down large antelope over long distances on the open grass plains. The historical decline in African wild dog Multiple hunter scenario
Solitary hunter scenario
Successful chase
Unsuccessful chase
Preparation phase a
b Hunt distance
Distance follower
Kill distance
Figure 7 | Comparison of solitary versus group hunting scenarios.
numbers has been attributed to a variety of reasons including predation (including humans), habitat loss, diseases, interspecific kletoparasitism and very high hunting costs16,22,45. Our focal pack inhabits an area with significant scrub and woodland, and displays a very different hunting style. Rather than long collaborative pursuits of one large prey, they hunt opportunistically, executing short high-speed chases after one
or more medium-sized prey. Calculating locomotor expenditure for this short opportunistic hunting style shows that hunting is energetically rather cheap in comparison with total daily energy expenditure. However, time available for hunting can be a limiting factor due to increased heat and predator encounters or decreased prey availability at different times of the day. Gorman
et al. estimated a daily hunting and ranging time of 3.45 h for 10
1 5 15 20
nHunters nHunters
nHunters nHunters
a
0 5 10 15 20 25 30 35 40
5
15
15
25
25
25
35
35
35
45
45
0 10 20 30 40 50 60 70
0 5 10 15 20 25 30 35 40
1 1
1
2
3
0.5 1 1.5 2 2.5 3
0 5 10 15 20 25 30 35 40
1
1
1 2
2
2
0.5 1 1.5 2 2.5
0 5 10 15 20 25 30 35 40
20
20
20
40 40
60 60
80 80
100 100
0 20 40 60 80 100 120 140 160 180 10
1 5 15 20
b
10
1 5 15 20
c
10
1 5 15 20
d
180 min
nFollowers nFollowers
nFollowers nFollowers
EPK_In/EPK_Out EPK_In/EP_total
Hd (min)
nK
Figure 8 | Energy model outcome for African wild dogs.(a) Maximum pack energy gain per kill (EPK_In) divided by pack energy expenditure per kill
(EPK_Out) for different pack sizes and compositions (40 kg impala, 3.5 kg dog stomach capacity). (b) Maximum pack energy gain per kill (EPK_In) divided by
total daily pack energy expenditure including one kill (EP_total) for different pack sizes and compositions (sustainability line at 1). (c) Number of kills
necessary to fulfil daily energy requirement of pack (basal metabolic costþranging costþxtimes kill cost). (d) Total daily hunting time based on number of kills required; based on kill rate and time between hunts (22.58 min), red line indicated 3 h daily hunting boundary.
0 5 10 15 20 25 30 35 40
5 10 15 20
1
nHunters nHunters
nFollowers nFollowers
80% 60%
20%
40% 60% 80%
0%
0% 20% 40%
10 15 20
1 5
0 5 10 15 20 25 30 35 40
a b
180 min
180 min;COT *X
COT; 40 kg COT *X; 40 kg COT; 20 kg COT *X; 20 kg COT *X; 20 kg; 3rd quartile
Figure 9 | Influence of different model parameters on model outcome.(a) Effect of kleptoparasitism andCOTerror analysis. Boundary on sustainable pack composition assuming a 180 min limit on daily hunting time. Red lines indicate boundary (pack composition to the right of the line is sustainable) for different percentages of prey stolen (40 kg, impala). Blue lines indicate sustainability for higherCOT(COTLow2.5;COTHigh1.5) based on ref. 47.
their pack. Figure 8d shows that even when assuming a maximum hunting time of B3 h per day (duration of morning hunting period), even a single dog could theoretically support a large number of followers (up to 22). However, due to the nature of our study, we rely on estimates of two factors that could influence the outcome considerably: prey species and size, and COT. We changed both of these variables in turn and together, and reran the analysis to evaluate the robustness of our conclusions (Fig. 9b). Following the argument that African wild dogs might prefer juvenile impala and considering it is unlikely that the kill detection methods used will detect small prey such as hare (similar to direct observation, it will be biased towards larger prey that take longer to eat), we assumed an average prey size of 20 kg rather than 40 kg. In addition, studies have shown thatCOTcan be influenced by surface properties and could be considerably higher on softer ground46–48. The netCOT for human walking and running in sand has been measured to be 2.1–2.7 (walking) and 1.6 (running) times higher than on a hard surface; long grass would also increase COT. We applied a factor of 2.5 and 1.5 to our low- and high-speedCOT, respectively47. Figure 9b shows the effect of reduced prey size, increasedCOTon pack sustainability when assuming a 3-h hunting limit. Despite these most conservative assumptions our pack of six adult hunting dogs could still theoretically support almost 40 followers, showing that energy balance is not as critical in our population as previously described elsewhere. Using the upper quartile for hunt distance and duration to simulate the impact of potentially lower prey density (Fig. 9b), also shows that prey density has a significant effect on the energy balance especially for very small packs; however, despite this, our six-dog pack could theoretically still support up to 16 followers.
The loss of prey (mainly to spotted hyaena (Crocuta crocuta)) and its impact on African wild dog population has been discussed extensively16,21,30,31,45,49,50. The rate of kletoparasitism differs considerably across ecosystems and has been linked to habitat and hyaena density49. In open habitats, kletoparasitism is common and the ability to defend kills against hyaena depends on pack size21. So, the assumption that kletoparasitism is very detrimental to maintaining positive energy balance would apply if dogs already operate with a low margin of energy excess in areas without kletoparasitism16,50. However, our calculations of locomotor costs based on the hunting strategy of short, high-speed chases in our pack do not support this claim. Even when accounting for the cost of dependants, hunting costs are low in comparison with total daily energy expenditure. Calculations on sustainable pack size and compositions for different amounts of prey carcass stolen (Fig. 9a) show the relatively large margin of energy excess in a African wild dog pack of our size, allowing for substantial amounts of carcass being stolen.
If prey density were low (impala, the most common prey, density isB15 impala per km2in the study area51,52), then dogs would have to travel further between chases. In this context, hunting time may exceed the optimum time window and be compromised by heat or light. This effect would be most marked in the hot season rather than the cooler denning season and in smaller packs, and may be exacerbated in the future by warming effects of climate change.
As our pack hunted daily and killed and ate frequently, we chose an average daily consumption of 3.5 kg (refs 7,16,19). However, African wild dogs are capable of eating up to 9–11 kg (refs 19,21), likely when they have not have eaten for several days, which would make them robust to energy deficit during periods of low kill rate. In these situations, a medium-sized prey would feed fewer individuals to the maximum possible energy intake so there would be a benefit in capturing larger prey.
The most critical time for very small packs would be during the denning season when the dominant female, any additional guards, and pups will be fed via regurgitation, effectively reducing an individual’s prey intake even if the prey is not completely consumed (dogs hardly ever return to a carcass). However, this might be compensated for by the capacity to eat more than the assumed 3.5 kg.
Loss of kill would have a much higher impact if the energetic cost per kill was high, such as in long endurance hunts of larger prey where many dogs invest substantial energy expenditure in one kill. In this case, larger pack sizes and the ability to defend the kill against hyaena21could be crucial.
Nothing is known about the hunting style of the pack studied in Gormanet al.Due to habitat, they assume no loss to hyaenas. They also assume the yearlings to be effective hunters. However, if the yearlings were not yet effective hunters18, this would increase the number of dependants, altering the pack composition significantly.
Both African wild dogs and cheetahs thrive in our study area and both hunt mostly impala (480% of kills for both species12,14,42) but have very different hunting styles. The cheetah stalks and sets up a hunt, while in our study area African wild dogs routinely travel at higher-speed (Fig. 5) flushing prey and then undertaking many opportunistic chases. In our focal pack, individuals chased prey almost twice as often as cheetah did, with chases containing almost twice as many strides4. The highest speeds for African wild dogs were 5 ms1 slower than for cheetahs4,53and African wild dog peak centripetal acceleration, a measure of maximum turning performance, was almost half that of cheetahs4. The proportion of strides at high speeds or high tangential and/or centripetal acceleration were lower in African wild dogs (Fig. 6). It is therefore unsurprising that dogs had a lower individual kill rate than cheetahs (0.155 versus 0.26).
We tested the hypothesis that hunting in African wild dogs has a lower hunt return than cheetahs due to the lower individual kill rate and longer hunts, despite the benefits of group hunting and group feeding, by parameterising the above model with equivalent data for five cheetahs in the study area4. We use the
COTextracted from ref. 40 and a prey size of 40 kg for both the species.
African wild dogs cover double the distance of cheetahs each day (Median distance per day: African wild dog 11.8 km; cheetah 5.6 km). For this calculation, half the cheetah locomotion is taken as searching out and hunting (similar to our focal pack of African wild dogs), while the median distance covered during chasing is 139 m. This yields a distance of (2,800139)/0.26¼10,235 m at low speed and 535 m at high speed per kill. Mean cheetah mass was 50 kg (ref. 4) yielding 154 J m1for COTLow when moving
slowly and 581 J m1for chaseCOTHighwhen moving quickly40;
this gives a kill cost ofEK_Out¼1.89 MJ (solitary African wild dog
or pack with no dependants was EK_Out¼EPK_Out¼1.94 MJ).
Cheetahs (50 kg) are larger than African wild dogs and eat approximately the same proportionally24,27, that is, 7 kg and
EK_In¼42 MJ. This gives a kill gain/kill cost ratio (EK_In/EK_Out)
for a solitary hunting cheetah of 22 times locomotor cost—about double the 11 times locomotor cost for a solitary dog. So, a solitary cheetah is, in energetic terms, a more efficient hunter than a solitary African wild dog. However, hunting in a pack can boost the African wild dog pack’s kill gain/kill cost ratio (EPK_In/ EPK_Out) to up to 73, almost triple that of a solitary living cheetah
kleptoparasitism from an energetics point of view; a conclusion in agreement with recent studies about cheetah hunting27.
The African wild dog pack captured prey by performing short, high-speed chases, while hunting using relatively efficient gaits. Using an energy balance model accounting for kill rate, hunt distance, group composition (hunters and followers) and an estimated prey intake, our calculation of energy return from hunting opportunistically, using short high-speed chases, revealed considerably lower hunting costs than previously suggested. However, while hunting after the loss of kill might be energetically rather cheap, the pack might be compromised by the time window available for efficient hunting, especially in the light of higher temperatures due to climate change and low prey densities with habitat fragmentation. Prey size and consequently hunting style will have a considerable effect on the impact of kleptoparasitism, with losses being harder to overcome when using sophisticated endurance strategies where several animals invest highly in the same hunt.
Comparison of African wild dog and cheetah hunting reveals that while cheetah hunts are energetically more expensive, their higher individual kill rate yields a higher kill gain to kill cost ratio for solitary animals, which is ultimately more than balanced in African wild dogs by the sharing of kills. This illustrates the trade-off between the sheer athleticism54and high individual kill rate characteristic of cheetahs, and the physiology and broad ranging of opportunistically hunting African wild dog packs that rely on sharing kills.
Methods
Animals.The packs in this study were located in the Okavango Delta region of Northern Botswana and are part of an ongoing study by Botswana Predator Con-servation Trust (http://www.bpctrust.org). Every member of a pack of six adult dogs (‘focal pack’) was collared. The pack consisted of a dominant male (‘Kobe’) and dominant female (‘Timbuktu’), two subdominant males (‘MJ’, ‘Scorpion’) and two subdominant females (‘Accra’, ‘Kigali’). Data collection on all pack members started on 13 April 2012 and continued over the following 5–7 months, with one collar failing on 27 May. The collar was replaced, but the failure resulted in a lack of data for one dog (‘Accra’) over a period of 22 days. This time period was removed from our analysis. Collar removal started at the end of August 2012. One dog (‘Kobe’), the dominant male, died on 27 June. The data from the dominant female (‘Timbuktu’) show a period of low activity when she remained at the den with pups. Distance travelled per day was calculated excluding the denning female Timbuktu.
The dogs were immobilized by free darting from a vehicle using xylazine (55 mg), ketamine (50 mg) and atropine (1.1–1.2 mg), and reversed after 45–60 min with yohimbine (4 mg) or atipamezole (5.5 mg). While sedated, anatomic measurements including limb lengths, limb and body girths, and body mass were recorded (Supplementary Table 1). Collar data were retrieved via radio link to a ground vehicle every few weeks.
This work was approved by RVC Ethics & Welfare Committee. Northern Botswana holds part of one of the largest African wild dog populations. The common kleptoparasites of African wild dogs are spotted hyaenas
and lions (Panthera leo).
Comparison with other packs.To demonstrate that our focal pack is representative of all the packs in the area, we used high-resolution GPS collar data from 18 subdominant individuals from 13 different packs in the area. The collars worn by African wild dogs outside the focal pack were either the same as or an earlier version of the collars used on the focal pack. Outside the focal pack data were recorded at 1-h intervals when dogs were resting and at 5- or 10-min intervals when they were moving. Only four collars were allowed to go into ‘run state’ for a limited trial period not exceeding a total of 2 months (see collar below). Data were collected for time slots of different duration (21–409 days) between November 2011 and October 2014.
Distance travelled per day and run parameters (maximum stride speed, centripetal (turning) acceleration and tangential (fore-aft) acceleration and deceleration, duration, distance and mean absolute heading rate) were compared using the mean of the individual medians in the focal group and the group
containing all individuals from other packs. We used a two-sampleF-test to check
for equal variance and subsequently a two-samplet-test or Welch’s test;pvalues
were adjusted using Bonferroni correction.
We found no significant difference (Welch’s test,p¼0.09) between the mean of
the medians of the distance travelled per day by individual dogs of the focal pack and the mean of medians of the other dogs (Supplementary Table 2).
Equally when we compare run parameters (maximum stride speed, tangential acceleration/deceleration, centripetal acceleration, mean absolute heading rate, duration and distance) of our focal pack to four individuals in different packs, only one, mean absolute heading rate, came out to be significantly different (Supplementary Table 3).
Comparison with cheetahs.We reanalysed previously collected and published
GPS/IMU data4from five wild cheetahs (three female and two male) using the
same methods as described here to compare locomotor performance of cheetah and African wild dog. The cheetah data were collected in the same study area (in and around the Moremi game reserve, Okavango Delta, Botswana) between July
2011 and August 2013. Data collection continued after publication4and we added
the new data into our analysis, bringing the total number of runs analysed from 367 to 488, including 468 chases.
Collar design and data recording.Power consumption poses a major challenge in the design of a wildlife tracking collar. To fulfil the demands of sufficient data rate during periods of high animal activity and average low-energy consumption, we
used collars designed in-house and previously used successfully on cheetahs4. The
collars use in-built solar cells on the top housing and careful management of the GPS sample rate for power conservation. The mass of the mark two collars was
B340 g. Dropoff units (Sirtrack; 70 g) were used to release two collars at the end of
the study. Other collars were removed following immobilization.
The collar was controlled by a low-power MSP430 16-bit microcontroller (Texas Instruments Inc., TX, USA), running custom software written in the ‘C’ programming language. A 2-GB micro-SD flash memory card (Sandisk, CA, USA) was used for on-board data storage.
The collar provides GPS position and instantaneous velocity data as well as three-axis-specific force and rotation rate data. GPS position and velocity were obtained from an LEA-6T GPS module (u-Blox AG). An MMA7331 three-axis accelerometer module (Freescale Semiconductor) provided specific force with a
±12grange. The roll and pitch rotation rate were measured by a dual-axis
gyroscope (ST Microelectronics), and yaw rotation rate by a single-axis gyroscope
(ST Microelectronics), both set to the 2,000°s1range. Sensor outputs were
filtered by simple single-pole analogue filters (100 Hz knee), and then sampled by the microcontroller at 300 (accelerometers) or 100 (gyroscopes) samples per second. Data download from the collar were via a 2.4-GHz chirp-spread-spectrum communication module (Nanotron Technologies Gmbh). Power was provided by two batteries: a 900-mAh lithium–polymer rechargeable battery (Active Robots), charged by a solar cell array consisting of 10 monocrystalline silicon solar cells (Ixys Koria), and a 13-Ah lithium thionyl chloride battery (Saft). The microcontroller measured both battery voltages and the charge current from the solar cell array, and switched the collar electrical load between batteries depending on the battery state.
To manage power consumption effectively, the collar was programmed to switch dynamically between four different operating ‘states’ (Supplementary Fig. 6). The state depended on the time of the day and the animal activity level (measured using the accelerometers). The different states enabled power rationing between average power consumption on the one hand, and quantity and resolution of data on the other. Multiple software updates were installed on the collars (remotely) during the research period to improve performance and capture as many hunts as possible. The default state (‘alert state’) provided GPS positions every hour, and allowed the transition into ‘mooch state’ with 5-min fixes when the animal was deemed active, based on periodic specific force measurements (measurement taken for 10 s at 30 Hz every minute). Initially, the collar was set to ‘ready state’ when the animal was moving between local times of 18:00 and 20:00, since previous work
suggested that most hunting occurs around dawn and dusk33. In ‘ready state’, GPS
positions and speeds were recorded every 5 s, if the animal was deemed to be active. A transition occurred from ‘ready’ state to ‘run state’ if fore-aft accelerometer data exceeded a threshold equivalent to galloping in three consecutive peaks, and the run was defined as valid and stored if five further peaks were detected. In ‘ready state’, accelerometer data were recorded into a circular buffer at 100 Hz, the buffer storing the latest 3 s of data. This prebuffering allowed open-loop inertial navigation back to the beginning of the run. However, it was later deemed that an extended time allowed for entering ‘run state’ was more beneficial than the prebuffering of data. Prebuffering was abolished on 26 April 2012; this resulted in the loss of the first one or two strides at the beginning of the run. From then on, the collar was allowed to enter ‘run state’ directly from ‘mooch state’ during preselected ‘times of interests’ between 4:00–10:00 and 17:00–22:00 local time. During the ‘times of interest’, GPS data were recorded every 5 min (the same as during normal ‘mooch state’), but sample rates were increased to every 10 s for a 2-h window within the ‘times of interest’ to get a more accurate account of position during times when most hunts were expected to happen based on initial data observations. Initially, this time was chosen to be between 18:00 and 20:00, and later changed to between 06:00 and 08:00 local time.
In the ‘run state’, the power management features used gave different sampling rates for accelerometer (300 Hz) and gyro (100 Hz). GPS position (5 Hz) and instantaneous velocity (5 Hz) were usually (but not always) available within 1 s after entering the ‘run state’ but often not accurate until 4–6 s later (Supplementary Fig. 7c–f).
To reduce noise, improve precision and increase temporal resolution in the position and velocity data, GPS and IMU measurements were fused as previously
described4using a 12-state extended Kalman filter55followed by a Rauch–Tung–
Striebel smoother56written in MATLAB (The Mathworks Inc., MA, USA)
(Supplementary Fig. 7a,b).
Definition of locomotion.There is no global definition of the terms hunting, hunt or chases, and in the context of this study, we define the terms as followed: hunting is all locomotion in the pursuit of food and encompasses multiple (mostly unsuccessful) hunts. A hunt is the locomotion in search (slow speed) and pursuit of a prey individual ending in a high-speed run (chase). We realised that some terms used might require a more extensive explanation due to the two-level analysis carried out to look at individual and pack performance. Terms such as ‘hunt’, for example, can be applied to an individual or the pack. At the pack level, it is often defined as the time from the end of one group chase to the end of the next group chase (group hunt). Since not all individuals necessarily participate in a group chase, we defined hunt on an individual basis, encompassing the time and distance from the end of one chase to the end of the next chase by the same individual. A hunt encompasses a slow-speed (search) and a high-speed (chase) phase. Hunters: individuals actively hunting i.e. chasing and killing prey; Followers: individuals accompanying hunters, but not actively pursuing prey (pups and yearlings up to a certain age); Ranging: all non-hunting locomotion such as border patrol or return to the den; Foraging success: Energy gain per day.
Data analysis.The recording at high-sample rate was triggered by the IMU and continued as long as the horizontal acceleration threshold was exceeded within a 5-s window. Overrun times between 5 and 20 s were implemented depending on the software update. Recordings at 5 Hz were restricted to 87 s and runs exceeding
this time, while still showing speeds above 3 ms1were reconstructed based on
10-s data. We were unable to reconstruct the ending of 5.7% of the runs and assigned an ending randomly chosen out of the pool of reconstructed endings, assuming the distribution is representative for all runs exceeding 87 s. Eighty
per cent of the runs lastedo87 s and only a few (2.4%) lasted significantly longer.
The difference in median distances covered per run between reconstructed and non-reconstructed data was 2.7%.
Recorded activity lastingo5 s and never exceeding 3 ms1(instantaneous GPS
velocity) were excluded from the analysis leaving a total of 2,026 runs to be analysed; 69 runs failed to produce converged Kalman-filtered results (speed going towards infinity) and were removed. Sufficient strides (at least three per run) were successfully extracted from 1,641 runs. In 4% of the cases (65 runs), a second run was triggered within 30 s of the first ending, and the two recordings were classified as a single run. The two runs were combined by linear interpolation of position and hence speed to fill the gap between them. A total of 1,551 runs (140,141 strides)
contained at least one stride whose average speed exceeded 3 ms1(a speed
determined to be slow canter). Runs exceeding a 6 ms1(galloping) stride speed
threshold were classed as chases. We recorded 1,119 valid chases.
Individual kill rate.Individual chases were automatically classified as successful (ending in kill) if the animal remained for at least 5 min within a 50-m radius of the end of the chase. Automatically determined kills were validated by animating chases and observing pack behaviour such as converging to a supposed kill site and remaining there for at least 5 min (examples in ref. 32 and Supplementary Movie 1).
Daily distance travelled.Data collected under the different collar states were combined onto a single timeline to determine distance covered per day. Mean speed of each dog when moving slowly was taken as the straight-line distance/time between 5-min GPS fixes so is an underestimate if a tortuous route was followed.
Calculation of speed and stride frequency.All data analysis was carried out using MATLAB. Fore-aft acceleration was used to determine stride peak times and stride frequency. A band-pass Butterworth filter (4th order) was applied with cutoff frequencies of 1 and 8 Hz, and assuming a maximum stride frequency of 3 Hz, a peak detection function was used to detect peaks with a minimum duration of 0.33 s between peaks and a minimum peak height of 0.5 g. Maximum horizontal stride speed was derived from the Kalman-filtered and smoothed velocity averaged over strides.
Tangential acceleration, change of heading and centripetal acceleration over stride.Mid-stride times were used to calculate tangential (fore-aft) acceleration, centripetal (turning) acceleration and change in heading between strides. The
displacement vectors between consecutive strides were then calculated:
Pi1!Pi¼!PiPi!1 ð16Þ
and
PiPiþ1
! ¼Piþ1
! Pi
!
ð17Þ
WherePi
!
is the two-dimensional position at sample/stridei.
Change of heading (Dyi) was calculated from the angle between the two vectors:
Dyi¼sin1
PiPiþ!1Pi1!Pi
PiPiþ1
!
Pi1Pi !
0
@
1
A ð18Þ
Angular velocity (oi) was derived by dividing the change of heading by the time
between mid-stride positionsDT:
oi¼ Dyi
DT ð19Þ
The tangential or fore-aft acceleration (at,i) and centripetal acceleration (ac,i) were
then computed from mid-stride speedsvi:
at;i¼ viþ1vi
DT ð20Þ
ac;i¼v 2 i ri
¼oivi: ð21Þ
To reduce outliers, tangential and centripetal acceleration were based on weighted stride speed and weighted heading rate taking the stride before and after into account in an approach described in ref. 4 and the companion cooperation paper.
Negative values for tangential acceleration indicate deceleration. Positive and
negative values for centripetal acceleration indicate right (þ) and left () turns.
Positive and negative centripetal acceleration values are presented separately to show if there was a preference for left-hand or right-hand turns.
Run distance.Distances covered within individual runs were calculated by integration of the stride-averaged horizontal speeds over the duration of the run.
Total hunt distance was based on chase distance and the distance covered at lower speeds between the end of one chase to the end of the next chase during a morning and evening hunting session of 5 h each.
Maximum speed reliability.The maximum stride speed of 19 ms1was reported for the following reasons: (1) all individuals achieved this speed at least once, (2)
19.4 ms1is the 99th percentile from maximum stride speeds from all runs. (3)
Using only maximum speeds from runs above 6 ms1the 99th percentile is
20.0 ms1, taking the s.d. of 0.3 ms1for Kalman-filtered speeds (Supplementary
Fig. 7b) and considering a maximum speed measurement error of three s.d.’s gives
a maximum speed of 19 ms1.
Preferred speeds.African wild dogs travel at distinct preferred speeds while ranging and hunting (outside of chases). To prove this concept, we displayed instantaneous velocity measures by the GPS module for 10-s GPS fixes (walking and trotting) during the morning hunting period. African wild dogs show a
preference to move at speeds around 0.35 ms1(walking) and 2.5 ms1(trotting),
with the measured trotting speed close to the 2.3 ms1predicted by the equation
in ref. 36 of 1.09body mass0.222.
References
1. Cresswell, W. Surprise as a winter hunting strategy in SparrowhawksAccipiter
nisus, PeregrinesFalco peregrinusand MerlinsF. columbarius.Ibis138,
684–692 (1996).
2. Domenici, P. The scaling of locomotor performance in predator–prey
encounters: from fish to killer whales.Comp. Biochem. Physiol. A Mol. Integr.
Physiol.131,169–182 (2001).
3. Hedenstro¨m, A. & Rose´n, M. Predator versus prey: on aerial hunting and
escape strategies in birds.Behav. Ecol.12,150–156 (2001).
4. Wilson, A. M.et al.Locomotion dynamics of hunting in wild cheetahs.
Nature498,185–189 (2013).
5. Bateson, P. & Bradshaw, E. L. Physiological effects of hunting red deer (Cervus elaphus).Proc. Biol. Sci.264,1707–1714 (1997).
6. Estes, R. D. & Goddard, J. Prey selection and hunting behavior of the African
wild dog.J. Wildl. Manag.31,52–70 (1967).
7. Schaller, G. B.The Serengeti Lion: A Study of Predator-prey Relations(Univ. of
Chicago Press, 1972).
8. Taylor, C. R., Schmidt-Nielsen, K., Dmi’el, R. & Fedak, M. Effect of
hyperthermia on heat balance during running in the African hunting dog.Am.
J. Physiol.220,823–827 (1971).
9. Uhlenbroek, C.Animal Life(Dorling Kindersley Ltd, 2008).
10. Carrier, D. R.et al.The energetic paradox of human running and hominid
evolution [and comments and reply].Curr. Anthropol.25,483–495 (1984).
11. Liebenberg, L. Persistence hunting by modern hunter–gatherers.Curr.
Anthropol.47,1017–1026 (2006).
12. Creel, S., Mills, M. G. & McNutt, J. W.Biology and Conservation of Wild Canids
337–350 (Oxford Univ. Press, 2004).
13. Fanshawe, J. H. & Fitzgibbon, C. D. Factors influencing the hunting success of
an African wild dog pack.Anim. Behav.45,479–490 (1993).
14. Durant, S. M.Rangewide Conservation Program for Cheetah and African Wild
Dogs. Available atohttp://www.cheetahandwilddog.org/index.html%3E429
May 2014.
15. Delaney, J. J. & Happold, D. C. D.Ecology of African Mammals(Longman,
1979).
16. Gorman, M. L., Mills, M. G., Raath, J. P. & Speakman, J. R. High hunting costs
make African wild dogs vulnerable to kleptoparasitism by hyaenas.Nature391,
479–481 (1998).
17. Harris, W. C.The Wild Sports of Southern Africa: Being the Narrative of a
Hunting Expedition from the Cape of Good Hope, Through the Territories of the Chief Moselekatse, to the Tropic of Capricorn(HG Bohn, 1852).
18. Creel, S. & Creel, N. M. Communal hunting and pack size in African wild dogs,
Lycaon pictus.Anim. Behav.50,1325–1339 (1995).
19. Creel, S. & Creel, N. M.The African Wild Dog: Behavior, Ecology, and
Conservation(Princeton Univ. Press, 2002).
20. Frame, L. H., Malcolm, J. R., Frame, G. W. & Lawick, H. Social organization
of African wild dogs (Lycaon pictus) on the Serengeti plains, Tanzania
1967–19781.Z. Tierpsychol.50,225–249 (1979).
21. Carbone, C.et al.Feeding success of African wild dogs (Lycaon pictus) in the
Serengeti: the effects of group size and kleptoparasitism.J. Zool.266,153–161
(2005).
22. Burrows, R., Hofer, H. & East, M. L. Demography, extinction and intervention
in a small population: the case of the Serengeti wild dogs.Proc. Biol. Sci.256,
281–292 (1994).
23. East, R.African Antelope Database 1998Vol. 21 (IUCN, 1999).
24. Caro, T. M.Cheetahs of the Serengeti Plains: group living in an asocial species
(Univ. of Chicago Press, 1994).
25. Mills, M. G. L., Broomhall, L. S. & du Toit, J. T. Cheetahacinonyx jubatus
feeding ecology in the Kruger National Park and a comparison across African savanna habitats: is the cheetah only a successful hunter on open grassland
plains?Wildl. Biol.10,177–186 (2004).
26. Bissett, C. & Bernard, R. Habitat selection and feeding ecology of the cheetah (Acinonyx jubatus) in thicket vegetation: is the cheetah a savanna specialist?
J. Zool.271,310–317 (2007).
27. Scantlebury, D. M.et al.Flexible energetics of cheetah hunting strategies
provide resistance against kleptoparasitism.Science346,79–81 (2014).
28. Rasmussen, G. S., Gusset, M., Courchamp, F. & Macdonald, D. W. Achilles’
heel of sociality revealed by energetic poverty trap in cursorial hunters.Am.
Nat.172,508–518 (2008).
29. van der Meer, E., Rasmussen, G. & Fritz, H. Using an energetic cost–benefit
approach to identify ecological traps: the case of the African wild dog.Anim.
Conserv.359–366 (2015).
30. van der Meer, E., Moyo, M., Rasmussen, G. S. & Fritz, H. An empirical and
experimental test of risk and costs of kleptoparasitism for African wild dogs (Lycaon
pictus) inside and outside a protected area.Behav. Ecol.22,984–992 (2011).
31. Jongeling, T. B. & Koetsier, T. The predicament of the African wild dog,Lycaon
pictus, is less precarious than claimed.Afr. J. Ecol.55,466–470 (2014).
32. Hubel, T.Y.et al.Additive opportunistic capture explains group hunting in
African wild dogs.Nat. Commun7,11033 (2016).
33. Cozzi, G.et al.Fear of the dark or dinner by moonlight? Reduced temporal
partitioning among Africa’s large carnivores.Ecology93,2590–2599 (2012).
34. Alexander, R. M. The gaits of bipedal and quadrupedal animals.Intl J. Rob. Res.
3,49–59 (1984).
35. Hoyt, D. F. & Taylor, C. R. Gait and the energetics of locomotion in horses.
Nature292,239–240 (1981).
36. Heglund, N. C. & Taylor, C. R. Speed, stride frequency and energy cost per stride:
how do they change with body size and gait?J. Exp. Biol.138,301–318 (1988).
37. Carbone, C., Mace, G. M., Roberts, S. C. & Macdonald, D. W. Energetic
constraints on the diet of terrestrial carnivores.Nature402,286–288 (1999).
38. Schmidt-Nielsen, K.Scaling: Why is Animal Size so Important?(Cambridge
Univ. Press, 1984).
39. Taylor, C. R., Heglund, N. C. & Maloiy, G. M. Energetics and mechanics of terrestrial locomotion. I. Metabolic energy consumption as a function of speed
and body size in birds and mammals.J. Exp. Biol.97,1–21 (1982).
40. Williams, T. M.et al.Instantaneous energetics of puma kills reveal advantage of
felid sneak attacks.Science346,81–85 (2014).
41. Walters, L.et al.Repeatability of energy expenditure measurements in clinically
normal dogs by use of indirect calorimetry.Am. J. Vet. Res.54,1881–1885 (1993).
42. McNutt, J. W. Adoption in African wild dogs,Lycaon pictus.J. Zool.240,
163–173 (1996).
43. Broekhuis, F., Gru¨newa¨lder, S., McNutt, J. W. & Macdonald, D. W. Optimal
hunting conditions drive circalunar behavior of a diurnal carnivore.Behav.
Ecol.25,1268 (2014).
44. du Plessis, I.et al.Regional differences in growth parameters between two
impala populations.S. Afr. J. Anim. Sci.36,90–94 (2006).
45. Woodroffe, R. & Ginsberg, J. R. Conserving the African wild dogLycaon pictus.
I. Diagnosing and treating causes of decline.Oryx33,132–142 (1999).
46. Fancy, S. & White, R. Energy expenditures for locomotion by barren-ground
caribou.Can. J. Zool.65,122–128 (1987).
47. Lejeune, T. M., Willems, P. A. & Heglund, N. C. Mechanics and energetics of
human locomotion on sand.J. Exp. Biol.201,2071–2080 (1998).
48. White, R. & Yousef, M. Energy expenditure in reindeer walking on roads and
on tundra.Can. J. Zool.56,215–223 (1978).
49. Creel, S. & Creel, N. M. Limitation of African wild dogs by competition with
larger carnivores.Conserv. Biol.10,526–538 (1996).
50. Mills, M. & Biggs, H. Prey apportionment and related ecological relationships
between large carnivores in Kruger National Park.Symposia of the Zoological
Society of London65,253–268 (1993).
51. McCullough, D. & Barrett, R. H.Wildlife 2001: Populations(Springer Science &
Business Media, 2012).
52. Bartlam, H. L.Spatial Heterogeneity in a Dynamic Wetland: Determinants of
Herbivore Distribution in the Okavango Delta and their Relevance to Conservation(Univ. of Bristol, 2010).
53. Williams, S. B., Tan, H., Usherwood, J. R. & Wilson, A. M. Pitch then power:
limitations to acceleration in quadrupeds.Biol. Lett.5,610–613 (2009).
54. Hudson, P. E.et al.Functional anatomy of the cheetah (Acinonyx jubatus)
hindlimb.J. Anat.218,363–374 (2011).
55. Kalman, R. E. A new approach to linear filtering and prediction problems.
J. Basic Eng.82,35–45 (1960).
56. Rauch, H. E., Striebel, C. & Tung, F. Maximum likelihood estimates of linear
dynamic systems.AIAA J.3,1445–1450 (1965).
Acknowledgements
We thank J. Lowe and S. Amos for fabricating and programming collars; K. Roskilly for GPS/IMU fusion code; K. Golabek for coordinating field research; G. Gilfillan, D. Kedikilwe and J. Vitale for field assistance; S. Hailes, J. Usherwood, S. Wilshin and P. Apps for tremendously useful discussions; S. Portugal and AR. Wilson for comments on the manuscript; and the EPSRC (EP/H013016/1), BBSRC (BB/J018007/1) and ERC (323041) for funding. This work was approved by RVC Ethics & Welfare Committee, and was carried out under a permit from the Botswana Ministry of Environment Wildlife and Tourism, Department of Wildlife and National Parks held by J.W.M. The BPCT field research programme is supported by grants from the Paul G. Allen Family Foundation, Wild Entrust International, Tusk Trust and numerous private donors.
Author contributions
A.M.W., J.P.M. and J.W.M. conceived and designed the methods and study, J.P.M., N.R.J. and J.W.M. established, maintained and monitored the study population and directed and conducted field data collection. T.Y.H., J.P.M. and O.P.D. analysed the data, A.M.W. and T.Y.H performed the energetic analysis, interpreted the data and wrote the paper with extensive input from all authors.
Additional information
Supplementary Informationaccompanies this paper at http://www.nature.com/ naturecommunications
Reprints and permissioninformation is available online at http://npg.nature.com/ reprintsandpermissions/
How to cite this article: Hubel, T. Y.et al.Energy cost and return for hunting in African wild dogs and Cheetahs.Nat. Commun.7:11034 doi: 10.1038/ncomms11034 (2016).