Multi-Path D2D Leads to Satisfaction
Edgar Arribas
IMDEA Networks Institute, Madrid, Spain University Carlos III of Madrid, Spain
Vincenzo Mancuso
IMDEA Networks Institute, Madrid, Spain
Abstract—Device-to-Device (D2D) communications poten-tially allow users placed in a cell to establish direct connec-tions among them using several connection modes. In this
paper, we proposeMulti-Path D2D (MPD2D), a mathematical
optimisation framework that accounts for the availability of D2D modes under flow demand requirements. MPD2D selects the combination of cellular and D2D links that fits better for
boosting the network benefit. We consider the Underlay and
Overlay asInband D2D modes over cellular technology (LTE)
and the Outband D2D mode exploiting WLAN technology
(WiFi). Throughput, energy consumption, interference, and flow requirements are managed in order to maximise a network utility function accounting for cell capacity and power effi-ciency. We also derive a user satisfaction metric that accounts for the history of users within the cell. Integrating such a metric is lightweight yet very effective to drive towards almost complete fairness for the system over time. Our optimisation scheme is formulated as a Binary Non-Linear Program which results in very high performance in terms of throughput gain in
comparison to other benchmarks for the D2D mode selection
problem. Finally, we propose two effective heuristics whose performance and complexity we compare with optimal results and that largely outperform state of the art solutions.
I. INTRODUCTION
The appealing concept ofD2D Communications has been proposed in order to improve network performance in sight of the ambitious service optimisation goals of 5G networks. D2D allows to widen the coverage of cellular networks at lower energy costs through direct links between devices in close range without traversing a base station (BS) or the core of the network [1]. Both 3GPP and IEEE have integrated D2D through LTE-A and WiFi Direct [2], respectively. In this paper, we propose a memory-enabled theoretical framework to tackle the mode selection problem for D2D-enabled cellular networks. We exploit LTE and WiFi to maximise throughput and energy efficiency while targeting flow fairness when Inband Underlay andOverlay, and Out-band D2D modes are enabled. As main contributions, we develop an optimisation scheme that adaptively selects in which mode each user equipment (UE) sets links to D2D pairs or to the BS in benefit of network utility. Unlike past works, we consider flow demands between UEs and with the BS, and impose their fulfilment throughmulti-pathand relaying. With our proposal, each UE may use both the LTE and the WiFi communication interfaces at once for either transmission or reception, thus obtaining higher rates with respect to using only D2D or cellular connectivity. Moreover, flows can be served over multiple paths within the network, through D2D paths. To reduce complexity and lessen the negative impact on energy consumption and latency due to multi-hop routing, we limit the scope of our approach to cellular links and two-hop D2D paths. Besides,
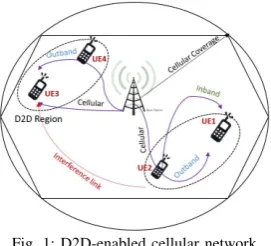
Fig. 1: D2D-enabled cellular network.
we derive asatisfaction metric which is aware of past users’ opportunities and rises chances of connections in close future to UEs that enjoyed less throughput. In Figure 1 we see how flows are split onto heterogeneous multiple paths to get to their destinations through relaying and/or direct links. We name our scheme Multi-Path D2D (MPD2D), which results in an NP-hard Binary Non-Linear Program and propose two effective heuristics to approximate the optimum. As a result we see that the heuristics for solving MPD2D dramatically increase the performance of cellular networks in comparison to several benchmarks and to state of the art solutions like, e.g., Floating Band D2D (FBD2D) [3].
The rest of the paper is structured as follows. Section II provides a state-of-the-art discussion on adaptive D2D net-works. Section III shows our proposal: MPD2D. Section IV presents the optimisation. Section V provides two practical heuristics, while in Section VI we evaluate and benchmark MPD2D and the heuristics. Section VII concludes the paper.
II. D2D NETWORKS ANDRELATEDWORK Coupling D2D technology into cellular networks is not restricted to any wireless technology [1]. A D2D link is a direct connection between two UEs without traversing a BS or the core of the network. There are main D2D modes proposed to set D2D links between UEs. A D2D mode specifies through which band devices connect (licensed or unlicensed) and how users access to the physical resources. Finding the way of setting the proper D2D mode is key in order to optimise a D2D-network under delay, throughput or energy constraints [4].
The main D2D modes developed for a D2D-enabled cellular network, jointly with cellular mode, are:
• Mode 0: Cellular mode. Cellular connection between a UE and the BS in either uplink or downlink. • Mode 1: Inband Underlay. D2D connection between
two UEs on the licensed band which reuse cellular resources. Spectrum is shared with cellular devices. • Mode 2: Inband Overlay. D2D connection between
two UEs on the licensed spectrum over a resource portion dedicated only to this D2D mode.
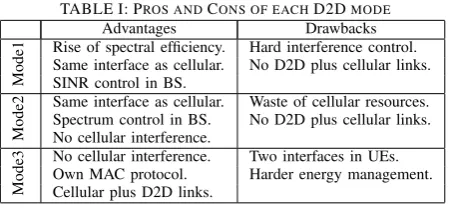
TABLE I: PROS ANDCONS OF EACHD2DMODE Advantages Drawbacks
Mode1
Rise of spectral efficiency. Hard interference control. Same interface as cellular. No D2D plus cellular links. SINR control in BS.
Mode2
Same interface as cellular. Waste of cellular resources. Spectrum control in BS. No D2D plus cellular links. No cellular interference.
Mode3
No cellular interference. Two interfaces in UEs. Own MAC protocol. Harder energy management. Cellular plus D2D links.
• Mode 3:Outband.D2D connection between two UEs in unlicensed spectrum. Medium access control and interference is not under the control of the BS.
These modes have been widely studied in literature for purposes as spectral and power efficiency, QoS [5], coverage [6], network offloading [7], etc. Since properties and medium access opportunities are clearly distinct, which D2D mode fits better in a cellular network is under discussion [4]. Table I shows the main pros and cons of each mode using D2D.
Authors of [3] proposeFloating Band D2D (FBD2D), an innovative framework in which the BS adaptively selects which D2D mode each UE must use for global benefit in a cell. Depending on the scenarios or UEs density, D2D modes are allocated to links. For instance, co-channel interference of a microcell spoilsunderlay D2D links, while WiFi performs better due to collision avoidance strategies in the channel. A scenario with heterogeneous communication technologies emerges, facing the well-known D2D mode selection problem (MSP). However, assumptions of FBD2D limit the cell capabilities: FBD2D enforces UEs to use only one wireless interface at a time. Also, the main purpose of FBD2D is to activate links that wish to connect two nodes without restriction on cell flows, then some communications will be likely disrupted. Lastly, FBD2D operates in slotted time, thus every T seconds the scheme optimises network performance for the next time interval. However, in a static scenario the allocation remains constant, so there are links much less utilized that suffer unfair treatment from the BS. ElSawy et al. [8] address the MSP for Inband Underlay in large cellular networks, scheduled in uplink channels. Conversely, X. Lin et al. [9] consider Inband Overlay as the only D2D mode to study the impact of the D2D range threshold. Jung et al. [10] propose a single cell scenario with Inband Underlay mode in uplink and address the MSP to maximise the power efficiency embedding system capacity. Liuet al. [11] study the D2D relaying feature with selection overUnderlayandOverlay modes. Similarly, Wen
et al. [12] develop a scheme for mode selection over both Inband D2D modes in benefit of aggregated throughput and QoS, but with no energy consumption constraints. Finally, Della et al. [13] propose a convex optimisation program to solve mode allocation in TDD systems with one D2D pair transmitting under licensed spectrum.
All these works do not address the D2D mode selection problem as comprehensively as we do. In fact, we couple Outband mode through WiFi technology, exploit the capabil-ities of a network with multiple D2D modes enabled where UEs can use several interfaces at once, and account for flow demands accomplished through relaying over multiple D2D paths. Besides, we rise satisfaction of users thanks to our newly designedsatisfaction metric.
III. MPD2D
In this section we present Multi-Path D2D (MPD2D) as well as the system model and the assumptions we take on D2D-enabled cells. We also model network features and maximise a network utility function based on throughput, en-ergy consumption, and user satisfaction. Finally we present our mathematical optimisation problem.
A. System Model
We consider a hexagonal LTE-A D2D-enabled cell of radius RC > 0 with an evolved Node B (eNB) placed in
the middle where a set of users N are placed (Figure 1). Outband D2D exploits WiFi thecnology and the D2D range is RD2D >0. Let P : [0, RD2D]→[0,1] be a decreasing function, two users u1, u2∈ N in D2D range will be D2D neighbours with probability P(dist(u1, u2)). We defineNu
as the set of D2D neighbours of user u∈ N in the cell. In LTE, downlink and uplink operate separately with a fixed bandwidth. Inband D2D modes use the uplink band-width. For uplink cellular connections the eNB schedules one UE per subframe in a portion reserved for cellular and underlay connections. A D2D inband link uses all its dedicated bandwidth, so that we manage co-channel interference based on Signal-to-Interference-and-Noise Ratio (SINR). Hence, cellular users do not interfere with each other, but they do with underlay users. Moreover, D2D users in overlay mode do not interfere with cellular or underlay users, but they do among themselves. Additionally, outband links will not cause interference since they operate in a different band exploiting WiFi technology, so they will contend for the channel with well-known collision avoidance strategies from CSMA/CA protocol for IEEE 802.11.
We introduce the presence of cell flows. When a UE wants to communicate with a device outside the D2D range she will do it through the eNB according to the legacy system. If two D2D neighbours want to communicate, they set a cell flow to be served through a direct link and/or via the eNB. Set F contains the flows. In order to serve such flows, we allow a key feature expected to be performed on D2D communications: relaying. Then a given flow f ∈ F may have several paths to follow. We only allow two-hop paths for each flow, and when a path of length 2 takes place it must contain the eNB. This approach allows for easy network management at eNB. Otherwise, in a multi-hop path involving only D2D users, the eNB will hardly be aware of performance regarding interference and signaling in these connections. We then define for each possible flow
f = (s, d)∈ F the possible paths it can follow:
(i) If f = (eN B, d),d∈ N, the possible paths forf are: • A path{eN B, d}with downlink cellular mode. • Any path {eN B, r, d} for allr∈ Nd.
(ii) If f = (s, eN B),s∈ N, the possible paths forf are: • A path{s, eN B} with uplink cellular mode. • Any path {s, r, eN B}for allr∈ Ns.
(iii) If f = (s, d),s, d∈ N, the only two paths forf are: • A path{s, d} with D2D connection.
• A path {s, eN B, d} with uplink and downlink cellular connection where eNB acts as a relay. GivenT >0, we divide the time in intervals of length T
selectionand thenresource scheduling. In the mode selection phase the eNB selects which links will be used according to all the constraints based on the benefits for the overall performance. Resource scheduling is out of the scope of this paper and we assume the following:(i)cellular resources in mode 0are allocated proportionally to the number of flows carried by the link; (ii) D2D underlay and overlay re-use the full uplink bandwidth dedicated to each mode, in each active link. WiFi resources are not scheduled.
B. Analysis
In this subsection we model all the parameters, variables and metrics in order to analyse the best mode allocation for links in order to maximise the cell performance in terms of throughput, energy and satisfaction of users.
Binary decision variables. We assume that the eNB knows the set of cell flowsF(j)in each time intervalj∈N and builds a set L(j) of potentially active links. Denoting byP any of the paths described above, we define:
Pf(j) ={P |flowfcan follow pathP},
L(j) =∪f∈F(j)∪P∈Pf(j){(n, m)∈P},
soPf(j)is the set of paths thatf ∈ F(j)can follow. Over
set L(j) we define the decision variables: For all n, m ∈ N∗(j) | (n, m)∈ L(j),0≤i≤3,j∈
N, we define:
Yn,mi (j) =
(
1, if(n, m)is active in modeiduringj;
0, otherwise.
whereN∗(j) =N(j)∪ {eN B} is the set of nodes plus the base station. {Yn,mi (j)} is a set of binary variables.
We define extra variables to tell whether the state of the WiFi interface duringj∈Nis idle or the transceiver is used for energy purposes. For all user n∈ N(j):
Yn3(j) =
(
1, if the WiFi transceiver ofnis in use duringj;
0, otherwise.
Throughput modelling.For(n, m)∈ L(j), the amount of bits that nwould transmit tom in modeiduring j is:
θn,mi (j) = Bn,mi (j)Ri,CSIn,m (j), 0≤i≤2;
θn,m3 (j) = T·Rn,m3,CSIYn3(j−1)
+ (T−tactidle)R3n,m,CSI(j) 1−Yn3(j−1)
;
where Bn,mi (j) is the number of resource blocks allocated to link (n, m) and Ri,CSI
n,m (j) is the number of bits sent
per resource block, which depends on the Modulation and Coding Scheme (MCS) and SINR, when 0 ≤ i ≤ 2.
R3,CSI
n,m (j)is the WiFi rate in bps and depends on the number
of stations using WiFi. Our throughput model extends what derived in [3] for FBD2D. Unlike previous models, we introduce the timetactidleneeded to activate an idle WiFi card. Energy consumption modelling.LetM ∈ {T x, Rx}, the energy spent byn∈ N(j)when she connects tom∈ N∗(j) in mode iduringj to either transmit or receive data is:
Euι,MT x,uRx(j) = β 1−Yu3M(j)
+pι,MuMtBι
uT x,uRx(j);
Eu3,MT x,uRx(j) = βlte+β
W iF i active
+p3u,MM θ
3
n,m(j);
where ι ∈ {0,1,2}, β = βlte+βW iF iidle . βlte, βW iF iidle , and
βactiveW iF i are the baseline energy consumptions in one interval
by LTE, idle WiFi and active WiFi interfaces. For LTE,pι,MuM,
M ∈ {T x, Rx}is the energy consumed in one subframe for transmission and reception of data, andtBι
uT x,uRx(j)is the
number of used subframes. For WiFi, p3u,MM is the energy consumption for M ∈ {T x, Rx} per bit during j.
Interference. We build an arrayIi
x,m(j) that stores the
interference that x∈ N(j)causes tom∈ N∗(j)when she transmits in modeiduringjbased on well-known path-loss model for wireless transmissions.
System utility functions. For all n∈ N∗(j), the utility function Un(j) (in bits) plays a vital role in the definition
of our satisfaction metric. We make Un(j) account for throughput enjoyed and energy consumed during j:
Un(j) =
3 X
i=0
X
m|(n,m)∈L(j)
θin,m(j)−αE i,T x
n,m(j)
Yn,mi (j) +
+
3 X
i=0
X
m|(m,n)∈L(j)
θm,ni (j)−αE i,Rx
m,n(j)
Ym,ni (j),
where α > 0 is the relative cost of energy. The global network utility function of the system is:
Unet(j) = X
n∈N∗(j)
Un(j).
Unet(j)accounts for the aggregated throughput and energy consumption of all nodes. Our aim is to decide link activa-tions in order to maximise Unet(j). Then, Unet(j)will be the main part of the objective function.
System satisfaction. We introduce satisfaction indicators to measure how UEs exploit the network over time in order to bias link allocation decisions by following the principles of proportional fair schedulers, in which links acquire pri-ority when they are in good transmission conditions and if they have been underutilised.
For every j ∈ N, and n ∈ N∗(j), we compute an
individual indicator of satisfaction (IIS), namely fn(j), which tells how good the experience of node nwas during
j. Thus, a natural definition for IIS is fn(j) :=Un(j). Depending on the history of a user, we derive an accu-mulated individual indicator of satisfaction (AIIS), namely
Fn(j). This valueFn(j)indicates how good the experience
ofnhas been in the previousj−1time intervals. Then, we filter {fn(k)}
j−1
k=1 to obtainFn(j)with a weighted average:
Fn(j) = j−1
X
k=1
wk(j)fn(k), where j−1
X
k=1
wk(j) = 1.
Weights increase withkin an exponential-shaped form, thus concerning more about the satisfaction enjoyed in recent past. This results in a one-step-memory filtering process, which avoids having to store each UE’s full history. Let
µ >1 be a real number. Using the geometric sum result we define:
wk(j) :=
µ−1
1− 1
µ j−1 ·
1
µj−k, ∀ 1≤k < j,
so the sum of weights {wk(j)}kj−=11 for a fixed j is1. Let ξ(j) := µµj−1j−−11 for all j ≥ 1. Then, the following recurrence holds and enables one-step memory operation:
Fn(j+ 1) =ξ(j)Fn(j) + 1−ξ(j)
fn(j) ∀j≥1. (1)
coefficients for each IIS that get adapted to the length of the history in the system. Thanks to the use of dynamic weights, DEMA reacts very quickly to changes in node satisfaction.
IV. OPTIMISATION
We maximise the network utilityUnet(j)including AIIS valuesFn(j)to prioritise UEs according to their utility and satisfaction history. The lower Fn(j) is for a UE n, the higher we make its contribution to overall performance:
z(j) = X
n∈N∗(j)
Un(j)/Fn(j).
MPD2D is restricted to some conditions that result in three kinds of constraints for the optimisation problem:
Technology constraints. In LTE, a UE can set a directed link with only one other node with only one of the LTE modes. Also, she can set only one link inoutband mode.
Interference constraints.We impose SINR achievement of thresholds in order to manage co-channel interference. Let
n, m∈ N∗(j),0≤i≤2 andTi
m>0. We want the SINR
in link(n, m)in modeito be aboveTi
m in order to ensure
good QoS, according to the implication it has in the lowest MCS guaranteed to users [14].
Flow constraints.We impose the service of flows defined in Section III-A through relaying data over multiple paths.
The resulting MPD2D Optimisation Problem is shown in what follows. For ease of readability we denote e=eN B
and omit j-dependence:
max z= X
n∈N∗
Un Fn; P2
i=0
P
m|(n,m)∈LYn,mi ≤1, ∀n∈ N;
P
m|(n,m)∈LYn,m3 ≤1, ∀n∈ N;
P2
i=0
P
n|(n,m)∈LYn,mi ≤1, ∀m∈ N;
P
n|(n,m)∈LYn,m3 ≤1, ∀m∈ N;
P
(t,r)∈LYn,e0 Yt,r1 It,e1 ≤γn,e0 , ∀n∈ N | (n, e)∈ L; P1
i=0
P
(x,y)∈L\{(n,m)}Yn,m1 Yx,yi Ix,mi ≤γn,m1 ,∀(n, m)∈ L; P
(x,y)∈L\{(n,m)}Yn,m2 Yx,y2 Ix,m2 ≤γn,m2 , ∀(n, m)∈ L; Yn3= min 1,
P
m|(n,m)∈LYn,m3 +
P
m|(m,n)∈LYm,n3
,∀n∈ N;
P3
i=1Ys,di +Ys,e0 Ye,d0 ≥1, ∀(s, d)∈ F | s, d∈ N Y0
e,d+
P
r|(r,d)∈L
Y0
e,r P3
i=1Yr,di
≥1, ∀d∈ N | (e, d)∈ F;
Y0
s,e+
P
r|(s,r)∈L
Y0
r,e P3
i=1Ys,ri
≥1, ∀s∈ N | (s, e)∈ F.
Four constraints model technology constraints. The first two are for transmitters and the next two for receivers. We manage interference from cellular users in uplink with underlay D2D users in the eNB, then interference between cellular and underlay D2D users in each of the D2D UEs, and the overlay D2D users. The last three constraints force all flows to be served over at least one path.
The optimisation problem is binary and non-linear in the objective function and in the constraints. It can be linearized with additional binary variables and linear constraints that increase the complexity (not shown here for lack of space). Therefore, we can apply standard approaches as Branch & Bound [15] in order to solve the resulting MILP.
To reduce complexity, we propose two effective heuristics in order to approximate the optimum provided by MPD2D.
V. HEURISTICS: DIMMANDDEMM
Solving the MPD2D is computationally hard. Hence we proposeDIMM andDEMM, two heuristics which perform a sequential search of multiple D2D paths through multi-mode selection. As described in Algorithm 1,D2D Intensive Mul-timode Multi-path (DIMM) executes a full search of multi-paths checking SINR violation at each decision. Instead, as described in Algorithm 2, D2D Expeditious Multimode Multi-path (DEMM) makes preliminary decisions based on link allocations that potentially violate SINR thresholds, so SINR constraints are no longer checked. Thus, DIMM performs more accurate mode selection whileDEMM is less complex, which is desirable for scalable decision making.
Algorithm 1DIMM: D2D Instensive Multimode Multi-path
Input:N,L,F: Sets of users, links and flows. {Ii
n,m},{γn,mi }: interference parameters.
Output: Y={Yi
n,m}: Set of decision variables.
Initialize: Y0
s,e=Ye,d0 = 1 ∀(s, e),(e, d)∈ F
for(s, d)∈ F | s, d∈ N do
Y0
s,e=Ye,d0 = 1
ifYs,u3 =Yu,d3 = 0 ∀u∈ N then Y3
s,d= 1
Y?=Y;max=z=Unet(Y).
while Yold6=Y do Yold=Y
for(n, m)∈ LD2D do
fori∈ {1,2}do
Yi,?
n,m= 1; Yn,mk,? = 0∀ k∈ {1,2} − {i} Yk,?
n,u =Yu,mk,? = 0∀ u6=n, m;∀0≤k≤2
z=Unet(Y?)
ifz > max& SINR and Flows satisfiedthen Y=Y?;max=z
else Y?=Y fori=3do
Y3,?
n,m= 1;Yn,u3,?=Yu,m3,? = 0∀ u6=n, m z=Unet(Y?)
ifz > max & Flows satisfiedthen Y=Y?;max=z
else Y?=Y
Algorithm 2 DEMM:D2D Expeditious Multimode Multi-path
Input:N,L,F: Sets of users, links and flows. {Ii
n,m},{γn,mi }: interference parameters.ρ∈]0,1[.
Output: Y={Yi
n,m}: Set of decision variables.
for(n, t)∈ N ×N | I1
t,e> ρ·γn,e0 do θ1t,r= 0,∀ r∈ N
for(n, m)∈ LD2D do
forx∈ N − {n} | I0
x,m> ρ·γn,m1 do θ1n,m= 0
ifθn,m1 >0 then
forx∈ N − {n} | I1
x,m> ρ·γn,m1 do θ1
x,r= 0,∀r∈ N
for(n, m)∈ LD2D do
forx∈ N − {n} | I2
x,m> ρ·γn,m2 do θ2
x,r= 0,∀r∈ N
Both heuristics first allocate all cellular links to UEs to serve all flows and then add all possible WiFi links among D2D UEs to give flexibility when trying to move and split flows. Then we iterate over the set of D2D links LD2D, which do not involve the eNB, and try to allocate
sequentially each of the D2D modes, provided that flows are served. Besides, DIMM checks the SINR thresholds while DEMM a-priori bans all allocations that likely spoil any SINR constraint. When a link allocation increases utility, we activate the link and deactivate other incompatible links. Complexity Analysis. We iterate over all links inLD2D
and compute up to one utility per D2D mode and per link:
3|LD2D| utilities. The cost of each utility is linear with
|N |, since technology constraints do not allow having more that 5|N | active links.1 DIMM has to check SINR con-straints, whose amount is linear with|L|. Then, complexity of DIMM is O(5·3|LD2D||L||N |), while for DEMM is
O(5·3|LD2D||N |). Since sizes of the link sets are at most
quadratic with|N |, the complexity ofDIMM goes with the fifth power of|N |while DEMM has a cubic dependence.
VI. NUMERICALEVALUATION
We show results for MPD2D and heuristics through numerical simulations in comparison to benchmarks and FBD2D. We place users uniformly in a hexagonal cell and mainly study performance of throughput, energy consump-tion, fairness and evolution of satisfaction over time. Error bars in the graphs are95%confidence intervals. We allocate cellular resources to LTE links proportionally to the number of flows they carry. Amount of D2D users is no limited. Unless otherwise specified, every user has a flow coming from the eNB, and half of them have a flow towards the eNB. A pair of devices become a D2D pair with a probability that decreases linearly with longer distances until distance is larger than RD2D. All D2D pairs may have a flow from
one to the other. Any flow can follow multiple paths. Benchmark schemes for MPD2D are Only-WiFi,
Only-Underlay and Only-Overlay, where the only D2D mode enabled is WiFi D2D,underlay andoverlay, re-spectively, andForced Cellular. We adaptDIMM and DEMM to work with these three benchmarks. In Forced Cellularall traffic goes through cellular connections.
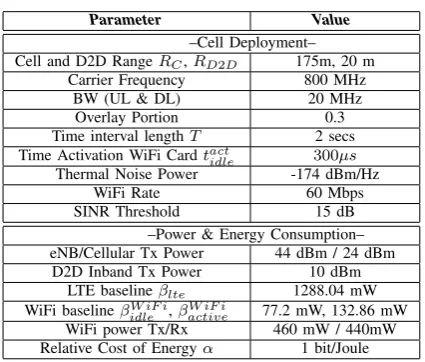
Table II gathers the parameters of the model. 30% of resources are for overlay mode, but cellular and underlay modes use this portion whenoverlaymode is unused. Carrier frequency for LTE is the 800 MHz band, since it is the one used to deploy 4G+ in European countries. Bandwidth for downlink and uplink is 20 MHz each. The threshold for SINR is 15 dB, so that nodes may use at least MCS with 16QAM modulation and coding rate of 3/4 [14]. α
is an estimation of the relative price of bit per Joule in the market. We consider traffic queues under infinite offered load conditions in which users have always data ready to transmit, so we study the achievable performance of the system.
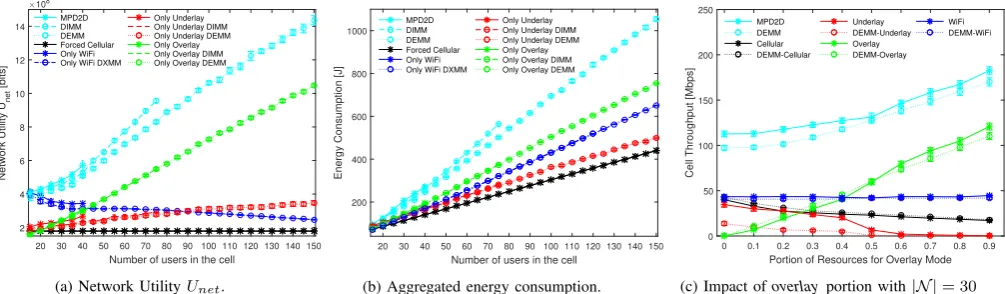
Optimality, Energy Consumption and Overlay Portion. Figure 2 shows a snapshot of the performance of the network utility and UEs’ energy consumption, and the impact on throughput of the overlay portion for |N | = 30. We show
1Each node can have one downlink connection from the eNB, two
WiFi links, and one or two links using the uplink licensed band: either a connection to the eNB or a pair of incoming/outgoing D2D inband links.
TABLE II: EVALUATIONPARAMETERS
Parameter Value
–Cell Deployment– Cell and D2D RangeRC,RD2D 175m, 20 m
Carrier Frequency 800 MHz BW (UL & DL) 20 MHz Overlay Portion 0.3 Time interval lengthT 2 secs Time Activation WiFi Cardtact
idle 300µs
Thermal Noise Power -174 dBm/Hz
WiFi Rate 60 Mbps
SINR Threshold 15 dB –Power & Energy Consumption– eNB/Cellular Tx Power 44 dBm / 24 dBm
D2D Inband Tx Power 10 dBm LTE baselineβlte 1288.04 mW WiFi baselineβW iF i
idle ,βactiveW iF i 77.2 mW, 132.86 mW
WiFi power Tx/Rx 460 mW / 440mW Relative Cost of Energyα 1 bit/Joule
optimum values from 15 to 40 UEs. Both DIMM and DEMM provide close approximations for MPD2D and for benchmarks, while allowing to evaluate performance up to 150 UEs in the figures reported in this paper. DIMM per-forms closer to optimum values, but it has higher complexity, so we focus on DEMM since it offers good results at quite lower cost. MPD2D clearly outperforms any other case with one single D2D connectivity path enabled. The gain of network utility compared with Forced Cellular with |N | = 40 users is of 218%, while for |N | = 150 with DEMM rises up to 701%. Furthermore,DEMM gives a gain of 37% in comparison toOnly-Overlay, which offers the best results among the benchmark schemes. As long as we add users, DEMM results approximating the optimal solution and enjoys much more gain than any other benchmark.
In Figure 2b we can see the gain in energy consumption. The shape of the throughput graph is similar to network util-ity since throughput is the main part of the utilutil-ity function, so we do not show the graph. However, here we comment on how throughput gain and energy gain compare. Throughput gain grows up to 66% with|N |= 40in comparison with the closest benchmark, Only-WiFi. With|N |= 150DEMM provides a gain of 36% in respect to Only-Overlay. In comparison withForced Cellular, throughput gain raises from 135% up to 702%. Besides, regarding energy consumptionDEMM achieves up to a considerable 203% of gain to Forced Cellular. DEMM is the scheme with higher energy cost due to having two interfaces enabled, since the main usage of energy is due to baseline consump-tion, although it saves energy compared to the exact solution of MPD2D. Nevertheless the great gain of throughput is much higher than the extra energy cost incurred. Then, although energy consumption is significatively increased, the time required for transmitting an entire message or file is much lower.
Number of users in the cell
20 30 40 50 60 70 80 90 100 110 120 130 140 150
Network Utility U
net
[bits]
×108
2 4 6 8 10 12 14
MPD2D DIMM DEMM Forced Cellular Only WiFi Only WiFi DXMM
Only Underlay Only Underlay DIMM Only Underlay DEMM Only Overlay Only Overlay DIMM Only Overlay DEMM
(a) Network UtilityUnet.
Number of users in the cell
20 30 40 50 60 70 80 90 100 110 120 130 140 150
Energy Consumption [J]
200 400 600 800 1000
MPD2D DIMM DEMM Forced Cellular Only WiFi Only WiFi DXMM
Only Underlay Only Underlay DIMM Only Underlay DEMM Only Overlay Only Overlay DIMM Only Overlay DEMM
(b) Aggregated energy consumption.
Portion of Resources for Overlay Mode
0 0.1 0.2 0.3 0.4 0.5 0.6 0.7 0.8 0.9
Cell Throughput [Mbps]
0 50 100 150 200 250
MPD2D DEMM Cellular DEMM-Cellular
Underlay DEMM-Underlay Overlay DEMM-Overlay
WiFi DEMM-WiFi
(c) Impact ofoverlayportion with|N |= 30
Fig. 2: Impact of UEs density on network utility and energy consumption, and impact ofoverlayportion.
widening overlay bandwidth implies reducing the band for cellular connections in uplink, so cellular throughput decreases. Cellular throughput accounts for downlink and uplink, so whenoverlayportion is 90%, cellular mode usage is mainly due to downlink connections. Since the QoS for uplink connections cannot be much reduced, a reasonable portion foroverlay mode is between 30% and 40%.
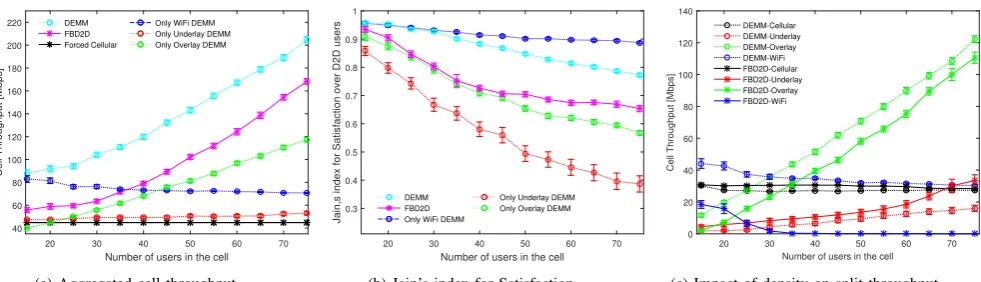
Comparison with Floating Band D2D.Since FBD2D [3] restricts each user to activate only one link for transmission and only one link for reception of data, we deploy a different scenario in which UEs set half of all the cellular flows in uplink and also in downlink. Otherwise it is be very likely that most of the UEs activate a cellular link and miss lots of D2D chances, so that MPD2D and FBD2D are comparable. Figure 3 shows the impact of cell density jointly with our benchmarks. Clearly, DEMM outperforms FBD2D due to the main difference between both schemes: the permission to use two interfaces for D2D. Since Only-WiFi also allows two interfaces at once, FBD2D performs worse than
Only-WiFi until we get to dense cells and WiFi perfor-mance decays, but FBD2D still outperforms LTE schemes. This proves the importance in MPD2D for allowing both active interfaces so as to drive flows over multiple paths.
In order to study the satisfaction in the cell, we compute the Jain’s index over satisfaction values. Let M ⊆ N∗ a subset of the nodes, the satisfaction rate over this set is:
JM=
X
m∈M
Fm !2
|M| · X
m∈M
Fm2 !
,
where Fm are the AIIS values from Section III-B. As
depicted in Figure 3b,DEMM satisfaction remains between 77% and 96% for D2D users while FBD2D decays from 96% to 65% as cell density increases. For cellular users we do not show the results because they are very similar. The integration of our satisfaction metric increases satisfaction over time to all users to much higher indices, as shown later. Figure 3c compares the throughput allocation in DEMM and FBD2D. It reflects the pros and cons of each mode shown in Table I and why the system model of MPD2D is more flexible to achieve higher data rates. Inband usage rises up until SINR limits underlay links, while overlay mode is less affected by SINR. In FBD2D WiFi degrades very quickly in benefit of Inband modes, since FBD2D can choose only one technology, so overlay links are more
convenient due to easier SINR management. We conclude that our scheme does not need to refuse any D2D mode since MPD2D can couple and use them at the same time, which results in a much higher achievable throughput.
Fairness and Satisfaction. Figure 4 depicts the effects of integrating the satisfaction metric onto the decisions over time in the cell. In Figures 4a we plot the Jain’s index for D2D users in a static scenario. Conversely, in Figure 4b we set all users in a mobile scenario. Note that mobile users can be D2D or cellular users in different time intervals. We assume a fixed walking speed of4km/h for users moving in random directions, for 40consecutive time intervals.
Figures 4a and 4b show an extremely great behaviour of satisfaction over time with MPD2D and DEMM. Static D2D users increase by 18% their indices when |N | = 35, up to 92%, while the dynamic users rise it from 41% up to 54%. In this case Jain’s index cannot be as high as in the static case since connection opportunities are different for D2D and cellular users over time. The lesson learnt from this experiment is twofold: (i) multi-path is key to boost fair satisfaction of static D2D nodes to the limit, whilst (ii) mobile nodes experience a dramatic increase of satisfaction. Interestingly, our heuristic DEMM is fairer than the optimal solution of MPD2D, due to the fact that DEMM uses more WiFi and less underlay links, as shown in Figure 4c, the latter being the well-known cause of unfair behaviours among users.
Finally, in Figure 4c we analyse the cell throughput enjoyed over time in a dynamic cell. We show also how throughput is split into connection modes to see how the satisfaction metric affects to allocation over time. Despite the objective function does not account for actual throughput and energy consumption, but it does for nodes’ utility including the satisfaction metric, throughput does not decrease to low values as time passes by. Instead, we observe very positive results in which throughput remains stable in a reasonable variation of 15Mbps during 80seconds.
VII. CONCLUSIONS
Number of users in the cell
20 30 40 50 60 70
Cell Throughput [Mbps]
40 60 80 100 120 140 160 180 200 220 DEMM
FBD2D Forced Cellular
Only WiFi DEMM Only Underlay DEMM Only Overlay DEMM
(a) Aggregated cell throughput
Number of users in the cell
20 30 40 50 60 70
Jain,s index for Satisfaction over D2D users
0.3 0.4 0.5 0.6 0.7 0.8 0.9 1
DEMM FBD2D Only WiFi DEMM
Only Underlay DEMM Only Overlay DEMM
(b) Jain’s index for Satisfaction
Number of users in the cell
20 30 40 50 60 70
Cell Throughput [Mbps]
0 20 40 60 80 100 120 140
DEMM-Cellular DEMM-Underlay DEMM-Overlay DEMM-WiFi FBD2D-Cellular FBD2D-Underlay FBD2D-Overlay FBD2D-WiFi
(c) Impact of density on split throughput.
Fig. 3: Comparison of FBD2D andDEMM.
Time Intervals j
0 5 10 15 20 25 30 35 40
Jain,s index for Satisfaction over D2D users
0.7 0.75 0.8 0.85 0.9 0.95 1
N = 30 MPD2D N = 30 DEMM N = 35 MPD2D N = 35 DEMM
(a) Jain’s index of static D2D users.
Time Intervals j
0 5 10 15 20 25 30 35 40
Jain,s index for Satisfaction over all users
0.4 0.42 0.44 0.46 0.48 0.5 0.52 0.54 0.56
N = 30 MPD2D N = 30 DEMM N = 35 MPD2D N = 35 DEMM
(b) Jain’s index of dynamic users.
Time Intervals j
0 5 10 15 20 25 30 35 40
Cell Throughput [Mbps]
0 20 40 60 80 100 120
MPD2D DEMM Cellular DEMM-Cellular
Underlay DEMM-Underlay Overlay DEMM-Overlay
WiFi DEMM-WiFi
(c) Throughput of dynamic cell,|N |= 30. Fig. 4: Impact of time on users satisfaction and cell throughput.
is the first key contribution of this work. Although it comes with several technology restrictions, yet it shows significant potential gain that it is worth exploring. As a second key contribution, we have derived a system analysis framework and in particular we have introduced a node satisfaction metric that provides memory to the system to make fairer link allocation decisions. Using a newly defined filtering technique, namely DEMA, we have reduced to the minimum the implementation costs of fast reactive memory-enabled mode selection decisions in dynamic contexts. To further reduce complexity, we have proposed DIMM andDEMM, two effective heuristics that achieve close-to-optimum results and carry out mode selection in a way that dramatically outperforms state of the art solutions.
ACKNOWLEDGEMENTS
This article is partially supported by FPU15/02051 grant from the Spanish Ministry of Education, Culture and Sports (MECD) and the Ram´on y Cajal grant from the Span-ish Ministry of Economy and Competitiveness RYC-2012-10788. This work was also supported by the European Commission in the framework of the H2020-ICT-2014-2 project Flex5Gware (Grant agreement no. 671563).
REFERENCES
[1] X. Lin, J. G. Andrews, A. Ghosh, and R. Ratasuk, “An overview of 3GPP device-to-device proximity services,”IEEE Communications Magazine, vol. 52, no. 4, pp. 40–48, 2014.
[2] WiFi Direct Alliance, http://www.wi-fi.org/discover-wi-fi/wi-fi-direct. [3] A. Asadi, V. Mancuso, and P. Jacko, “Floating band D2D: exploring and exploiting the potentials of adaptive D2D-enabled networks,” in
IEEE WoWMoM, 2015, pp. 1–9.
[4] A. Asadi, Q. Wang, and V. Mancuso, “A survey on device-to-device communication in cellular networks,”IEEE Communications Surveys & Tutorials, vol. 16, no. 4, pp. 1801–1819, 2014.
[5] D. Feng, L. Lu, Y. Yuan-Wu, G. Y. Li, G. Feng, and S. Li, “Device-to-device communications underlaying cellular networks,”IEEE Trans-actions on Communications, vol. 61, no. 8, pp. 3541–3551, 2013. [6] A. Abrardo, G. Fodor, and B. Tola, “Network coding schemes for
D2D communications based relaying for cellular coverage extension,”
Transactions on Emerging Telecommunications Technologies, 2015. [7] Y. Zhang, E. Pan, L. Song, W. Saad, Z. Dawy, and Z. Han, “Social
network aware device-to-device communication in wireless networks,”
IEEE Transactions on Wireless Communications, vol. 14, no. 1, pp. 177–190, 2015.
[8] H. ElSawy, E. Hossain, and M.-S. Alouini, “Analytical modeling of mode selection and power control for underlay D2D communication in cellular networks,”IEEE Transactions on Communications, vol. 62, no. 11, pp. 4147–4161, 2014.
[9] X. Lin and J. G. Andrews, “Optimal spectrum partition and mode selection in device-to-device overlaid cellular networks,” in IEEE GLOBECOM, 2013, pp. 1837–1842.
[10] M. Jung, K. Hwang, and S. Choi, “Joint mode selection and power allocation scheme for power-efficient device-to-device (D2D) commu-nication,” inIEEE VTC Spring, 2012, pp. 1–5.
[11] Z. Liu, T. Peng, S. Xiang, and W. Wang, “Mode selection for device-to-device (D2D) communication under LTE-advanced networks,” in
IEEE ICC, 2012, pp. 5563–5567.
[12] S. Wen, X. Zhu, X. Zhang, and D. Yang, “QoS-aware mode selection and resource allocation scheme for device-to-device (D2D) commu-nication in cellular networks,” inIEEE ICC, 2013, pp. 101–105. [13] D. Della Penda, L. Fu, and M. Johansson, “Mode selection for energy
efficient D2D communications in dynamic TDD systems,” inIEEE ICC, 2015, pp. 5404–5409.
[14] A. Asadi, “Opportunistic cellular communications with clusters of dual-radio mobiles,” Ph.D. dissertation, Universidad Carlos III de Madrid, Spain, 2012.