A Data-driven Method for the Detection of Close
Submitters in Online Learning Environments
José A. Ruipérez-Valiente
Sre´cko Joksimovi´c
Vitomir Kovanovi´c
Universidad Carlos III de Madrid
The University of Edinburgh
The University of Edinburgh
and Institute IMDEA Networks
Edinburgh, UK
Edinburgh, UK
Leganés, Spain
[email protected]
Dragan Gaševi´c
Pedro J. Muñoz-Merino
Carlos Delgado Kloos
The University of Edinburgh
Universidad Carlos III de Madrid
Universidad Carlos III de Madrid
Edinburgh, UK
Leganés, Spain
Leganés, Spain
ABSTRACT
Online learning has become very popular over the last decade. How-ever, there are still many details that remain unknown about the strategies that students follow while studying online. In this study, we focus on the direction of detecting ‘invisible’ collaboration ties between students in online learning environments. Specifically, the paper presents a method developed to detect student ties based on temporal proximity of their assignment submissions. The paper re-ports on findings of a study that made use of the proposed method to investigate the presence of close submitters in two different mas-sive open online courses. The results show that most of the stu-dents (i.e., student user accounts) were grouped as couples, though some bigger communities were also detected. The study also com-pared the population detected by the algorithm with the rest of user accounts and found that close submitters needed a statistically sig-nificant lower amount of activity with the platform to achieve a certificate of completion in a MOOC. These results confirm that the detected close submitters were performing some collaboration or even engaged in unethical behaviors, which facilitates their way into a certificate. However, more work is required in the future to specify various strategies adopted by close submitters and possible associations between the user accounts.
Keywords
Educational data mining; online learning; algorithm; collaborative learning; academic dishonesty
1.
INTRODUCTION
Driven by the recent technological advances, a socio-material paradigm shift in online educational settings provided learners with a greater opportunity to take control of their learning [11, 16]. In-stead of focusing on delivering knowledge, learning in online
set-c
2017 International World Wide Web Conference Committee (IW3C2), published under Creative Commons CC BY 4.0 License.
WWW’17 Companion,April 3–7, 2017, Perth, Australia. ACM 978-1-4503-4914-7/17/04.
http://dx.doi.org/10.1145/3041021.3054161
.
tings has been conceptualized around meeting students’ needs and allowing for greater flexibility in achieving educational goals [17, 16]. Thus, learning in today’s complex and digitally connected edu-cational settings assumes that students are able to learn at their own pace, to choose whom they want to learn with, and which informa-tion are relevant for attaining their personal objectives [7, 11]. Nev-ertheless, the emergence of massive open online courses (MOOCs), as a format of delivering online education at scale, brought an abun-dance of possibilities and made even more difficult for students to engage within learning communities [12, 10].
Research in traditional face-to-face and online learning, on the other hand, recognizes the importance of learning inside (small) groups [25, 9]. Besides being more successful completing course assignments, work in groups allows students to develop and im-prove their collaborative and communication skills, which are some of the core 21st-century learning skills. Likewise, MOOC research also confirmed student tendency to study in groups [18], whereas registering for a course with friends seems to be positively associ-ated with the course completion and achievement [6]. However, the question remains to what extent we can identify emerging groups in MOOCs and perhaps provide an opportunity for those potentially isolated groups to become part of a larger learning community.
In this study, we approach this issue from a more general per-spective where we can detect more diverse types of behaviors. In particular, we aim to detect user accounts of students1in online courses that always submit their assignments very close in time. By observing activities of identified groups, we aim at further un-derstanding students’ intention to work in groups – e.g., watching videos and submitting assignments around the same time [18] or perhaps even focusing on more unethical collaborations between students e.g. CAMEO as reported in MOOCs [19, 24, 2]. We want to address this issue by providing a systematic method and algo-rithm that could be easily applied to any online environment where students have to perform certain learning activities. This approach can potentially detect interesting associations such as unethical or genuine collaborations between students, but can also detect some students who engage in CAMEO behavior. More specifically, the objectives that we have for this study are as follow:
1
1. Design and implementation of a data-driven algorithm to de-tect accounts which submit their questions very close in time. We also discuss the effect of different configuration criteria for the algorithm.
2. Apply the algorithm to MOOC data, and tag the accounts detected as submitting their solutions close in time as “close submitters” while the rest will be referred to as “regular ac-counts”. Report the results in the following directions:
(a) The number of close submitter accounts detected, the size and the shape of communities of accounts and dis-tribution of distances between submissions.
(b) The comparison between groups (close submitters vs. regular accounts) regarding different student features such as the grade, the average number of submissions, and the number of videos. The comparison intends to show that we can indeed detect two distinct populations from a statistical point of view.
3. Discussion of the results observed, potential application to online learning, and future work directions.
2.
RELATED WORK
Contemporary research on MOOCs agrees to a great extent that learners at scale represent rather loosely coupled groups than long-lasting communities of learners [12, 20]. This conclusion comes as no surprise, given that MOOCs usually bring together learners from all around the world, with different backgrounds, intents, and motivations to engage with a course [10, 23, 22, 14]. However, one of the reasons that interactions between students never evolve into communities in learning at scale might be simply related to the length of a course. Usually delivered in a short period of time (e.g. between four and eight weeks [1]), MOOCs perhaps do not allow for more intensive collaboration to occur in the first place (or at least do not allow as part of course design) [20]. Nevertheless, the importance of studying emerging groups of learners in studying at scale has been well-evidenced [12, 20].
A vast majority of studies that examined emerging groups or communities in MOOCs have been primarily focused on survey data and discussion forums. For example, analyzing student inter-actions in a business strategy MOOC, Gillani and Eynon [12] ex-amined types of students who tend to interact with one another. Pri-marily relying on the methods of social networks analysis, Gillani and Eynon’s [12] study revealed that emerging groups of learn-ers are increasingly fragmented (i.e. tend to dissolve as a course progresses), meaning that those groups “formed around particu-lar discussion topics were generally short-lived” (ibid., p.23). On the other hand, Gillani and colleagues [13] used the Bayesian non-negative matrix factorization to extract communities (or groups) of learners, based on the nature of their contribution to a MOOC cussion forum. Specifically, Gillani and colleagues [13] coded dis-cussion forum messages according to knowledge construction lev-els [15], communicative intents [8], and affective dimensions [21]. The study revealed four community types – i.e., committed crowd engagers, discussion initiators, strategists, and individualist – that differed with respect to demographic and course performance indi-cators. Nevertheless, both studies revealed groups emerging from group interactions.
From the perspective of the work presented in this paper, per-haps other more relevant studies were conducted by Brooks et al. and Li and colleagues. The study from Brooks and colleagues [6] showed that enrolling in a MOOC with friends and colleagues cor-related positively with the completion rate and academic success.
Although those students who enrolled with their friends or col-leagues tended to participate in online discussion forums, they also interacted with each other outside the virtual environment [6]. One of the themes of interactions included collaborative video watch-ing, which was the main focus of Li et al. [18] study. Specifi-cally, Li and colleagues [18] combined survey and trace data to ex-plore study behavior in collaborative video watching of 12 learner groups, across three experimental conditions. In contrast to Brooks and colleagues’ study [6] where students enrolled together with their friends, in the study by Li and colleagues [18] 54 learners were randomly assigned into different groups. Nevertheless, Li and colleagues [18] showed that watching MOOC videos together pro-vided a highly satisfying learning experience. Both studies, how-ever, focused on benefits of working in groups and explored pos-itive aspects of student collaboration. However, as shown in our previous work [24, 2], not everycollaborationseem to be ethi-cal. CAMEO [24, 19, 2] is a specific cheating method studied in MOOCs (and also applies to any learning environment that allows for open registration of user accounts), in which students use mul-tiple accounts to harvest correct solutions and then insert the so-lutions in their main account to earn enough credit and receive a certificate of accomplishment. CAMEO is also closely related to a behavior known asgaming the system, as in both instances students are exploiting the properties of the learning environment (e.g., cre-ating several accounts to obtain the feedback), instead of learning the course content [3].
This study aims at contributing to this line of research by pro-viding automated methods for detecting students who tend to work together. The study did not start with the intention to target any specific behavior but it rather aimed at providing a general ap-proach that will detect different types of associations between user accounts that can further be investigated later on. In doing so, we rely on both trace, discussion, and assessment data obtained from the Coursera MOOC. Our primary goal is to provide an algorithm that would allow for identifying various types of collaboration in online learning settings in general, and MOOCs in particular.
3.
METHODOLOGY
3.1
Study data
The data used in the study were collected from two MOOCs of-fered by the University of Edinburgh: Introduction to Philosophy
(PHIL) andMusic Theory(MUSIC). Both courses utilized graded course quizzes and lasted seven and five weeks, respectively. Both courses had one graded quiz per week, with 6-12 and 10-14 ques-tions per quiz, respectively. Students did not receive any specific in-struction to encourage collaboration. We used Coursera trace data in JSON, which includes in a raw format of events, most of the ac-tions and clicks performed by the student while interacting with the MOOC. Overall, we collected data about 2,359 and 5,159 students from thePHILandMUSICcourses, respectively. For each student in both courses we extracted:
• FinalGrade: The final numeric course grade (between 0 and 100).
• SubmissionTimes: The list of timestamps of all submis-sions to course graded problems by a given student.
• GotCertificate: Boolean variable indicating whether a given student obtained a certificate in a given course or not.
• SubmissionCount: The total number of submissions to graded problems that a particular student attempted.
• DistinctVideoCount: The total number of unique lec-ture videos accessed or downloaded by a given student.
• DistinctThreadCount: The total number of unique dis-cussion topics accessed by a given student.
3.2
Student similarity based on problem
sub-mission times
3.2.1
Basic problem description
In order to specify our algorithm, we first start with the basic no-tation used in the rest of the paper. LetNdenote the total number of students in a course andM the total number of graded assign-ments in the course. Let us also defineN vectors for each of the student so that
~
spi= [spi,1spi,2 · · · spi,M], i∈ {1· · ·N}
contains timestamps of all Msubmissions for a given studenti. In the case when the studentidid not submit the assignmentj,
spi,j=N A.
Let us define a matrixSP ∈ NN×M
as SP = ~ sp1 ~ sp2 .. . ~ spN =
[sp1,1 sp1,2 sp1,3 . . . sp1,M]
[sp2,1 sp2,2 sp2,3 . . . sp2,M]
..
. ... ... . .. ...
[spN,1 spN,2 spN,3 . . . spN,M]
where a matrix entryspi,jrepresents an integer timestamp at which
student isubmitted a graded assignment j. Also let us define a dissimilarity matrixDS∈ RN×N
as DS=
ds1,1 ds1,2 ds1,3 . . . ds1,N
ds2,1 ds2,2 ds2,3 . . . ds2,N
..
. ... ... . .. ...
dsN,1 dsN,2 dsN,3 . . . dsN,N
where each entrydsi,j is a real number representing the
dissim-ilarity between studentsiandjbased on the differences in their assignment submission times. Each element of matrixDSis calcu-lated by a chosen dissimilarity functiondiss(sp~i, ~spj)∈ Rwhich
operates on vectors of student submission timestamps. In cases when one of the submission timestamps isN A, the distance be-tween those two students is alsoN A:
dsi,j = (
diss(sp~i, ~spj) ∀k, spi,k6=N A, spj,k6=N A
N A otherwise (1)
When a chosen dissimilarity function is also adistance metric
(i.e., satisfies the triangle inequality), the matrixDSis also sym-metric i.e.,dsi,j =dsj,i. Note that all entries of the main diagonal
are also zero (dsi,i= 0for all1≤i≤N), thus making the matrix
DSalso a hollow matrix. Notice also that computing all values of matrixDS has a complexity ofO(N2∗d), wheredis the cost of computing the distance between vectorsspiandspj. Thus, the
overall complexity of computing values in matrixDSdepends on the adopted dissimilarity measure and the total number of students and submissions in the course.
From the calculated distance matrix, we extract a setDthat rep-resents distances between any two accounts in the course using the lower triangular portion of the matrixDS. Each entry in a setdi,j
is a triplet in a form(i, j, dsi,j):
D={(i, j, dsi,j) |1≤i≤N,1≤j≤i−1, dsi,j∈DS}.
3.2.2
Problem operationalization
Given that there are several potential operationalizations of the general problem description from the previous subsection, in this paper, we operationalized the problem using the following set of criteria:
Graded problems: We used answers to automated graded quizzes as input to matrixSP. Given that students are often allowed unlimited attempts for each quiz, we used only the time of last submissions to each quiz.
Course students: We focused only on students who completed all graded quizzes in the course. More formally,spi,j 6= N A
for all1≤i≤N and1≤j≤M. This is done primarily to make the execution of the algorithm less computationally demanding as it limits the number of potential student pairs. Calculating distance between students based on all of their graded assignments also reduces the chances of obtaining a small distance between a pair of students based on chance alone.
Dissimilarity measure: In the study, we used two dissimilarity measures which are also metric distances. The first mea-sure we used was the mean absolute deviation (MAD) distance which calculated the distance between two vectors as the av-erage of absolute differences between vector elements:
dissM AD(sp~i, ~spj) =
1 M
M X
k=1
|spik−spjk| (2)
The second measure we used was the mean squared deviation (MSD) distance metric which calculated the distance between two vectors as the average of squared differences of vector elements:
dissM SD(sp~i, ~spj) =
1 M
M X
k=1
(spik−spjk)2 (3)
As we calculated the distances between students using the two distance metrics (i..e,MAD, andMSD) we used superscripts to de-note a particular distance metric. Similarly, we used subscripts to denote a particular course (i.e.,musandphifor theMUSICand
PHILcourses, respectively). Using our notation,DSM SD mus would,
for example, denote a distance matrix in theMUSICcourse using theMSDdistance metric.
3.3
Identifying close submitters
3.3.1
Selecting the similarity threshold
After the distances between all course participants had been cal-culated, we selected the list of close submitters by examining the distribution of distances between students. We did this by first plot-ting the distribution of account pair distances and then selecplot-ting the initial “common-sense” threshold forMADmetric. In our case, we selected 30 min as the initialMADthreshold for both courses and then calculated the corresponding quantile values (i.e., the percent-age of distances smaller than 30 minutes) forMADdistance metric in both courses. As the two courses had slightly different distri-butions of student distances, the sameMADthreshold value of 30 minutes resulted in two separateMADquantile threshold values.
also want to compare close submitters between the two courses, we used the initialMADquantile threshold values to establish the list of common quantile thresholds which were then applied to both courses and for both distance metrics. The use of the same quantile thresholds in both courses enabled us a) to compare the number of close submitters between the two courses, and b) to have a proce-dure for close submitter identification which did not depend on the particular course context and design. We opted to use more than one threshold value in order to examine how a particular threshold affected the number of close submitters identified.
3.3.2
Selecting close submitters
After we selected the particular quantile thresholdt, we built a set of close submitter account pairsCby keeping the members of the setDthat have the distance smaller thant:
C={(i, j, dsi,j)|(i, j, dsi,j)∈D, dsi,j ≤tM AD}
We used the selected triplets of close submitters to plot an undi-rected graph that represent the communities found by the algo-rithm. Each of the disconnected components of the overall graph was a set of student accounts which were identified as close sub-mitters.
3.4
Examining the differences between close
submitters and regular accounts
To understand the differences between close submitters and reg-ular accounts, we examined the differences in each of the extracted measures (Section 3.1). In addition to examining the distribution plots for each of the extracted measures, we also used a one-way multivariate analysis of variance (MANOVA) to understand the dif-ferences between the two groups of accounts and a series of follow-up univariate t-tests for each of the dependent measures.
4.
RESULTS
4.1
Student dissimilarities overview and
dis-tribution
Using the method for the detection of close submitters described in subsection 3.2, we extracted dissimilarity matricesDS and the set of distancesDamong all user accounts using the two distance metrics (i.e.,MADandMSD) from theMUSICandPHILcourses. With 5,159 accounts in theMUSICcourse, setsDM AD
mus andDM SDmus
had the total of 13,305,061 elements (i.e.,(5,159×5,158)/2). Similarly, with 2,359 students in the PHILcourse, setsDM ADphi
andDM SDphi had the total of 2,781,261 potential account pairs.
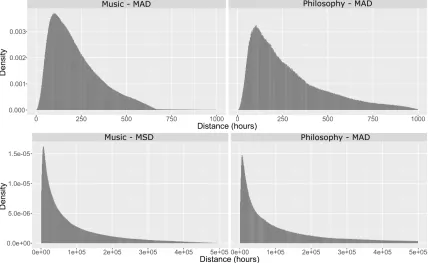
Figure 1 shows the density distribution of the extracted student distances in both courses. We can see that in both courses, the distribution ofMADdistances follows the skewed normal distribu-tion. The skewness of the distribution was likely the result of each assignment having a due date and that many students submitted their assignments relatively close to the due dates. Figure 1 also shows that the distributions of theMSDdistances followed a de-creasing exponential distribution, which was likely due to the fact that time difference is squared when usingMSDmetric. Figure 1 also shows that the variance of the distances in thePHILcourse was higher than inMUSIC, which was probably the result of seven graded quizzes instead of five graded quizzes as it was the case in theMUSICcourse. This difference in the number of assignments could likely increase the variance of the distance distribution.
4.2
Detection of close submitters
4.2.1
Selecting close submitter account pairs
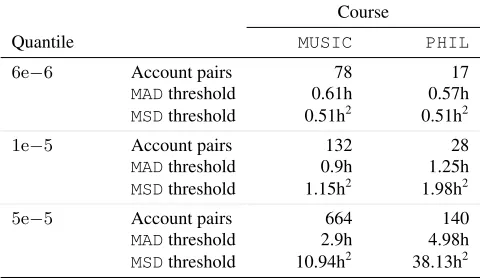
Following the method described in Subsection 3.3.1, we estab-lished an initialMADthreshold of 30 minutes that corresponded to the4.81e−6quantile in theMUSICcourse and5.75e−6quantile in thePHILcourse. Based on this preliminaryMADthreshold, we selected three quantile values (i.e.,6e−6,1e−5and5e−5) and ex-amined the correspondingMADandMSDthreshold values for each course (Table 1).
Table 1 shows that the use of the most restrictive threshold quan-tile (6e−6) results in the identification of 78 and 17 close submitter pairs in theMUSICandPHILcourses, respectively. The table also shows that this threshold corresponds to very similar values for the
MADdistance metric (i.e., 0.61h and 0.57h forMUSICandPHIL
courses, respectively) and the same threshold value for theMSD
distance metric in both courses (i.e., 0.51h2). On the other hand, the use of other two less restrictive threshold values resulted in a significantly higher number of account pairs being preserved and also higher variability in both metrics between the two courses (Ta-ble 1).
While less restrictive thresholds result in a higher algorithm re-call and the number of correctly identified student pairs, it also reduces its precision and increases the false positive rate. Given the recall vs. precision tradeoff involved in selecting the optimal threshold value, we tended to favor the algorithm precision over recall due to two reasons. First, as the use of a higher threshold exponentially increases the number of identified account pairs, it, in turn, produces larger account/student communities. However, those communities are far less likely given the distributed nature of learning in MOOCs and can be a conglomeration of several smaller communities through a certain number of false positive pairs. Sec-ondly, we were interested in examining the statistical differences in several measures between the close submitters and regular accounts which are significantly different in size. As a result, the effect of false positives on the score distribution of close submitters was far bigger than the effect of false negatives on the score distribution of the regular student accounts. Due to these two reasons, in the rest of the analysis, we used the6e−6quantile threshold which iden-tified 78 close submitter pairs in theMUSICcourse and 17 close submitter account pairs in thePHILcourse.
4.2.2
Identifying close submitter communities
After we had identified pairs of sufficiently similar student ac-counts based on the assignment submission times, we used them to construct a graph of close student submitters (Figure 2). Using the
Table 1: Number of account pairs,MADandMSDvalues after applying different quantiles as threshold of the distance distri-bution for music and philosophy courses.
Course
Quantile MUSIC PHIL
6e−6 Account pairs 78 17
MADthreshold 0.61h 0.57h
MSDthreshold 0.51h2 0.51h2
1e−5 Account pairs 132 28
MADthreshold 0.9h 1.25h
MSDthreshold 1.15h2 1.98h2
5e−5 Account pairs 664 140
MADthreshold 2.9h 4.98h
Figure 1: Density distribution of the two adopted distance metrics in both courses.
close submitter pairs of accounts, we plotted the different accounts as graph nodes connected with a undirected edge between each one of the pairs. The number and size of the groups of learners that we find were as follows:
• MUSIC: 30 couples, two three-member communities, one four-member community, three five-member community, and one 14-member community. Overall, the graph included 99 different student accounts.
• PHIL: 11 couples and one four-member community. Over-all, the graph included 26 different student accounts. Visual inspection reveals that the majority of identified commu-nities were simple pairs of student accounts. We can also observe several larger communities which often form cliques. However, it should be noted that, as we applied a very restrictive similarity threshold, it was also very likely that some of the larger communi-ties missed some of the edges between the nodes.
4.3
Examining the differences between close
submitters and regular accounts
After we had identified close submitter accounts, we examined the differences between them and the rest of the student population. We first analyzed the difference in terms of earning the certificate between close submitters and the rest of the accounts (Table 2). As close submitter accounts submitted all graded quizzes, to make the comparison sensible, we compared them with only the accounts who also submitted all graded quizzes. Table 2 shows that for reg-ular accounts the certificate accomplishment ratio was 84.3% and 95.5% forPHILandMUSICrespectively; in the case of close sub-mitter accounts the certificate accomplishment ratio was 78.8% and 76.9% forPHILandMUSIC. Therefore, the ratio of certificate ac-complishment was lower for close submitters, which was somewhat an unexpected finding.
We also examined the differences between the close submitters and the rest of the course populations in terms of the five extracted measures described in Section 3.1. To keep the comparison
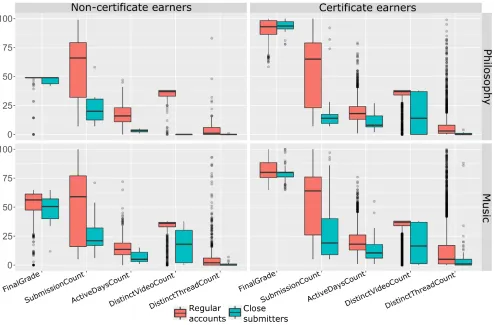
be-tween two groups sensible, we compared separately students who obtained a certificate and those who did not (Figure 3). We see that both close submitters and regular accounts had a similar distri-bution of their final grades, regardless of whether they obtained a certificate or not. This was somewhat expected due to the ceiling effect of the certificate grade threshold. For the rest of the indica-tors, we can see a clear difference between the two groups, with close submitters having considerably lower values than the rest of accounts population for the certificate and non-certificate earners of both courses.
To examine whether the observed differences were statistically significant, we conducted a one-way MANOVA analysis with a close submitter indicator as a single independent measure and four extracted measures as the dependent variables for each course in-dependently. We observed statistically significant MANOVA dif-ferences between the two groups of accounts in both courses for certificate earners (MUSIC course: F = 55.74, p = 2e−16;
PHILcourse: F = 15.6,p = 1e−12) and non-certificate earn-ers (MUSIC course: F = 14.03, p = 4e−11; PHILcourse:
F= 13.9,p= 3e−9).
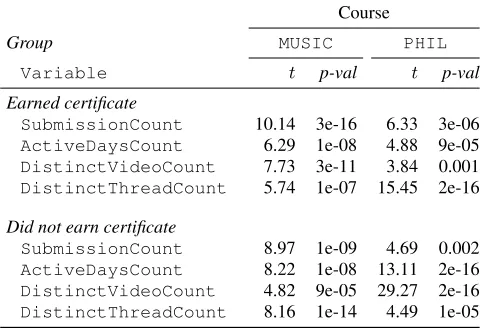
We followed up the significant MANOVA results with a series of four univariate analyses using independent unpaired t-tests (Table 3). The use of MANOVA analyses is often considered a protec-tion measure against inflated Type II error rate [4]. However, as
Table 2: Crosstabulation of the number of close submitters and certificate earners in the two courses. Only accounts that sub-mitted all quizzes are included.
Certificate
Course Account type No (%) Yes (%) Total
MUSIC Close submitters 78 (78.8%) 21 (21.2%) 99
Regular accounts 4262 (84.3%) 794 (15.7%) 5056
PHIL Close submitters 20 (76.9%) 6 (23.1%) 26
Figure 2: Community visualization of the couples and groups detected as close submitters after applying the algorithm.
indicated by Bray and Maxwell [5], this is only true for depen-dent measures for which we observed significant multivariate dif-ferences. Hence, to further protect from the inflation of the Type II error rate, we used a restrictive Bonferroni correction procedure and the significance level ofp= 0.0125(i.e.,0.05/4). Univariate analyses indicated significant differences between close submitters and the rest of student population in all four dependent measures for certificate and non-certificate earners in both analyzed courses (Table 3). Our results suggest that close submitter students were able to earn certificates with using a fewer submissions attempts, being active smaller number of days, watching fewer videos, and being less engaged in the course discussion forums. Additionally, a similar pattern was found for close submitters that did not earn a certificate. The observed differences further confirm that we were indeed able to identify the different population of students with sub-stantially different behavioral patterns.
5.
DISCUSSION
Without going into the further investigation of potentially dis-tinct behaviors of close completers, our approach allows for detect-ing distinct groups of students who tend to work together to suc-cessfully complete an online course. Here, we specifically focused on learning at scale (i.e., MOOCs), as a particularly challenging environment from various aspects. For example, given the num-ber of learners commonly enrolled in MOOCs, it is rather
chal-Table 3: Independent unpaired t-tests for the differences be-tween close submitters and the rest of accounts.
Course
Group MUSIC PHIL
Variable t p-val t p-val
Earned certificate
SubmissionCount 10.14 3e-16 6.33 3e-06
ActiveDaysCount 6.29 1e-08 4.88 9e-05
DistinctVideoCount 7.73 3e-11 3.84 0.001
DistinctThreadCount 5.74 1e-07 15.45 2e-16
Did not earn certificate
SubmissionCount 8.97 1e-09 4.69 0.002
ActiveDaysCount 8.22 1e-08 13.11 2e-16
DistinctVideoCount 4.82 9e-05 29.27 2e-16
DistinctThreadCount 8.16 1e-14 4.49 1e-05
lenging to form communities of learners and create collaborative learning environment [12, 20]. The proposed method, therefore, allows for automated identification of students who tend to study together and potentially reveal different types of collaborations -e.g., those who genuinely collaborate to learn and obtain a certifi-cate and those who perhaps show certain behaviors that could be characterized as academic dishonesty. Such information could be potentially relevant for both - students who are looking for poten-tial collaborators, as well as for teachers, in the form of insight into various behaviors emerging from student interactions.
Our findings are in line with Brooks and colleagues [6] and Li and colleagues [18] who also observed students’ tendency to study in small groups within MOOC educational settings. It also seems that such an approach to learning is associated with higher course performance and persistence in a course. However, our study fur-ther revealed that this form of collaboration also involves close as-signment submission. Moreover, our study indicated the existence of additional forms of student collaborations. It is also striking that students tend to organize in small, rather disconnected groups, based on their interaction outside the “classroom” settings [12]. It seems that further support is needed to provide a more comprehen-sive guidance that would allow those small groups to emerge into sustainable communities [20]. On the other hand, this particular behavior could be a determining characteristic of students who are primarily performance-oriented and focused on obtaining a certifi-cate. For example, while Brooks et al. [6] observed that those students who enroll together in a course tend to participate in the discussion forums as well, our results suggest that this group of students was less engaged in forum interactions than other students who did not submit assignments together. This further suggests that our algorithm identified groups of students that were particularly focused on working in small groups towards achieving a common goal, without the tendency to actively engage with other peers.
Figure 3: Differences between close submitters and the rest of accounts across extracted variables.
submitters to be lower in this study, this finding could be associated with CAMEO where students would create fake accounts to use exhaustive search to harvest correct solutions, and those accounts would not earn a certificate [19, 24, 2]. Some of these behaviors might be more hurtful for the learning process than others, and maybe actions should be carried out if accurately detected; how-ever more work is still required in the direction of how learning is affected by these different behaviors.
In this study, we have established conservative thresholds to de-tect close submitters which warrant further consideration of the number of accounts detected as a lower bound. For instance, we saw that certain communities became bigger when higher thresh-olds are used. However, as the increase in the recall would likely decrease precision, more work is required to set up the detection threshold and to improve the algorithm to control for false posi-tives. For researchers seeking to replicate and use this algorithm, we would recommend to take our reported thresholds as a guide and encourage them to empirically seek the ones adequate for their case study and context. For example, the average difficulty and number of questions per quiz can also have an effect on the mean of the distribution. Hence, a special care should be taken when trying to establish a threshold for detecting close submitters in any particular context. With this in mind, we suggest the use of aver-aged dissimilarity metrics that help for comparison among courses with different number of submissions and also squared metrics that can penalize large distances better.
We applied the proposed algorithm to two introductory MOOCs, one on philosophy and another one on music. We expect that we would able to find students collaborating or cheating in most of on-line environments and contexts. However, subject area, university
profile, type of assignments, and other factors can have an effect on the number of students engaging in such behaviors in each case study. For example, if we check in MOOCs about topics that might have a higher industry value such as computer science or data sci-ence, or from one of the top schools such as Harvard or MIT, should we expect the number of students collaborating or cheating to be higher? Additionally, in other contexts, such as online, on-campus, for-credit courses, we could also expect to see an impact on this issue as well.
The main limitation of this study is that we showed that the two populations were statistically different given the selected indica-tors. However, we still have to deepen into these findings to infer the various associations between accounts and to delve into the be-havior of students. Therefore, we are still unable to fully explain the actions that these students were performing and this is part of the future work.
6.
CONCLUSIONS AND FUTURE WORK
This study starts the trail for potential future work in several di-rections. One direction is to improve the algorithm to be able to deal with students who did not submit all questions in the course or did not work on all assignments together (i.e., submitted tempo-rally close to each other). Another direction is to apply the algo-rithm in a bigger longitudinal study with more MOOCs to increase generalizability and address other questions such as whether the same accounts were collaborating across several MOOCs or not. Moreover, an in-depth analysis of the couples and communities detected is necessary to characterize possible differences in links between close submitters – e.g., academically dishonest collabora-tions, CAMEO or real beneficial communities of learning. Finally, the group formation results based on close submissions might be combined for analysis with data from other learning activities such as forums.
7.
ACKNOWLEDGMENTS
Work partially funded by the Madrid Regional Government with grant No. S2013/ICE-2715, the Spanish Ministry of Economy and Competitiveness project RESET (TIN2014- 53199-C3-1-R), and the European Erasmus+ projects MOOC Maker (561533-EPP-1-ES-EPPKA2-CBHE-JP) and SHEILA (562080-EPP- 1-2015-BE-EPPKA3-PI-FORWARD).
References
[1] P. Adamopoulos. What makes a great MOOC? An interdisci-plinary analysis of student retention in online courses. InICIS 2013 Proceedings, Dec. 2013.
[2] G. Alexandron, J. A. Ruipérez-Valiente, Z. Chen, P. J. Muñoz-Merino, and D. E. Pritchard. Copying@Scale: Using har-vesting accounts for collecting correct answers in a MOOC.
Computers & Education, 2017.
[3] R. Baker, J. Walonoski, N. Heffernan, I. Roll, A. Corbett, and K. Koedinger. Why students engage in" gaming the system" behavior in interactive learning environments.Journal of In-teractive Learning Research, 19(2):185, 2008.
[4] R. D. Bock. Multivariate Statistical Methods in Behavioral Research. Scientific Software International, Jan. 1985. [5] J. H. Bray and S. E. Maxwell. Multivariate Analysis of
Vari-ance. SAGE, 1985.
[6] C. Brooks, C. Stalburg, T. Dillahunt, and L. Robert. Learn with friends: The effects of student face-to-face collabora-tions on massive open online course activities. InProceedings of the Second (2015) ACM Conference on Learning@Scale, pages 241–244. ACM, 2015.
[7] L. Carvalho and P. Goodyear. The architecture of productive learning networks. Routledge, 2014.
[8] D. B. Clark, V. Sampson, A. Weinberger, and G. Erkens. An-alytic frameworks for assessing dialogic argumentation in on-line learning environments. Educational Psychology Review, 19(3):343–374, 2007.
[9] D. D. Curtis and M. J. Lawson. Exploring collaborative online learning. Journal of Asynchronous learning networks, 5(1): 21–34, 2001.
[10] J. DeBoer, A. D. Ho, G. S. Stump, and L. Breslow. Changing “Course”: Reconceptualizing Educational Variables for Mas-sive Open Online Courses. Educational Researcher, 43(2): 74–84, 2014.
[11] D. Garrison. E-Learning in the 21st Century: A Framework for Research and Practice. Taylor & Francis, 2011.
[12] N. Gillani and R. Eynon. Communication patterns in mas-sively open online courses. The Internet and Higher Educa-tion, 23:18–26, 2014.
[13] N. Gillani, R. Eynon, M. Osborne, I. Hjorth, and S. Roberts. Communication communities in MOOCs. arXiv preprint arXiv:1403.4640, 2014.
[14] C. R. Glass, M. S. Shiokawa-Baklan, and A. J. Saltarelli. Who Takes MOOCs? New Directions for Institutional Research, 2015(167):41–55, 2016.
[15] C. N. Gunawardena, C. A. Lowe, and T. Anderson. Analy-sis of a global online debate and the development of an in-teraction analysis model for examining social construction of knowledge in computer conferencing.Journal of educational computing research, 17(4):397–431, 1997.
[16] L. Harasim. Shift happens: Online education as a new paradigm in learning. The Internet and higher education, 3 (1):41–61, 2000.
[17] C. Jones. Networked learning: an educational paradigm for the age of digital networks. Springer, 2015.
[18] N. Li, H. Verma, A. Skevi, G. Zufferey, J. Blom, and P. Dil-lenbourg. Watching moocs together: investigating co-located mooc study groups. Distance Education, 35(2):217–233, 2014.
[19] C. G. Northcutt, A. D. Ho, and I. L. Chuang. Detecting and preventing “multiple-account” cheating in massive open on-line courses.Computers & Education, 100:71–80, 2016. [20] P. Oleksandra and D. Shane. Untangling mooc learner
net-works. InProceedings of the Sixth International Conference on Learning Analytics & Knowledge, pages 208–212. ACM, 2016.
[21] R. Pekrun, T. Goetz, W. Titz, and R. P. Perry. Academic emo-tions in students’ self-regulated learning and achievement: A program of qualitative and quantitative research.Educational psychologist, 37(2):91–105, 2002.
[22] J. Reich. Rebooting MOOC Research. Science, 347(6217): 34 – 35, 2015.
[23] J. Reich, B. Stewart, K. Mavon, and D. Tingley. The civic mission of moocs: Measuring engagement across political differences in forums. In Proceedings of the Third (2016) ACM Conference on Learning@ Scale, pages 1–10. ACM, 2016.
[24] J. A. Ruiperez-Valiente, G. Alexandron, Z. Chen, and D. E. Pritchard. Using multiple accounts for harvesting solutions in moocs. InProceedings of the Third (2016) ACM Conference on Learning@Scale, pages 63–70. ACM, 2016.
[25] N. M. Webb. Peer interaction and learning in small groups.