Progress in Chemical and Biochemical Research
Journal homepage: www.pcbiochemres.com
Development of chemically modified pencil graphite electrode based on
benzo-18-crown-6 and multi-walled CNTs for determination of lead in water samples
Walaa Haider Elobeid, Abdalla Ahmed Elbashir*University of Khartoum, Faculty of Science, Department of Chemistry, Khartoum, Sudan
1. Introduction
Monitoring of lead even at very low concentration levels is getting a permanently significant, due to the fact that it is widely used in various industries, and its toxicity
influents the public and the environments causing serious damage that can lead to death [1-5].
Literature survey shows that a number of sophisticated techniques were employed to regulate the G R A P H I C A L A B S T R A C T
A R T I C L E I N F O
Article history:
Received: 06 January 2019 Accepted: 01 March 2019 Available online: 14 March 2019 Manuscript ID: PCBR-1810-1011
A B S T R A C T
An improvement to the performance of the bare pencil graphite electrode (PGE) was made by modifying it utilizing p-amino benzene sulfonic acid (p-ABSA), benzo-18-crown-6 and multi-walled carbon nanotubes (CNTs) to detect lead (II) ions in water samples using differential pulse anodic stripping voltammetric technique. The presence of p-ABSA serves as ionic conductor while the good adsorption ability and electrical conductivity of multi-walled CNTs enhanced the sensitivity through increasing the electrochemical active surface area. Furthermore, using benzo-18-crown-6 as a molecular scavenger improved the selectivity for lead (II) ions. After optimizing the experimental and chemical parameters, the proposed electrode demonstrated linearity toward the lead (II) ions in a concentration range of 15-200 µM, and 0.99852 correlation factor at 5 sec accumulation time. The detection and qualification limits were statistically calculated based on ICH guidelines as 5.72 µM and 17.32 µM, respectively. The sensor demonstrated a very good selectivity over heavy metals for instance Zn (II), Fe (III), Cr (III), Cu (II) and Mn (VI). The developed method was adequately applied for the determination of Pb (II) ions in water samples. The results obtained by the current method were compared to the acquired results utilizing ICP-OES. According to the statistical consideration, the two methods were considered identical.
K E Y W O R D S
Differential pulse anodic stripping voltammetry
Prog. Chem. Biochem. Res. ARTICLE
2019, 2 (1): 24-33 | 25 level of lead (II) ions in environmental water samples,
such as atomic absorption spectroscopy (AAS) [6], inductively coupled plasma atomic emission spectroscopy (ICP-AES) [7], X-ray fluorescence spectrophotometer [8] and inductively coupled plasma-mass spectrometry (ICP-MS) [9]. Besides the advantages like sensitivity and applicability to a large number of elements, these techniques are time consuming, effort consuming and high-price [10]. The growing diversity of low-price analytical sensors with ease of miniaturization, minimal sample pretreatment and high simplicity and efficiency for the detection of pollutant make the voltammetry techniques as the most attractive ones [11-13]. However, the efficiency of the voltammetry is mainly affected by the working electrode material, the major existing working electrodes in the last several years are mercury electrodes which have many benefits like surface renewability, amalgam and reproducibility. The toxicity with non-disposable of mercury leaded to limit its use [14] of alternative non-toxic electrodes such as bore doped diamond, gold and silver electrodes, gold nanoparticles-modified electrodes which have been progressed and utilized in anodic striping voltammetry techniques. Bismuth film electrodes are environmentally friendly which can be used as alternative electrodes for the toxic mercury electrodes. Moreover, bismuth electrodes have stability and potential window. Accordingly, glassy carbon, screen-printed carbon ink, and gold have been successfully used. Chemically modified electrodes are introduced to develop alternative electrodes for metal ion determination [11]. Recently, macrocyclic compounds such as crown ether have been used for modifying electrodes to detect heavy metals; high selectivity of the detection of metal ions can be accomplished using ionophore as molecular scavenger, the selection of ionophore according to the crown ether cavity, appropriate for a specific molecule and complexion ability. To achieve high degree of ability to conduct when the ionophore is used in the sensing platform, carbon nanotubes have selected due their excellent conductivity, high surface area and chemical stability [15]. Literature survey reveals that few studies based on ionophore/CNTs modified electrodes were found [11, 16–20], where a glassy carbon electrode modified with Nafion, carbon nanotubes and benzo-18-crown-6 was used [14]. Besides, the elevated area of the electrochemical reaction of CNTs and powerful ability of the complex of crown ether cooperatively enhanced the voltammetric response for the electrochemical analysis of lead.
Therefore, this work is an attempt to continue our previous work in which voltammetric method using a 7 B
bare pencil graphite electrode to detect Pb (II) ions in the water samples was reported [10]. The current study presented here describes the modification of PGE based on p-ABSA Benzene-18-crown-6 and multi-walled CNTs to develop the detection of Pb (II) ions in water samples via cyclic voltammetry and differential pulse anodic stripping voltammetry. However, the modified electrode enhanced the electrochemical redox of Pb (II), and pointed out a better detection and quantification limits with relatively long life time as compared to the bare PGE. The proposed analytical procedure is easy to adopt, cheap, user- friendly and well-reproducible.
2. Experimental
2.1 Chemicals and reagents
All chemicals utilized in this work were analytical grade, and supplied from Rasayan Laboratories (Mumbai, India), if not differently declared. Primary lead solutions were prepared by dissolving an adequate weight of lead acetate in deionised water. Benzo-18-Crown-6, Carbon nanotubes-multiwalled was purchased from sigma aldritch. p-aminobenzene sulfonic acid (p-ABSA) was purchased from SDFCL. The standards for optimization of work were prepared by dilution of the primary lead solution with deionised water. A 0.1 M of buffer solutions were prepared by dilution of acetic acid and sodium acetate. This was then strengthened with adequate potassium chloride to yield a 1.0 M solution. Water samples (ground water) were obtained from south Khartoum “El- Farouk”city, Gedaref state, and bottled water samples were purchased from local Sudanese market. The mechanical cleaning of the working electrode was carried out using Aluminum oxide 60 G neutral (Type B) from MERCK (Darmstadt, Germany).
2.2 Instrument and Apparatus
buffer solutions prior to measurements. Scanning electron microscopy was undertaken using a SEM (Zeiss Evo LS 10, Germany). Overall measurements were carried out at room temperature (25±1°C).
2.3 Preparation PGE modified by of p-ABSA/Benzo-18-crown-6/CNTs
The PGE (7 B) was polished with 0.05 μM alumina powder utilizing filter papers, and washed with deionised water and then cleaned by ultra-sonication for 2 min. The mixture was prepared by mixing 0.02 g of CNTs and 0.01 g of benzo-18-crown-6 in the 0.5 % of p-ABSA in 50 mL deionized water (at 40 °C) and then sonicated for 15–20 min to form a homogeneous suspension. At last, 10 μL of the p-ABSA/benzo-18-crown-6/CNTs mixture was drop on the PGE surface, and then the PGE was dipped into the mixture several times and dried at room temperature. Finally, it was immersed in a solution consisting Pb (II) ions 0.001 M for 10 min and, then, rinsed with deionised water prior to measurements.
2.4 Electrochemical measurements
After optimizing the chemical and experimental conditions such as pH, scan rate and accumulation time, the p-ABSA/Benzo-18-crown-6/CNTs modified PGE was submerged in a solution comprising 0.1 mM lead (II), acetate buffer (pH 3.9) and potassium chloride (1.0 M) after 5 sec accumulation time and at scan rate 100 mV/s, the cyclic voltammetric and differential pulse measurements were carried out.
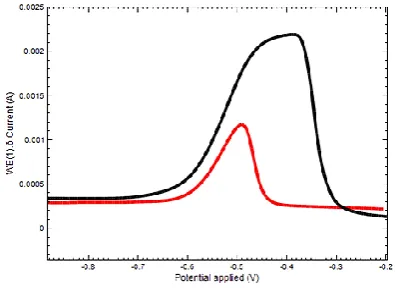
Fig. 1. Cyclic voltammograms of 0.1 mM Pb(II) in 0.1 M acetate buffer solution pH (3.9), 5 sec accumulation at the scan rate of 100 mV/s. at (A) Bare pencil graphite electrode (Red color) and (B) p-ABSA/Benzo-18-crown-6/CNTs modified PGE (Black color)
The cyclic voltammogram showed in Figure 1 exhibits a well-defined anodic (-0.3 V) and cathodic (-0.7 V) voltammetric peaks. The comparison of the obtained results using bare PGE shows the same peaks with shift in
the potential and intensity as (-0.4 V) and (-0.8 V) for the anodic and cathodic voltammetric peaks, respectively. In the absence of Pb (II) ions at the same conditions, no anodic and cathodic peaks are observed which could be interpreted by the incorporation of Pb(II) ions in the cavity of the crown (results not shown). Furthermore, Figure 2 expresses the differential pulse voltammogram of bare PGE and p-ABSA/Benzo-18-crown-6/CNTs modified PGE performed at the same optimal conditions, the figure emphasizes that the introducing of p-ABSA, benzo-18-crown-6 and CNTs to the surface of the electrode improved the peak intensity of the electrode as compare to the unmodified one.
Fig. 2. Differential pulse anodic stripping voltammograms of 0.1 mM Pb(II) in 0.1 M acetate buffer solution pH (3.9) at (A) Bare pencil graphite electrode, (B) p-ABSA/Benzo-18-crown-6/CNTs modified pencil graphite electrode
3. Results and discussion
Crown ether has a pair of electrons in its central atom which gives it an excellent ability to interact with the metal ions and makes it widely used in the host-guest chemistry as it is called host compound or ionophore. This coordination depends on the ion-dipole interaction between the metal ion and the heteroatom present in the ionophore, as shown in Scheme 1 [14].
Prog. Chem. Biochem. Res. ARTICLE
2019, 2 (1): 24-33 | 27 Also, the selectivity of this interaction according to the
cavity size of ionophore and the diameter of metal ion forms 1:1 host: guest complex if being completely fit. In this study, the Pb(II) ions diameter (2.4 A°) exactly fit to the size of the bore of 18- crown-6 (2.20 –3.20 A°) [14,21].
3.1 Characterizations of p-ABSA/benzo-18-crown-6/CNTs sensor
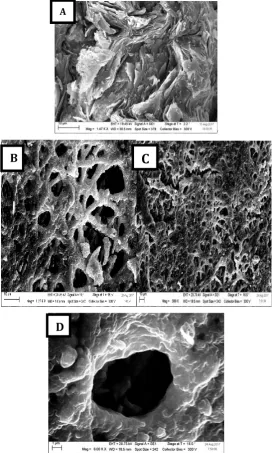
One of the effective tools that can be used to investigate the morphology of the modified electrodes is the scanning electrode microscope techniques SEM, the
response of the SEM is the result of interaction between the electrons and atoms in the electrode under test resulting a feedback about the surface topography and homogeneity in addition to the composition of the electrode under test. The SEM images of p-ABSA/benzo-18-crown-6/CNTs modified PGE as shown in Figure 3, it is clear from the SEM image in Figure 3 A that the nature of the surface of the bare PGE is heterogeneous but the Figure 3 B, C and D revealed more arrangement in the morphology as the results of combining the benzo-18-crown-6 and the CNTs with the electrode material.
Fig. 3. SEM images of bare pencil graphite electrode A with the p-aminobenzene sulfonic acid/Benzo-18-crown-6/CNTs modified PGE B, C and D at different magnifications
3.2 Electrochemical characterization
Cyclic voltammetry of bare and modified PGE is shown in the voltammogram in Figure 1 as mentioned above,
they revealed enhancement of the peaks intensity in the case of the modified PGE. Furthermore, Peak separation value indicated a quasi-reversible electrode behavior [22]. A
B
C
Cyclic voltammetry studies were also employed to determine the active surface area of the modified and unmodified PGEs using the 1.0 molL-1 of ferric cyanide
considering the relation between the square root of scan rate and the redox peaks current utilizing the following Randles Sevcik equation No. 1
Ip = 2.65 x 10⁵AD1/2 n3/2v1/2 C (1)
Where n is the number of electrons taking part in the redox reaction, A denotes the area of the electroactive surface (cm2), D represents the diffusion coefficient of the
molecule in solution (cm2 s-1) C corresponds to the bulk
concentration of the redox probe (mol cm-3), and v is the
scan rate (V-1), and Ip defines the peak current of the
redox couple. Depending on the equation, the value of the electroactive surface area is proportional with the peak current [19].
The diffusion constant value at 25°C (D= 7.6×10⁻⁵ cm2
s-1) was calculated utilizing the previously published data
[23].
The electroactive surface area A is calculated by using the value of Ip/v1/2, while maintaining the constant values
of D, n (n=1), and C* (5mmolL-1). According to the above
equation, there is a linear relationship among the peak current and the square root of scan rate which shows the reversibility of the electrochemical reaction happened on the surface of the electrode. The electroactive surface area of the modified PGE calculated as 0.002 cm2 while the
Bare PGE was found to be 0.001 cm2. So the sensitivity of the modified PGE is increased comparing with the unmodified one.
3.3 Optimization of chemical and experimental parameters
3.3.1 Influence of the pH
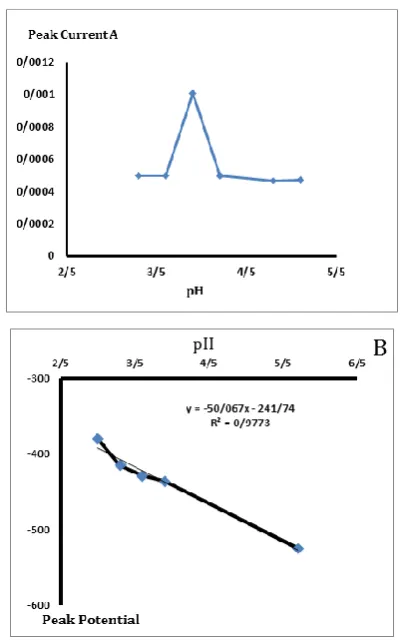
The use of cyclic voltammetric response to study the effect of the pH of the electrochemical measurements of Pb (II) ions gives an insight of the mechanism of the electrode reaction and the analyte. As indicated in Figure 4. the effect of pH of the cyclic voltammetric response is recorded over a range of pH (3.0 to 7.5) in 0.1 M acetate buffer, the peak started at pH 3.0 till reached the maximum value at pH 3.9 at that the peak current reduced with rising the pH up to 5.7 as illustrated in Figure 4 A. Accordingly, the hydrolysis of Pb (II) ions happens at higher pH values [14]. Peak potential was shifted to less positive values and followed the next equations 2:
Ep (mV) = 241.74 – 50.06 pH (R2 = 0.98) (2)
As illustrated in Figure 4 B, the slope of this equation is found to be 50.06 mV/ pH. This near of the slope to the expected theoretical value [24] of 59mV/pH suggests that the number of the electrons transferred during electrochemical process is equal to that of the protons participating in the electrode reaction.
Fig. 4 A. Cyclic voltammetric study of 0.1 mM Pb(II) at p-ABSA/benzo-18-crown-6/CNTs modified PGE using 0.1 M acetate buffer solution at different pH values, 5 sec accumulations at the scan rate of 100 mV/s
3.3.2 Effect of Scan Rate
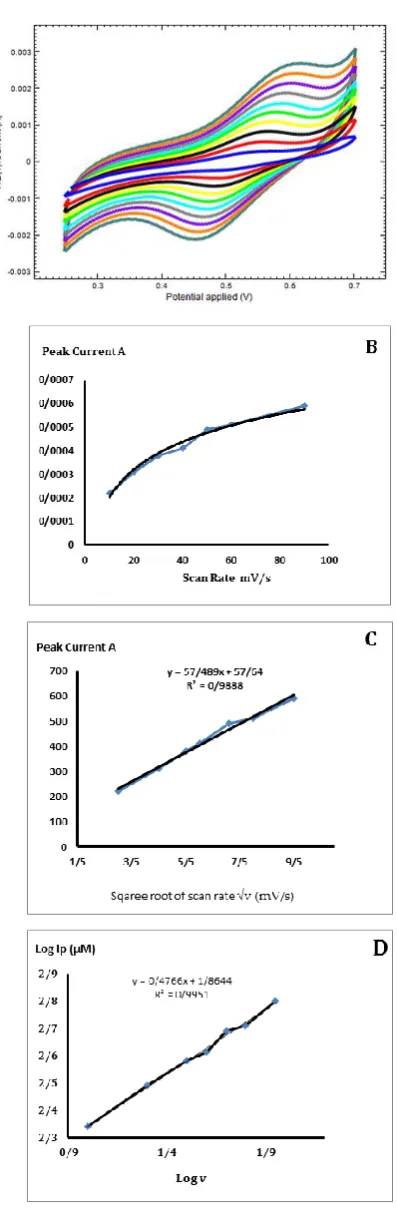
In a cyclic voltammetry experiment, scanning, the potential in both directions provides the opportunity to explore the electrochemical behavior of species generated at the electrode. The influence of scan rate on the peak current of 0.1 mM of Pb (II) ions at p-ABSA/benzo-18-crown-6/CNTs modified PGE at pH (3.9) was investigated using cyclic voltammetric response in the range of 10 to 100 mV/s. the results showed that increasing of peak current with increasing of scan rate as pointed out in Figure 5 (A and B). Hence scan rate can be used to determine if the is diffusion or adsorption controlled.
Abdalla Ahmed Elbashir et.al Prog. Chem. Biochem. Res.
30 |2019, 2 (1): 24-33
Fig. 5. A. The effect of scan rates (mV/s) on the peak current (Ip/𝜇A) of
Pb (II) ions at p-ABSA/benzo-18-crown-6/CNTs modified PGE at pH = 3.9. B. effect of peak current (I/A) with the change of scan rate, C. is the plot of peak current I/A vs. square root of scan rate √v (mV/s) and D is the plot of Log (Ip/µM) vs. Log v
In Figure 5 (C) a linear relationship between square root of the scan rate and anodic peak current indicates the diffusion controlled currents [25] which obtained as follows
Ip (µA) = 4v 1/2 + 0.2 (R2 = 0.9959) (3)
Moreover, plotting log Ip versus log V a linear relationship was observed as shown in Figure 5 (D) and equation 4 expresses that
Log Ip (µA) = 0.473 log v + 1.8686 (R2 = 0.998) (4)
The slope value of 0.473 was comparable to the theoretically expected value of 0.5 for a diffusion controlled process [26] providing further evidence that the electrochemical redox of Pb (II) was a diffusion controlled reaction, due to the best peak in the presented voltammogram the scan rate 100 v/s was selected for further studies.
3.3.3 Effect of Accumulation Time
The effect of the accumulation time on the anodic peak current of 0.1 mM Pb (II) solution using p-ABSA/Benzo-18-crown-6/CNTs modified PGE is shown in Figure 6, the accumulation which happens prior to the voltammetric measurements can affect to the electrochemical redox at the electrode. When the metallic ions were completely reduced at a certain accumulation time, it would lead to a higher peak current, and when the accumulation time is extremely long the reduced ions cover the entire effective electrode surface, causing saturation for the electrode surface area and hence, the peak current does not change with increasing accumulation time, this explains why we have chosen 5 sec accumulation time for more measurements.
3.4 Validation and Analytical application of the method
The proposed method was validated by considering several parameters recommended by ICH guidelines [27, 28] such as linearity, precision, accuracy, robustness and selectivity.
Linearity: after optimizing the chemical and experimental conditions and using differential pulse voltammetry at different concentration of Pb (II) in the range 15 to 200 µM, the resultant voltammograms showed that there is a linear relationship among the intensity of the peak current and the Pb (II) concentration as described in Figure 7 providing a regression equation 5 y=0.0061x+0.7033 with a correlation factor R2 = 0.99852.
Table 1 shows the other regression data.
Fig. 7. Calibration plot of peak current I/mA versus concentration µM of Pb (II)
3.5 Limit of Detection LOD and Limit of Quantitation LOQ
LOD is the smallest amount of analyte in a sample which can be detected but not necessarily qualified, which is different from the limit of blank, a common approach to
estimate the LOD consists the standard deviation of the response (δ) and the slope (S) of the calibration curve according to equation LOD=3.3 (δ/S).
LOQ is the smallest amount of analyte in a sample which can be quantitatively determined with appropriate precision and accuracy method. LOQ can approved by calculations based on the equation LOQ=10 (δ/S). The values were shown in Table 1.
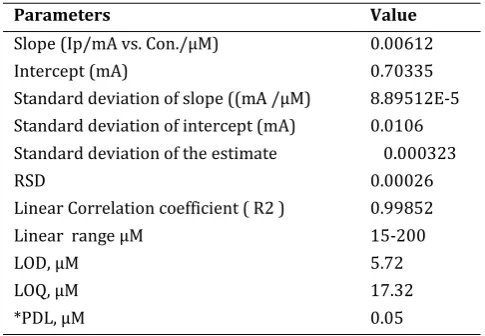
Table 1. Analytical parameters of Pb (II) ions at p-ABSA/benzo-18-crown-6/CNTs modified PGE electrode by using DPV method for determination of Pb (II) ions
Parameters Value
Slope (Ip/mA vs. Con./µM) 0.00612
Intercept (mA) 0.70335
Standard deviation of slope ((mA /µM) 8.89512E-5 Standard deviation of intercept (mA) 0.0106 Standard deviation of the estimate 0.000323
RSD 0.00026
Linear Correlation coefficient ( R2 ) 0.99852
Linear range µM 15-200
LOD, µM 5.72
LOQ, µM 17.32
*PDL, µM 0.05
*PDL= practical detection limit
3.6 Precision (Repeatability and Reproducibility)
The intra and inter-day precision were estimated by using freshly prepared solutions in triplicate on the same day and on three different days, respectively, using the proposed method. The repeatability (intraday) and reproducibility (interday) of the results obtained by means of the proposed DPV procedure were examined and the results pointed out high accuracy and precision of the proposed procedure and proved to be appropriate for detecting Pb (II) ions in environmental water samples Table 2.
Table 2. Inter- and intra-day regression parameters of the p-ABSA/benzo-18-crown-6/CNTs modified PGE using DPV method for determination of Pb (II) ions
Interday Precision Intraday Precision
True Value µM Measured Value µM Recovery% ± RSD Measured Value µM Recovery% ± RSD
50 48.64 97.28± 0.0898 53.01 106.05 ±0.154
75 68.31 91.10± 0.0565 76.51 102.01 ± 0.021
100 97.82 97.82± 0.01 101.09 101.09 ± 0.0000000717
Prog. Chem. Biochem. Res. ARTICLE
2019, 2 (1): 24-33 | 31
3.7 Robustness
The robustness of the proposed method was studied under slightly changes of the chemical and experimental conditions as pH, scan rate and accumulation time. This experiment showed these small changes which did not significantly affect the performance of the proposed procedure. Table 3 shows the recovery values.
Table 3. Robustness of p-ABSA/benzo-18-crown-6/CNTs modified PGE. usng DPV for lead(II) determination
Parameter
Recovery% ± RSD* Standard conditions
pH
3.8 99.0 ± 0.00577 4.0 94.05 ± 0.016
Scan rate mV/s
85 98.3±0.017
95 99.32 ± 0.0104
Accumulation time sec
3 94.07±0.065
7 93.3 ± 0.063 *Each result is the average of three separate measurements.
3.8 Interference study
The interference effects of some heavy metals salts Zn (II), Fe (III), Cr (III), Cr (VI), Mn (VI) and Cu (II) ions that
can be found in water in addition to diluted acids and bases on the determinations of lead were investigated under the optimum conditions by recording differential pulse voltammograms in the presence of 0.10 mM lead. The results showed that those salts and the diluted acid and base did not significantly affect to the peak current.
3.9 Analytical Applications
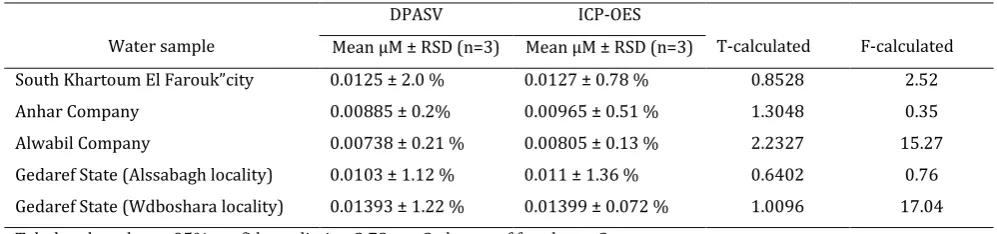
The electrochemical measurements were directly done to the water samples without any preparation steps. The proposed procedure was applied in a good way for detection of lead (II) in water samples utilizing the standard addition method with the optimized conditions as shown above. Since there was no information regarding the lead (II) content in the water samples, the concentration of lead (II) ions of each sample that was obtained by the proposed method DPASV using p-ABSA/Benzo-18-crown-6/CNTs modified PGE was statistically compared to the validated method ICP-OES using T and F tests Table 4, within confidence level 95%, by conventional criteria. The difference between the two methods is considered to be not statistically significant which indicated approximately similar accuracy and precision [29].
Table 4. Statistical comparison between the concentrations of lead (II) in water samples obtained using the proposed method (DPASV) and the ICP-OES method and T and F value
Water sample
DPASV ICP-OES
T-calculated F-calculated Mean µM ± RSD (n=3) Mean µM ± RSD (n=3)
South Khartoum El Farouk”city 0.0125 ± 2.0 % 0.0127 ± 0.78 % 0.8528 2.52
Anhar Company 0.00885 ± 0.2% 0.00965 ± 0.51 % 1.3048 0.35
Alwabil Company 0.00738 ± 0.21 % 0.00805 ± 0.13 % 2.2327 15.27
Gedaref State (Alssabagh locality) 0.0103 ± 1.12 % 0.011 ± 1.36 % 0.6402 0.76 Gedaref State (Wdboshara locality) 0.01393 ± 1.22 % 0.01399 ± 0.072 % 1.0096 17.04 Tabulated t-value at 95% confidence limit = 2.78, n = 3, degree of freedom = 2.
Tabulated F-value at 95% confidence limit = 19.0, n = 3.
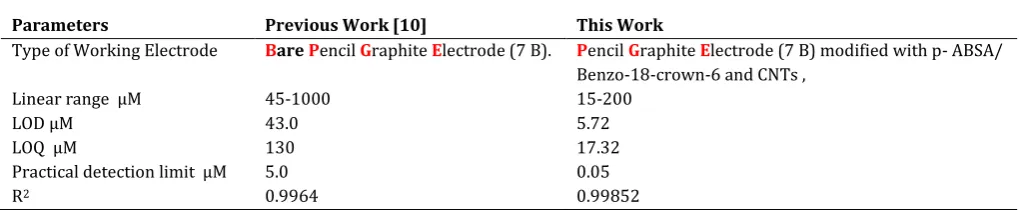
3.10 Comparison of the sensitivity of the proposed method and other previously reported method
Different techniques have been reported for the determination of Pb (II) ions in water samples [6-9]; the most simpler and popular ones are the voltammetric
Table 5. Comparison between Bare-Pencil Graphite and p-amino ABSA/ Benzene-18-crown-6/CNTs electrodes for determination Pb (II) ions in water samples.
Parameters Previous Work [10] This Work
Type of Working Electrode Bare PencilGraphiteElectrode (7 B). Pencil Graphite Electrode (7 B) modified with p- ABSA/ Benzo-18-crown-6 and CNTs ,
Linear range µM 45-1000 15-200
LOD µM 43.0 5.72
LOQ µM 130 17.32
Practical detection limit µM 5.0 0.05
R2 0.9964 0.99852
4. Conclusion
In the current study, the modifying PGE using p-ABSA, benzo-18-crown-s and multi-walled CNTs provides appropriate method to determine Pb (II) ions quantitatively in the environmental water samples according to the obtained results including; the sensor allows simple, sensitive and reproducible determination of Pb (II) ions over a linear range 15-200 µM without needing a complex sample manipulation. The electrode shows a good selectivity towards Pb (II) ions in the presence of other heavy metals ions. In addition, to a better detection limit about 5.7 µM and with fast response time less than 5 sec. as compared to the performance of bare PGE, the applicability of the proposed method was examined by determining the trace level of Pb (II) ions in the environmental water samples
Conflict of Interests
The authors declare that there is no conflict of interests regarding the publication of this paper.
Acknowledgements
The authors gratefully acknowledge Dr. Manal Siyam for analysis the samples by SEM in Naturkundi Museum Laboratories-Berlin-Germany.
5. References
[1] Ensafi A., Far A., Meghdadi S., Journal of Hazardous Materials, 2009, 172:1069
[2] Bellinger D., Current Opinion in Pediatrics, 2008, 20:172
[3] Chen A., Cai B., Dietrich K.N., Radcliffe J., Rogan W.J.,
Pediatrics, 2007, 119:650
[4] Lanphear B., Lanphear B.P., Hornung R., Khoury J., Yolton K., Baghurst P., Bellinger D.C., Canfield R.L., Dietrich K.N., Bornschein R., Greene T., Rothenberg S.J., Needleman
H.L., Schnaas L., Wasserman G., Graziano J., Roberts R.,
Environmental Health Perspectives, 2005, 113:894
[5] Tong S., Von Schirnding Y., Prapamontol T., Bull World Health Organ, 2000, 78:1068
[6] Fang Z., Guo T., Welz B., Talanta, 1991, 38:613
[7] Moor C., Lymberopoulou T., Dietrich V., Microchimica Acta, 2001, 136:123
[8] Todd A., Chettle D., Environmental Health Perspective, 1994, 102:172
[9] Longerich H., Fryer B., Strong D., Spectrochimica Acta B: Atomic Spectroscopy, 1987, 42:39
[10] Elobeid W.H., Elbashir A.A., EC Chemistry, 2018, 3:1 [11] González‐Calabuig A., Guerrero D., Serrano N., del Valle M., Electroanalysis, 2016, 28:663
[12] Grabarczyk M., Korolczuk M., Journal of Hazardous Materials, 2010, 175:1007
[13] Wang J., Stripping Analysis: Principles, Instrumentation and applications; VCH Publishers Inc: New York, 1985: p. 1-160
[14] Anandhakumar S., Mathiyarasu J., Microchimica Acta, 2013, 180:1065
[15] Iijima S., Nature, 1991, 354:56
[16] He X., Chen L.,Xie X.,Su Z.,Qin C.,Liu Y.,Ma M.,Yao S., Deng L.,Xie Q.,Tian Y.,Qin D.,Luo Y., Microchimica Acta, 2011,176:81
[17] Kerric G., Parra E.J., Crespo G.A., Xavier Rius F., Blondeau P., Journal of material chemistry, 2012, 22:16611
[18] Parra E.J., Blondeau P., Crespo G.A., Rius F.X.,
Chemical Communications, 2011, 47:2438
[19] Lou T., Pan D., Wang Y., Jiang L., Qin W., Analytical Letters, 2011, 44:1746
[20] Serrano N., Calabuig A., Valle M., Talanta, 2015, 138:130
[21] Huang Z., Kim S., Chang S., Bulletin of the Korean Chemical Society, 2006:27, 893
Prog. Chem. Biochem. Res. ARTICLE
2019, 2 (1): 24-33 | 33 [23] Zaib M., Athar M., International journal of
electrochemical science, 2015, 10:6690 [24] Martins I., Talanta, 2011, 15:85, 1
[25] Gosser D., Science and Reactivity of Inorganic and Metal Organic Chemistry, 2006, 24:1237
[26] Malagutti A., Mazo L., Journal of the Brazilian Chemical Society, 2003, 14:274
[27] Topic Q2 (R1). Validation of analytical procedures: Text and morphology, International Conference of Harmonization (ICH) (1996) 1994, 17 (2005)
[28] ICH-Q2A guideline for industry March. Text on validation of analytical procedures, 1995