1 | P a g e International journal of Advanced Biological and Biomedical Research (IJABBR)
Available online at http://www.ijabbr.com Volume 7, Issue 1 (2019) pp. 1-11
Research Article
Nutritional quality in rice grain and their relations to
grain morphological traits
Ravieh Heydari*, Nadali Bagheri, Nadali Babaeian Jelodar, Hamid Najafi
Zarrini
Department plant breeding, Sari Agricultural and Natural Resources University, Sari, Iran
9017014822
-Tel: +98 ,
avieh@yahoo.com hydarir
mail: -*Corresponding Author E
Received: 22 October 2018, Revised: 22 December 2018, Accepted: 23 December 2018 ABSTRACT
Cereal grains are mainly considered by consumers due to their effect on health and because of their antioxidant capacity, phenolic content and other phytochemicals. For this purpose, an experiment was conducted to evaluate of morphological and nutritional traits on 10 rice genotypes. Analysis of variance showed a significant difference among the genotypes for all traits. Onda, Gharib, Fajr and L2 genotypes had the highest ranks for nutritional quality. Also, the results showed that there existed a positive correlation between antioxidant capacity, phenolic content, soluble carbohydrate and Zn content, while there was the negative correlation between grain length and grain length to width ratio with the above traits. Thus, the nutritional quality could be indirectly selected based on grain length. PCA analysis resulted five components that determined 89.22% of the total variation, so that scatter plot based on the two first components, the genotypes of Onda, Fajr, Gharib and L2 which have smaller grain length, have better nutritional quality. Therefore, these genotypes can be used in breeding programs.
Key words: Rice, Antioxidant, Phenolic content, Fe and Zn content, principal component.
Introduction
2 | P a g e (Goffman and Bergman, 2004). The color of rice grain is positively correlated to the total phenolic and antioxidant capacity (Shen et al, 2009). Humans require at least 49 nutrients for their normal growth and development which among these nutrients, mineral elements such as Fe and Zn play numerous roles due to their direct or indirect effect in human metabolism (Garcia-Oliviera et al, 2008). In fact, two billion people worldwide suffer from micronutrient deficiencies, particularly in vitamin A, Fe and Zn (World Health Organization, 2007).Therefore, research has been undertaken to increase the micronutrient content in rice. The International Rice Research Institute is expected to release Fe-rich rice by the year 2029 to reduce Fe deficiency anemia in needy countries (Lau et al, 2015).
Shao et al (2011) studied the contents of phenolic and flavonoids in rice genotypes with different grain size. The smaller grains had higher phenolic content, flavonoid content and antioxidant capacity than the medium and larger grains. The phenolic content had positive correlation with the flavonoid content and antioxidant capacity. The phenolic and flavonoid content had negative correlation with grain length, grain length to width ratio and 100-grain weight, but had no correlation with grain width. They suggested new rice varieties with high antioxidant levels which could be obtained by being bred for extremely small grain rice. Study on total phenolic, flavonoid contents and antioxidant capacity from collection of rice germplasms were done, and their relations to grain color, grain size and 100-grain weight were investigated. Significant positive correlations were found among the phenolic, flavonoid contents and antioxidant capacity. Flavonoid contents had positive correlation to grain length and length to width ratio, and had negative correlation to the 100-grain weight. These relationships may serve as indexes to indirectly select breeding lines with high phenolic, flavonoids and antioxidant capacity. The results of this study may provide new opportunities for rice breeder's for production of rice with enhanced nutritional quality (Shen et al, 2009). 318 rice lines were to assess for variation in grain quality and to investigate relationships with morpho-physiological traits. Brown rice grain length ranged from 4.3 to 8.5 mm, grain width from 1.9 to 3.6 mm and grain length-to-width ratio from 1.3 to 4.0. Grain length was negatively correlated with grain width, indicating that selection for long grains would result in a negative response of grain width. These lines could be used as parents for introducing desired traits to current Indica cultivars grown in Europe (Koutroubas et al, 2004). Additionally, the interrelations among grain quality traits found in this study may be useful to understand the relationship among grain quality components. The objective of present study was grain nutritional quality variation and to compare with morphological traits for introduction better rice genotypes.
Materials and methods Rice materials
10 rice genotypes (Onda, Fajr, Gharib, L2, Sepidroud, Amol2, Tarom-anesh, Abjiboji, Tarom-sadri, and Musa-tarom) were cultivated in April of 2016 at Sari Agricultural Sciences and Natural Resources University, Iran in a randomized complete block design with three replications. After harvesting, being air-dried and stored at room temperature for three months, rice grains were evaluated.
Physical and morphological properties
3 | P a g e
Nutritional quality
Extraction methanolic extract
Brown rice flours (0.5 g) of each sample were extracted with 10 ml of 80% methanol for 24 h at room temperature. The methanolic extracts were centrifuged for 15 min and the supernatants were pooled and stored at 4°C (Shao et al, 2011).
Total antioxidant capacity (TAC)
The total antioxidant capacity was determined by DPPH radical scavenging activity (Molyneux, 2004) with UV VIS Spectrophotometer. Essay and speed DPPH radical scavenging activity method were usually used to measure the amount of antioxidants in cereal grains and crust of plant compounds (Chen et al, 2013). First, standard DPPH (0.1 mM) solution prepared. Then, 1.9 ml standard DPPH solution was added to 0.1 ml of extracts and mixed. The mixture stayed for 30 min at dark and room temperature. The absorbance read at 517 nm. Results were expressed as percent of extract DPPH radical scavenging by below Equation:
Total phenolic content (TPC)
The Folin-Ciocalteu colorimetric method was used to measure thetotal phenolic content (Bao et al, 2005). Briefly, 60 µl of the extractions were oxidized with 1 ml Folin-Ciocalteu reagent (diluted 1:10) and then reaction was neutralized with 1 ml of the saturated sodium carbonate (75 g/L). The absorbance of samples was measured at 760 nm with UV VIS Spectrophotometer, after incubation for 2 h at room temperature and dark. Quantification was done on the basis of the standard curve of gallic acid and results were expressed as mg of gallic acid equivalent (GAE) per 100 g of flour weight.
Total carotenoid content (TCC)
0.1 g of powdered rice grain mixed and homogenized with 2 ml 80% acetone solvent. Then, samples was centrifuge for 10,000 rpm for 15min. The supernatant were separated and reached in 2 ml with acetone solvent. The solution mixture was analyzed for carotenoid content by Spectrophotometer in absorbance 663.2, 646.8 and 470 nm (Lichtenthaler, 1987). Equations used for calculation are presented below (Sumanta et al, 2014). Results were expressed as µg/ml.
Total soluble and insoluble carbohydrates (TSC, TIC)
This measurement was performed by phenol-sulfuric acid assay, which is based on acidic hydrolysis of soluble carbohydrate and the formation of furfural compound that forms a color complex with a phenol (Kochert, 1978). In 0.1 g of samples in the test tube, we added 10 ml of 80% ethanol and allowed to stand at refrigerator for one week to release soluble sugars. Supernatant was used to measure the amount of soluble carbohydrate and deposits which were used for insoluble carbohydrate. After one week, the volume of 1 ml of supernatant separated reached to 2 ml with distilled water. Then, we added 1 ml 5% phenol and 5 ml 98% sulfuric acid. For measuring insoluble carbohydrate, first the deposit of samples were dried and, then, weighted. Then, to samples into test tube, we added 10 ml distilled water and allowed to stand for 15 min in bain-marie (boiling water). Afterwards, samples were filtered and their volumes reached to 25 ml. Finally, 2 ml of this solution was added to 1 ml 5% phenol and 5 ml 98% sulfuric acid. The absorbance of samples was measured at 485 nm with UV VIS Spectrophotometer. Quantification was done on the basis of the standard curve of glucose and results were expressed as mg of glucose (Glu) per 100 g of flour weight.
4 | P a g e
Fe and Zn contents
Fe and Zn contents of rice grain were determined by digestion method with dry burning and combination with hydrochloric acid in atomic absorption spectrometer (Waling et al, 1989). First, 0.5 g of each sample weighted to reach the standard in electric furnace for 5 h at 550 °C and converted to ash, then the ash was digested in 2N hydrochloric acid and their volumes reached to 50 ml with distilled water. Results are presented in below equation and are expressed as milligrams Fe and Zn per kilogram (ppm) of flour rice.
Where, C: element concentration in mg/kg (ppm), a: mg/L in test solution, v: final volume of solution in ml, d: dilution factor (if not diluted, d=1), m: sample weight in g, Dm: % dry matter of sample.
Statistical analysis
Statistical analysis such as analysis of variance (ANOVA) and means were performed using SAS 9.1. For ranking of genotypes according to mean traits was used from Arunachalam and Bandyopadhyay methods (Arunachalam and Bandyopadhyay, 1984). First, the rank of each genotype was determined based on the mean of each trait. The ranking in each trait was done with number of letters related to mean of the same trait. For example, if mean of trait had four letters from A to D, then, ranking of genotypes will be as follows: the letters A, B, C and D have rank 4, 3, 2 and 1. If a genotype has two letters, its rank will be average of the same two letters. Final, total rank of each genotype will be sum of its rank in different traits. Correlation analysis and principal component analysis of the results were performed in SPSS 16.
Result and Discussion
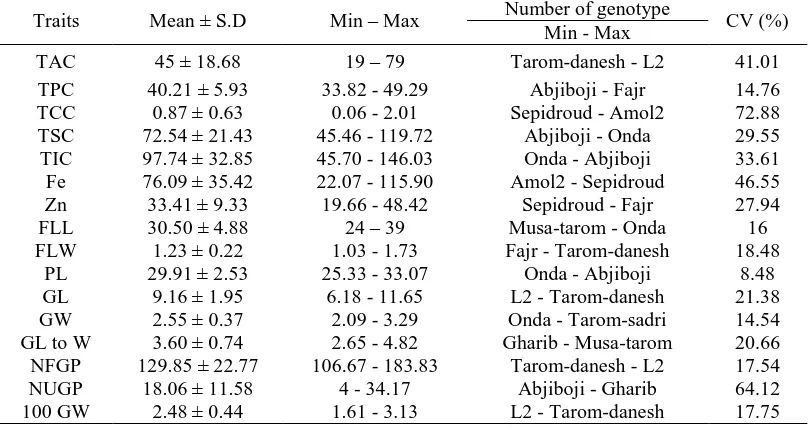
There was a wide variation among genotypes for all traits (Table 1). For traits such as GL ranged from 6.18 to 11.65 mm, GW from 2.09 to 3.29 mm and GL to W from 2.65 to 4.82. Mean values were 9.16 mm for GL, 2.55 mm for GW and 3.60 for GL to W. Selection for grain size and shape during the primary generations of a breeding program involved the determination of GL and GW. This process is time-consuming (Koutroubas et al, 2004). FLL ranged from 24 to 39 cm with mean value of 30.5 cm. FLW ranged from 1.03 to 1.73 cm with mean of 1.23 cm and PL ranged from 25.33 to 33.07 with a mean of 29.91 cm.
There was a wide range of variations in the TPC in rice grain (Table 1). TPC ranged from 33.82 to 49.29 mg GAE/100g, with mean of 40.21 mg GAE/100g. TCC in all rice genotypes ranged from 0.06 to 2.01 µl/ml with mean of 0.87 µl/ml. The TAC was measured using the DPPH assay. It was varied to a great extent, averaged 45%, ranging from 19 to 79% among the total rice genotypes. In the present study grain TSC and TIC ranged from 45.46 to 119.73 and 45.70 to 146.03 mg Glu/100g, with mean of 72.54 and 97.74 mg Glu/100g, respectively. The Fe ranged from 22.07 to 115.90 mg/Kg with mean of 76.09 mg/Kg and the Zn ranged from 19.66 to 48.42 mg/Kg with mean value of 33.41 mg/Kg. The studies have shown that the essential phytochemicals such as Phenolic, Flavonoids and antioxidant capacity and nutritional elements such as Fe and Zn in cereal grains, including rice, are significantly associated with reduced risk of developing diseases (Shen et al. 2009). Also, the highest percentage of diversity (CV %) was observed in traits TAC (41.01%), TCC (72.88%) and Fe (46.55%).
5 | P a g e (6.18 mm) and Onda (6.30 mm), and L2 (92.67) and Gharib (2.64), respectively. The highest NFGP and 100GW and the lowest NUGP had L2 (183.83), Onda (3.05) and Abjiboji (4) genotypes, respectively. The ranking of genotypes (Table 2) for morphological traits indicates that the highest rank was Tarom-danesh genotype and the lowest rank were L2 and Fajr genotypes.
Table 1. Statistical properties of traits in rice genotypes
CV (%) Number of genotype
Min – Max Mean ± S.D
Traits
Min - Max
41.01 Tarom-danesh - L2
19 – 79 45 ± 18.68
TAC
14.76 Abjiboji - Fajr
33.82 - 49.29 40.21 ± 5.93
TPC
72.88 Sepidroud - Amol2
0.06 - 2.01 0.87 ± 0.63
TCC
29.55 Abjiboji - Onda
45.46 - 119.72 72.54 ± 21.43
TSC
33.61 Onda - Abjiboji
45.70 - 146.03 97.74 ± 32.85
TIC
46.55 Amol2 - Sepidroud
22.07 - 115.90 76.09 ± 35.42
Fe
27.94 Sepidroud - Fajr
19.66 - 48.42 33.41 9.33 ±
Zn
16 Musa-tarom - Onda
24 – 39 30.50 ± 4.88
FLL
18.48 Fajr - Tarom-danesh
1.03 - 1.73 1.23 ± 0.22
FLW
8.48 Onda - Abjiboji
25.33 - 33.07 29.91 2.53 ±
PL
21.38 L2 - Tarom-danesh
6.18 - 11.65 9.16 ±1.95
GL
14.54 Onda - Tarom-sadri
2.09 - 3.29 2.55 ± 0.37
GW
20.66 Gharib - Musa-tarom
2.65 - 4.82 3.60 ± 0.74
GL to W
17.54 Tarom-danesh - L2
106.67 - 183.83 129.85 ± 22.77
NFGP
64.12 Abjiboji - Gharib
4 - 34.17 18.06 ±11.58
NUGP
17.75 L2 - Tarom-danesh
1.61 - 3.13 2.48 0.44 ±
100 GW
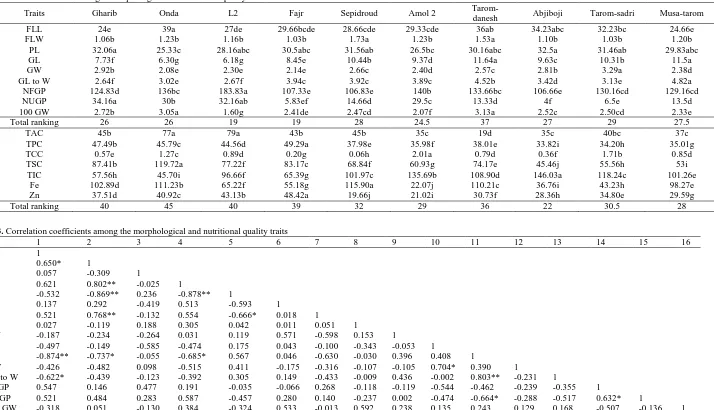
Mean of nutritional quality (Table 2) indicates that the small grain of Fajr and Gharib had the TPC of 49.29 mg GAE/100g and 47.49 mg GAE/100g, respectively. The rice Abjiboji with large grains had the lowest TPC (33.82 mg GAE/100g). The Tarom-danesh genotype had the lowest TAC (19%), and the L2 and Onda had the highest TAC (79% and 77%, respectively). The Fe among these samples varied from 22.07 mg/Kg (ppm) (Amol2 genotype) to 115.90 mg/Kg (ppm) (Sepidroud genotype). The Zn varied from 48.42 mg/Kg (Fajr genotype) to 19.66 mg/Kg (Sepidroud genotype), too. The highest TSC and the lowest TIC was Onda (119.72 mg GLU/100g and 45.70 mg GLU/100g, respectively). The lowest TSC and the highest TIC was Abjiboji (45.46 mg GLU/100g and 146.03 mg GLU/100g, respectively). The ranking of genotypes (Table 2) showed that Onda (45), Gharib and L2 (40) and Fajr (39) had the highest ranks for all nutritional quality. The lowest ranks were for Abjiboji (22), Musa-tarom (28) and Amol2 (29).
Shao et al. (2011) reported the contents of phenolic and flavonoids in different rice genotypes with different grain size. They expressed the phenolic content, flavonoid content and antioxidant capacity in small grains (100.7 mg GAE/100g, 182.6 mg RE/100g and 323.88 µM TEAC/100g, respectively) had higher than the larger grains (42.57 mg GAE/100g, 62.1 mg RE/100g and 230.1 µM TEAC/100g, respectively). The phenolic content and antioxidant capacity of brown rice are higher than the milled rice (Butsat and Siriamornpun, 2010). Shen et al (2009) reported the wider variations of phenolic content, flavonoid content and antioxidant capacity among 423 white rice. To date, rare reports focused on the grain size and its relation to the phytochemicals and antioxidant capacity in Iran.
Correlation analysis
6 | P a g e (r=0.802) and Zn (r=0.768) and significant negative correlation to insoluble carbohydrate (r=-0.869) and grain length (r=-0.737). The negative correlations between phenolic content and grain length, antioxidant capacity and grain length and also positive correlation between antioxidant capacity and phenolic content reported by Shao et al, (2011), Jin et al, (2009) and Zhang et al, (2010). The total soluble carbohydrate and insoluble carbohydrate had significant negative correlation (r=-0.878), also soluble carbohydrate had negative correlation with grain length (r=-0.685) and the correlation of between insoluble carbohydrate and Zn was negative (r=-0.666). There is no report on the association and correlation between Zn and insoluble carbohydrate, soluble carbohydrate and grain length. The correlations of other traits are shown in Table 3.
7 | P a g e Table 2. Mean and ranking of morphological and nutritional quality traits
Traits Gharib Onda L2 Fajr Sepidroud Amol 2
Tarom-danesh Abjiboji Tarom-sadri Musa-tarom
FLL 24e 39a 27de 29.66bcde 28.66cde 29.33cde 36ab 34.23abc 32.23bc 24.66e
FLW 1.06b 1.23b 1.16b 1.03b 1.73a 1.23b 1.53a 1.10b 1.03b 1.20b
PL 32.06a 25.33c 28.16abc 30.5abc 31.56ab 26.5bc 30.16abc 32.5a 31.46ab 29.83abc
GL 7.73f 6.30g 6.18g 8.45e 10.44b 9.37d 11.64a 9.63c 10.31b 11.5a
GW 2.92b 2.08e 2.30e 2.14e 2.66c 2.40d 2.57c 2.81b 3.29a 2.38d
GL to W 2.64f 3.02e 2.67f 3.94c 3.92c 3.89c 4.52b 3.42d 3.13e 4.82a
NFGP 124.83d 136bc 183.83a 107.33e 106.83e 140b 133.66bc 106.66e 130.16cd 129.16cd
NUGP 34.16a 30b 32.16ab 5.83ef 14.66d 29.5c 13.33d 4f 6.5e 13.5d
100 GW 2.72b 3.05a 1.60g 2.41de 2.47cd 2.07f 3.13a 2.52c 2.50cd 2.33e
Total ranking 26 26 19 19 28 24.5 37 27 29 27.5
TAC 45b 77a 79a 43b 45b 35c 19d 35c 40bc 37c
TPC 47.49b 45.79c 44.56d 49.29a 37.98e 35.98f 38.01e 33.82i 34.20h 35.01g
TCC 0.57e 1.27c 0.89d 0.20g 0.06h 2.01a 0.79d 0.36f 1.71b 0.85d
TSC 87.41b 119.72a 77.22f 83.17c 68.84f 60.93g 74.17e 45.46j 55.56h 53i
TIC 57.56h 45.70i 96.66f 65.39g 101.97c 135.69b 108.90d 146.03a 118.24c 101.26e
Fe 102.89d 111.23b 65.22f 55.18g 115.90a 22.07j 110.21c 36.76i 43.23h 98.27e
Zn 37.51d 40.92c 43.13b 48.42a 19.66j 21.02i 30.73f 28.36h 34.80e 29.59g
Total ranking 40 45 40 39 32 29 36 22 30.5 28
Table 3. Correlation coefficients among the morphological and nutritional quality traits
Traits 1 2 3 4 5 6 7 8 9 10 11 12 13 14 15 16
1. TAC 1
2. TPC 0.650* 1
3. TCC 0.057 -0.309 1
4. TSC 0.621 0.802** -0.025 1
5. TIC -0.532 -0.869** 0.236 -0.878** 1
6. Fe 0.137 0.292 -0.419 0.513 -0.593 1
7. Zn 0.521 0.768** -0.132 0.554 -0.666* 0.018 1
8. FLL 0.027 -0.119 0.188 0.305 0.042 0.011 0.051 1
9. FLW -0.187 -0.234 -0.264 0.031 0.119 0.571 -0.598 0.153 1
10. PL -0.497 -0.149 -0.585 -0.474 0.175 0.043 -0.100 -0.343 -0.053 1
11. GL -0.874** -0.737* -0.055 -0.685* 0.567 0.046 -0.630 -0.030 0.396 0.408 1
12. GW -0.426 -0.482 0.098 -0.515 0.411 -0.175 -0.316 -0.107 -0.105 0.704* 0.390 1
13. GL to W -0.622* -0.439 -0.123 -0.392 0.305 0.149 -0.433 -0.009 0.436 -0.002 0.803** -0.231 1
14. NFGP 0.547 0.146 0.477 0.191 -0.035 -0.066 0.268 -0.118 -0.119 -0.544 -0.462 -0.239 -0.355 1
15. NUGP 0.521 0.484 0.283 0.587 -0.457 0.280 0.140 -0.237 0.002 -0.474 -0.664* -0.288 -0.517 0.632* 1
16. 100 GW -0.318 0.051 -0.130 0.384 -0.324 0.533 -0.013 0.592 0.238 0.135 0.243 0.129 0.168 -0.507 -0.136 1
8 | P a g e
Principal component analysis (PCA)
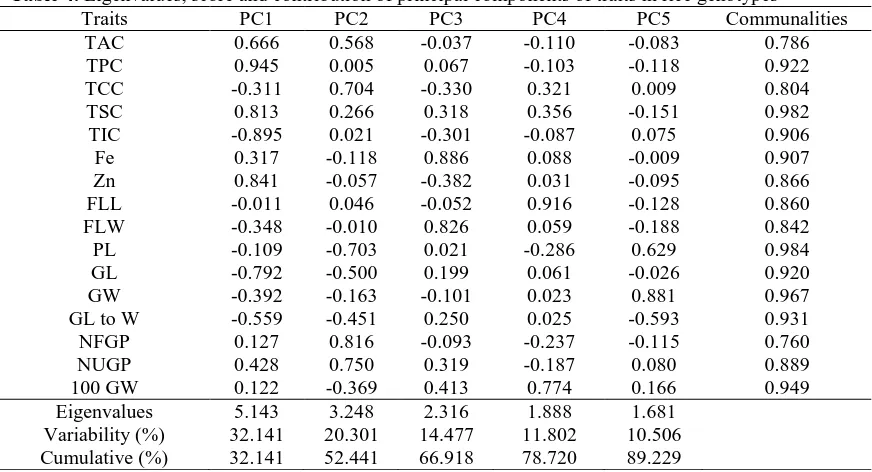
The result of the PCA showed genetic diversity of rice genotypes. The cumulative variance of 89.22% (Table 4) by the first components five with Eigenvalue>1 indicates that traits exhibited great influence. The communalities are a part of variance of a variable that is related to common factors. The high commonalities indicate the more accurate estimation of the variance of the related variable. The first principal component accounted 23.14% of total variance, where by TAC, TPC, TSC and Zn were contributed positive scores and TIC, GL and GL to W were contributed negative scores. The second principal component accounted 20.30% of total variance, in which the TAC, TCC, NFGP and NUGP contributed positively. The third component accounted 14.47% of total variance. The Fe and FLW were variables with contributing positively. Fourth component accounted 11.80% of total variation. The FLL and 100GW contributed positively. The fifth principal component accounted 10.50% of total variance with variables PL and GW. Mahendran et al, (2015) was used principal component to determine relationship among 293 rice germplasm accessions. In this study, the first five components accounted 77.38% of total variance.
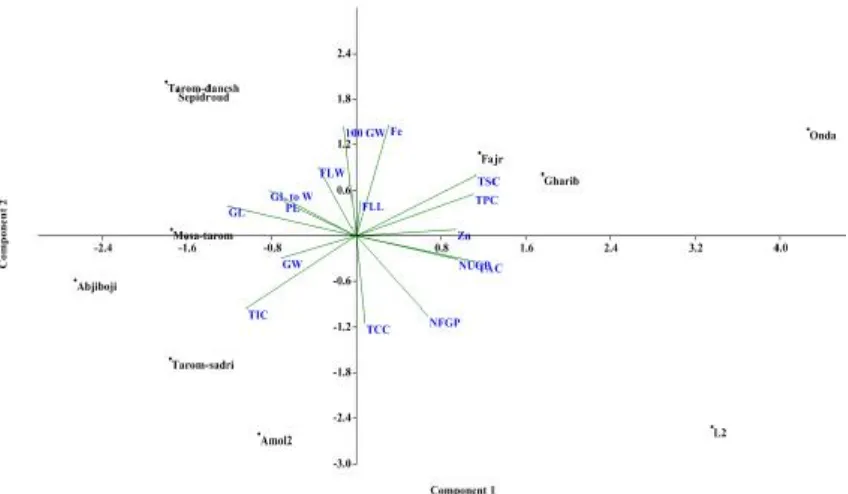
A scatter plot was drown between PC1 and PC2 that indicates the suitable grouping of genotypes based on traits, that including Onda, Gharib, Fajr and L2. All the genotypes were widely scattered across quarters (Fig. 1). Guei et al, (2005) suggested that the first three principal component are the most important in variation patterns of genotypes. Finally, on the basis of the three main components, the genotypes of Onda, Fajr, Gharib and L2 were best known.
9 | P a g e Table 4. Eigenvalues, score and contribution of principal components of traits in rice genotypes
Traits PC1 PC2 PC3 PC4 PC5 Communalities
TAC 0.666 0.568 -0.037 -0.110 -0.083 0.786
TPC 0.945 0.005 0.067 -0.103 -0.118 0.922
TCC -0.311 0.704 -0.330 0.321 0.009 0.804
TSC 0.813 0.266 0.318 0.356 -0.151 0.982
TIC -0.895 0.021 -0.301 -0.087 0.075 0.906
Fe 0.317 -0.118 0.886 0.088 -0.009 0.907
Zn 0.841 -0.057 -0.382 0.031 -0.095 0.866
FLL -0.011 0.046 -0.052 0.916 -0.128 0.860
FLW -0.348 -0.010 0.826 0.059 -0.188 0.842
PL -0.109 -0.703 0.021 -0.286 0.629 0.984
GL -0.792 -0.500 0.199 0.061 -0.026 0.920
GW -0.392 -0.163 -0.101 0.023 0.881 0.967
GL to W -0.559 -0.451 0.250 0.025 -0.593 0.931
NFGP 0.127 0.816 -0.093 -0.237 -0.115 0.760
NUGP 0.428 0.750 0.319 -0.187 0.080 0.889
100 GW 0.122 -0.369 0.413 0.774 0.166 0.949
Eigenvalues 5.143 3.248 2.316 1.888 1.681
Variability (%) 32.141 20.301 14.477 11.802 10.506
Cumulative (%) 32.141 52.441 66.918 78.720 89.229
Conclusion
Genotypes of Onda, Gharib, Fajr and L2 had the high total phenol content and Zn and also had the low insoluble carbohydrate and grain length. These genotypes based on the studied traits had the high ranks (Table 2) to other genotypes. The results showed the positive correlation between nutritional quality and negative correlation between morphological traits (grain length and grain length to width ratio) and nutritional quality.
Acknowledgments
The authors are highly grateful to the biotechnology laboratory of Sari Agricultural Sciences and Natural Resources University for providing all necessary supports.
References
Arunachalam, V and Bandyopadhyay, A. (1984). A method to make decisions jointly on a number of dependent characters. The Indian Journal of Genetics and Plant Breeding, 44(3):419-424.
Bao, J., Cai, Y., Sun, M., Wang, G and Corke, H. (2005). Anthocyanins, flavonols, and free radical scavenging activity of Chinese bayberry (Myrica rubra) extracts and their color properties and stability. Journal of Agricultural and Food Chemistry, 53(6):2327-2332.
Butsat, S and Siriamornpun, S. (2010). Antioxidant capacities and phenolic compounds of the husk, bran and endosperm of Thai rice. Food Chem, 119:606-613.
Chen, Z., Bertin, R and Froldi, G. (2013). EC 50 estimation of antioxidant activity in DPPH assay using several statistical programs. Food Chemistry, 138(1): 414-420. Fitzgerald, M.A., Mc-Couch, S.R and Hall, R.D. (2009). Not just a grain of rice: the quest for quality. Trends in plant science, 14(3):133-139.
10 | P a g e
Garcia‐Oliveira, A.L., Tan, L., Fu, Y and Sun, C. (2008). Genetic identification of quantitative trait loci for contents of mineral nutrients in rice grain. Journal of Integrative Plant Biology, 51(1):84-92.
Goffman, F.D and Bergman, C.J. (2004). Rice kernel phenolic content and its relationship with antiradical efficiency. Journal of the Science of Food and Agriculture, 84(10):1235-1240.
Guei, R.G., Sanni, K.A and Fawole, A.F.J. (2005). Genetic diversity of rice (Oryza sativa). Agron Africaine, 5:17–28.
Jin, L., Xiao, P., Lu, Y., Shao, Y., Shen, Y and Bao, J. (2009). Quantitative trait loci for brown rice color, phenolics, flavonoid contents, and antioxidant capacity in rice grain. Cereal chemistry, 86(6): 609-615.
Kochert, A.G. (1978). Carbohydrate determination by the phenol-sulfuric acid method. In: Helebust, J.A., Craigie, J.S. (eds) handbook of physiological methods: Physiological and biochemical methods, Cambridge University Press, Cambridge, pp 95-97.
Koutroubas, S.D., Mazzini, F., Pons, B and Ntanos, D.A. (2004). Grain quality variation and relationships with morph-physiological traits in rice (Oryza sativa L.) genetic resources in Europe. Field Crops Research, 86(2):115-130.
Lau, W.C., Rafii, M.Y., Ismail, M.R., Puteh, A., Latif, M.A and Ramli, A. (2015). Review of functional markers for improving cooking, eating, and the nutritional qualities of rice. Frontiers in plant science, 6:1-11.
Lichtenthaler, H.K. (1987). Chlorophylls and carotenoids: pigments of photosynthetic bio membranes. In Methods in enzymology, 148:350-382.
Liu, R.H. (2007). Whole grain phytochemicals and health. Journal of Cereal Science, 46(3): 207-219.
Mahendran, R., Veerabadhiran, P., Robin, S and Raveendran, M. (2015). Principal component analysis of rice germplasm accessions under high temperature stress. International Journal of Agricultural Science and Research, 5(3):355-359.
Molyneux, P. (2004). the use of the stable free radical diphenylpicrylhydrazyl (DPPH) for estimating antioxidant activity. Songklanakarin J Sci Technol, 26(2): 211-219.
SES, (2013). Standard Evaluation System for rice. International Rice Research Institute (IRRI), Manila, Philippines.
Shao, Y., Gan, Z and Jinsong, B. (2011). Total phenolic content and antioxidant capacity of rice grains with extremely small size. African Journal of Agricultural Research, 6(10):2289-2293.
Shen, Y., Jin, L., Xiao, P., Lu, Y and Bao, J. (2009). Total phenolics, flavonoids, antioxidant capacity in rice grain and their relations to grain color, size and weight. Journal of Cereal Science, 49(1):106-111.
11 | P a g e
Sumanta, N., Haque, C.I., Nishika, J and Suprakash, R. (2014). Spectrophotometric analysis of chlorophylls and carotenoids from commonly grown fern species by using various extracting solvents. Research Journal of Chemical Sciences, 4(9):63-69.
Tan, Y.F., Xing, Y.Z., Li, J.X., Yu, S.B., Xu, C.G and Zhang, Q. (2000). Genetic bases of appearance quality of rice grains in Shanyou 63, an elite rice hybrid. TAG Theoretical and Applied Genetics, 101(5):823-829.
Waling, I., Van Vark, W., Houba, V.J.G and Van der lee, J.J. (1989). Soil and plant analysis, a series of syllabi. Plant Analysis Procedures, Wageningen Agriculture University.
World Health Organization. (2007) Preventing and Controlling Micronutrient Deficiencies in Populations Affected by an Emergency. Geneva: Joint Statement by the World Health Organization, the World Food Programme and the United Nations Children’s Fund. Available at: http://who.int/nutrition/publications/WHO_WFP_UNICEFstatement.pdf accessed 17 March 2015.
Yawadio, R., Tanimori, S and Morita, N. (2007). Identification of phenolic compounds isolated from pigmented rices and their aldose reductase inhibitory activities. Food Chemistry 101(4): 1616-1625.
Zhang, M.W., Zhang, R.F., Zhang, F.X and Liu, R.H. (2010). Phenolic profiles and antioxidant activity of black rice bran of different commercially available varieties. J Agric Food Chem, 58:7580-758.
Howtocitethisarticle: Ravieh Heydari, Nadali Bagheri, Nadali Babaeian Jelodar,
Hamid Najafi Zarrini, Nutritional quality in rice grain and their relations to grain morphological traits. International Journal of Advanced Biological and Biomedical Research, 2019, 7(1), 1-11. http://www.ijabbr.com/article_33589.html