Corresponding Author: Mime Azrina Binti Jaafar, Department of Information Technology & Communication, Politeknik Tuanku Syed Sirajuddin, Pauh Putra, 02600 Arau, Perlis, Malaysia., +604-9886200
33
Journal of Social Science and Humanities, 1 (3): 33-39, 2018 e-ISSN: 2600 - 9056
© RMP Publications, 2018 DOI: 10.26666/rmp.jssh.2018.3.5
IR 4.0 Readiness: Big Data Sources, Issues and Challenges
Mime Azrina Jaafar
1, Husniza Husni
2, Yuhanis Yusof
3 1Department of Information Technology & Communication, Politeknik Tuanku Syed Sirajuddin, Pauh Putra, 02600 Arau, Perlis, Malaysia.
2,3
School of Computing, Universiti Utara Malaysia, 06010 Sintok, Kedah, Malaysia
Abstract: Industry revolution 4.0 (IR 4.0) is focus on transforming all individual processes in computing. Data digitalization in IR 4.0 allows production to monitor performance, workflow, management of all machines and access company record remotely using diversity of electronic and smart devices like smart phones, tablets, laptops, TVs and smart watches. Yet, preparing IR 4.0 platform in an industry is very challenging and requires management to prepare all the nine IR 4.0 components including Big Data. Big Data has been leads from tremendous growth of data directed from the increasing number of communication devices every day. This data perceives meaningful information that can be utilized by the industry to improve their product quality, sales and services. Mostly, Big Data was aligned in unstructured format and entails expertise and powerful facilities to decode them. Hence, a questionnaire has been distributed to 29 respondents which represent IT educators at PTSS to measure their readiness toward IR 4.0 in the aspect of Big Data sources, issue and challenges. This study has proven that there were variety of data sources can be accessed for data analytic but private data might cause limitation in data gathering process as it required access rights from data owner. Therefore, encouraging data sharing between organizations and staffs would create new ideas and opportunities for future research on Big Data.
Key words: IR 4.0, Big Data, Unstructured Data, Visualization
INTRODUCTION
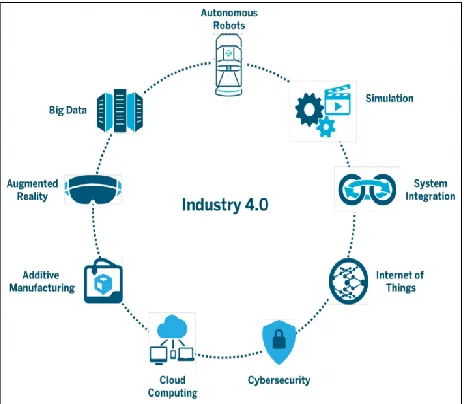
IR 4.0 represents the forth industrial revolution that incorporates digital technology as a gist in transforming economies, jobs and society [1]. All sectors including manufacture, education, economy and even government try to comply with the IR 4.0 needs by introducing vary approaches such as digitizing their data using automated system, improving data management using virtual cloud storage, Internet of thing (Iot), robotic element in manufacturing to support massive production of quality products and smart classroom to generate better teaching and learning environment. Preparation of high speed network compulsory to help user monitor their house, company or family member status effectively using digital technology such as mobile phone, CCTV and smart gadgets. Besides, in the perspective of businesses, the revolution welcomes a lot of opportunities and generates outstanding profit for the organization. As for the government, strong support in digitalization has been provided by most of the countries like Denmark: Innovation Fund, South Korea: Technology & Innovation, Chine: Internet Plus & Made in China 2025, Thailand: 4.0 Start-ups, Singapore:
Industry Transformation Programme, Italy: Italia 4.0 Plan and Malaysia: IR 4.0 [2].
34 Fig 1 Elements in IR 4.0
Big Data is the main concern of this study since social media such as blog, tweeter and Facebook have generated vast amount of data. Surprisingly, figure 2 shows that only 24% of the data has been use as primary resource and half of the data still remain unused. It is such a waste because, in social media like Facebook, there are about 800 million user registered and another billion of page views every day [5] and these data can be utilize and use to solve so many problems especially to solve globalization issues such as diseases including HIV, heart diseases, cancers and obesities.
Fig 2 Big Data Taxonomy
RELATED WORK
The Big Data has been one of the current and future research frontiers [6]. The terms Big Data used to
describe the massive size of data available in various data sources. It creates a new phenomenon in today world due to the intensively growth of digital data exchanged on internet [7]. It is right to say that big data will revolutionize in many fields [6] as the magnitude of data generated and shared by various sectors including businesses, public administration numerous industrial and not-to-profit sectors, and scientific research has increase immeasurably [8]. Approximately, around 35 [9] to 40 [10] zettabytes of data produce, imitated and consumed annually in 2020. Managing big size of data is not an easy process as it may requires new technique and software tools. This issue has been highlighted by Verma, Agrawal, Patel & Patel [11] in their study that clarified that the huge size of data make it difficult for common used software tools to create, manage and process data within suitable time. The enthusiasm and concerned for the Big Data has encourages a lot researchers and entrepreneurs to find solutions [12] on emerging big data aspect in their practices. Understanding the big data concepts is a first step need to be taken by all big data practitioner to receive overall ideas, trend and implementation of big data in current business processes and technologies.
35 Fig 3 Enterprise perceptions on the advantages of Big Data
DATA COLLECTION
Sample
Sample for this study were taken from all lecturers in ICT department at PTSS. ICT lecturers have been chosen for the research sample as the Big Data is close related to ICT environment and most of lecturers have undergo some exposure on Big Data as compared to other department. Totally there are 32 lecturers and a Head of Department. A questionnaire has been distributed to each of the respondent to collect their opinion on Big Data sources, issues and challenges faced by the ICT department in order to support the evolution of IR 4.0.
Questionnaire
Questionnaire by Big Data Europe [16] has been adapted for this study. The questionnaire has been translated into Malay language to improve respondents understanding on the research topic. This questionnaire covered three important sections A, B and C. Section A consists of 3 questions to represent respondent background. Section B was contented with 4 sub sections which covered information on devices (3 questions), data sources (1 question), issues (1 question), Big Data Analytic (3questions) and Big Data culture in organization (3 questions). Section C on the other hand is more focuses on identifying challenges Big Data management (1 question). Due to some circumstances, the questionnaires can only being distributed to 29 respondents and the response rate is 100%.
Statistical Analysis
The Statistical Product and Service Solutions (SPSS) version 18 software has been used to assist the analysis process. A pilot test was conducted on the questionnaire and the result returned high reliability coefficient of Cronbach’s alpha (α) which is 0.837.The
collected data were then being analyzed and represented in percentage (%) form. This detail result will be further discussed in the next section.
FINDING AND DISCUSSION
Result of this study was aligned in 3 sections. The first section represents respondents’ background. For this section, respondents’ age, gender and working experience will be justified and discussed. In the second section, organization behavior like availability of data communication devices, data sharing culture and Big Data sources will clearly deliberate. Section 4 and section 5 on the other hand will highlight some issues and challenges on Big Data management which might trigger limitation in existing Big Data research.
Respondents’ Background
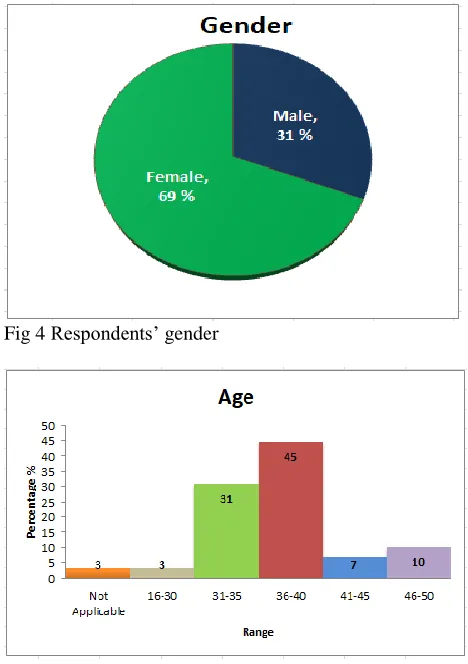
In this research, 29 respondents were given the questionnaire and the distributions of the groups are 69% female and 31% male. The percentage was generated from 20 female and 9 male lecturers in ICT department at PTSS as shown in Figure 4. The result is more dominated toward female lecturers’ perception instead of consensus option from both female and male groups.
Fig 4 Respondents’ gender
36
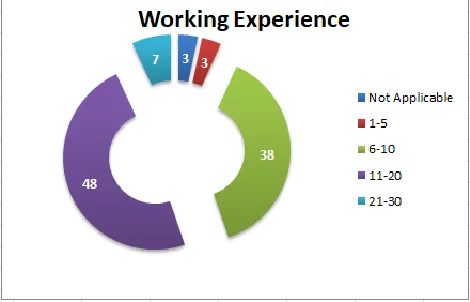
Figure 5 shows the respondent’s age for all the 29 lecturers. Most of the respondents which covers 49% are between 36-40 years olds, followed by 31% respondents who are ages between 31-35. Percentage for the third, forth and fifth group of respondents age are 46-50, 41-45 and 16-30 years old with the percentange of 10%, 7% and 3% accordingly. Only 3% of the respondents did not respond which is classified as not applicable. It shows that majority of the feedback for this study was collected from middle ages generation as 76% of the respondents’ age between 31-40.
Fig 6 Respondents’ working experience
This paper is focused just on ICT lecturers at Tuanku Syed Sirajuddin Polytechnic. As in Figure 6, majority of the staff (49%) had worked at this Polytechnic around 11-20 years old followed by staff who worked for 6-10 years old with the distribution of 38%. There is only 7% who worked more than 21 years old which makes these staff a senior staffs. Minority of the staff is for the one who had only 1-5 years of experience. Due to the variety of working experience between the staff, this paper will try to investigate the exposure of staff on big data in Polytechnic. The following Figures (Figure 7-Figure 11) will discussed on big data and its related topics.
Organization Behavior
Fig 7 Data sharing culture in organization
The study shows that this organization provides comprehensive environment for data sharing among the staffs. Approximate more than 50% of data was shared intensively but the size is in slightly different. There are similarity opinion for the data size between 41-60%, 61-90% and >90%. This three data size generate 27.6% of response rate and only 17.2% represent 10-40%. Most of the data were share online(68.9%) because online data sharing allows user to access the data anytime and at any places.
Since the scope is on Department of Information Technology and Communication and technology and communication is the main focus here, devices used by staff will be investigated. There are 9 devices has been identified which covers from smart phone, laptop/notebook, desktop computer, smart TV, Tab/Ipad, CCTV, wireless/network printer, and wireless headset/ speakers. From the feedback gathered, it is shown that 100% of the respondents owned smart phones. This is due to the facts that based on Statistica [17] smart phones are widely being used in communication and data sharing. 90% of the respondents owned laptops or notebooks and 79% owned desktop computer. The third and fourth most owned devices are network/wireless printers and Tab/Ipad with 41% and 35%. On average, each respondent has around 4 devices that they use in their daily life.
Fig 8 Data communication devices owned by the respondents
37 Fig 9 Big Data sources used by the respondents
This study also tries to identify the main Big Data sources used by the respondents to analyse data. It can be summarized that the top five Big Data sources which are mostly being accessed by the respondents are Web Pages, Social Media, Email, Questionnaire and Audio and the top five least frequent Big Data sources are Satellite, Sensor, Geospatial, Open data and Transaction. Web Page received highest response rate (90%) while satellite and sensor receive lowest (28%). The complexity of satellite and sensor data requires powerful devices and expertise to record and analyse them. Therefore, certain amount of cost is needed for the researchers to upscale their analytic skills and to prepare their Big Data facilities.
Issues in Big Data
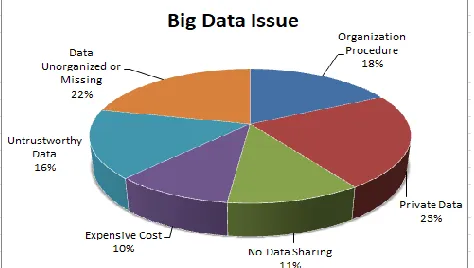
Figure 10 shows the issues faced by the respondents when accessing big data. The main issue of big data is the data is private data (23%). Not all data is available to be downloaded to the users. The second issue is that, since big data covers a large amount of data, the data is unorganized, unstructured or missing (22%). It is also inconvenient for the researchers to use existing analytic technique to process the unstructured and massive size of data. The third issue gathered from respondents feedback is 18% of the responded stated that organization procedure is complicated in accessing big data. 16% of the respondent stated that big data normally covers untrustworthy data which is insecure to be used. The last two issues stated by the respondents are big data normally involves expensive cost in getting and analysing the data and since big data is private, it is not frequently share in the Internet. The percentages of feedback for these two issues are 10% and 11%.
Fig 10 Issues faced by the respondents when accessing Big Data
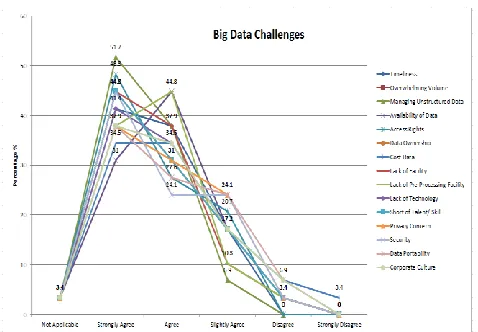
Big Data Challenges
38 Fig 11 Challenges faced by the respondents for managing Big Data
CONCLUSION
Everyday massive size of data has been transferred online by variety of communication devices. This study proven that each user held multiple devices for data communication. The increasing number of devices make the data grows tremendously. This data create meaningful information which may represent user behavior, interest, social networking, market trend and knowledge. However, complex structure and humongous size of the data make them being neglected, unable to process and cannot be visualized using conventional data processing technique and tools. Data privacy is the main issue in Big Data processing and requires further discussion and solution from organizations all over the world. Availability of data may benefits a lot of sectors like education, medical, financial, businesses and communication to improve their product quality and increase their profit. As for the industry, discussion on the challenges of Big Data would help them to recognize important elements for preparing Big Data analytic environment in order to support data digitizing for IR 4.0.
In the future, Big Data researchers should focus on the Big Data visualization feature. Data visualization is graphical model that can be used to represent data in systematic way. Result from data analytic process can be presented to user using variety of model like word cloud, parallel coordinate, heatmap and network diagram. Yet, some of the diagram like word cloud encountered issue like missing of word context which is very important aspect to dissolve ambiguities, clarify meanings or point out relations. Therefore, study on this area would be able to improve existing Big Data analytic especially in presenting the final result to the user to support their decision making process.
REFERENCES
[1]Renjen, P. 2018. Industry 4.0: Are you ready? Retrieved from https://www2.deloitte.com/insights/
us/en/deloitte-review/issue-22/industry-4-0-technology-manufacturingrevolution.html
[2]Nainy, R. 2017. Industry 4.0 and its implication to SMEs. Retrieved from http://www.miti.gov.my/ miti/resources/Industry4Point0/SMECorp_Industry _4_and_Implications_to_SMEs.pdf
[3]Badaraite, Z. 2016. Welcome to the future: Industry 4.0. Retrieved from https://www.hylasoft.com/en/ posts/welcome-to-the-future-industry-4-0
[4]Deloitte (2015).Industry 4.0: Challenges and solutions for the digital transformation and use exponential technologies. Retrieve from https://www2.deloitte.com/content/dam/Deloitte/ch/ Documents/manufacturing/ch-en-manufacturing-industry-4-0-24102014.pdf
[5] Bagheri, H. Shaltooki, A. A. 2015. Big data: Challenges, opportunities and cloud based solutions. International Journal of Electrical and Computing Engineering, 5(2), 340-343.
[6] Chen, C. L. P. & Zhang, C. Y. 2014. Data-intensive applications, challenges, techniques and technologies: A survey on big data. Journal of Information Sciences, 275, 314-347.
[7] Shinde, P. P. 2017. Big Data Analysis Solutions: A Review. Journal of Advances in Science & Technology, 13(1), 325-328.
[8] Agarwal, R. & Dhar, V. 2014. Editorial—Big Data, Data Science, and Analytics: The Opportunity and Challenge for IS Research. Information Systems Research, 25(3), 443-448.
[9] Nasser, T & Tariq, R. S. 2015. Big data challenges. Journal of Computer Engineering & Information Technology, 4(3), 1-10.
[10] Turner, V., Gantz, J.F., Reinsel, D. & Minton, S. 2014. The Digital Universe of Opportunities: Rich Data and the Increasing Value of the Internet of Things, IDC Analyze the Future [online] http://idcdocserv.com/1678.
[11] Verma, J. P., Agrawal, S., Patel, B. & Patel, A. (2016). Big data analytics: Challenges and applications for text, audio, video, and social media data. International Journal on Soft Computing, Artificial Intelligent and Applications, 5(1). 41-51. [12] Caldarola, E. G. & Rinaldi, A. M. 2017. Big Data
Visualization Tools: A Survey - The New Paradigms, Methodologies and Tools for Large Data Sets Visualization. Proceeding from 6th International Conference on Data Science, Technology and Application. 296-305.
39 Commercial Training, 49(7). 321328. https:// doi.org/10.1108/ICT-10-2016-0069
[14] Manyika, J., Chui, M., Brown, B., Dobbs, R. Roxburgh, C. & Byers, A. H. (2011). Big data: The next frontier for innovation, competition and productivity. McKinsey Global Institute.
[15] Demchenko, Y., Grosso, P., Laat, C. D. & Membrey, P. 2013. Addressing big data issues in scientific data structure. Proceeding from 2013 International Conference on Collaborative Technologies and Systems, 48-55. doi: 10.1109/CTS.2013.6567203
[16] Big Data Europe. 2015. Questionnaire on the Europe Data-Driven Economy. Retrieved from https:// www.big-data-europe.eu/wp-content/uploads/data-driven
economy_questionnaire_CNECT_G3_final _15-07-15.doc.
[17] Statistica. 2018. Numbers of mobile phone user worldwide from 2015 to 2020 (in billions). Retrieved from https://www.statista.com/statistics