http://www.sciencepublishinggroup.com/j/ajce doi: 10.11648/j.ajce.20170506.13
ISSN: 2330-8729 (Print); ISSN: 2330-8737 (Online)
Material Price Enfluence on the Optimum Design of
Different Structural Members
Salim Tayeb Yousif
1, Rabi Muyad Najem
21Civil Engineering Department, Engineering College, Isra University, Amman, Jordan 2
Civil Engineering Department, Engineering College, Mosul University, Mosul, Iraq
Email address:
styousif59112@yahoo.com (S. T. Yousif), ce_rabi@yahoo.com (R. M. Najem)
To cite this article:
Salim Tayeb Yousif, Rabi Muyad Najem. Material Price Enfluence on the Optimum Design of Different Structural Members. American Journal of Civil Engineering. Vol. 5, No. 6, 2017, pp. 331-338. doi: 10.11648/j.ajce.20170506.13
Received: August 25, 2017; Accepted: September 7, 2017; Published: October 13, 2017
Abstract:
This study presents the application of Genetic Algorithms (GAs) for the optimum cost design of reinforced concrete beams and columns based on the standard specifications of the American Concrete Institute (ACI 318-11). The produced optimization procedure satisfies the strength, serviceability, ductility, durability, and other constraints related to good design and detailing practice. While most of the approaches reported in this field have considered steel reinforcement only or cross-sectional dimensions of the members as design variables and for the flexural aspect in general, the dimensions and reinforcing steel in this study were introduced as design variables, considering the axial, flexural, shear, and torsion effects on the members. The aim of this study is to find the effect of material’s price on the optimum cost of beams and columns according to the local market using the GAs, by limiting the design procedure with many constraints that control the optimum design variables to a certain limits. It was found that the Genetic Algorithms is a sufficient method for finding the optimum solution smoothly and flawless with many complicated constraints. Also, increasing the applied torsion on a beam section with a constant cost ratio r will increase the optimum cost by about 3.8%.Keywords:
Optimum Design, Genetic Algorithms, Material Price, Concrete Design, Optimum Cost1. Introduction
The Genetic Algorithms (GAs) Method was used to find the optimum cost design of reinforced concrete beams and columns, the efficiency of this method was proved before in many researches. In this study, it was used with many design constraints to include flexure, shear and torsion effect on the optimum cost of structural members, also a predefined database was used to select the optimum number and size of bars used in reinforcement.
The constant parameters specified prior to the solution of the optimization problem included the length of spans, the supporting conditions, the loads, the material properties, and the unit costs for the used materials. The forces, the moments, and any information needed in the Genetic Algorithms (GAs) constraints were determined from the analysis. The optimum designed member sections were found as continuous variables. Then they were converted to a discrete form by giving nearest measurement of 25 mm as for
the dimensions variables, while the areas of the longitudinal and transverse steel obtained from the design were converted into the nearest weight detailing of steel reinforcements that were available in the market. This conversion was achieved by generating a database of reinforcement templates containing different available reinforcement bar diameters in a pre-specified pattern satisfying the user-specified bar rules and other bar spacing requirements.
reinforcement as a variable by generating a reinforcement templates that satisfied the constraints.
Also, GAs was used by Sahab 2008 [2], to find the optimum cost of flat slab buildings including the cost of material and labor for concrete, reinforcement, formwork of floors, columns and foundations. The influence of the unit cost of the materials and their characteristic strength on the optimum design was investigated. The design variables were represented by the slab thickness and dimensions, and the reinforcing steel and its distribution, columns dimensions (which was assumed to be equal) with its reinforcing steel.
This study led to 23.3% saving in the total cost component of concrete, reinforcement and formwork of the concrete and steel framed office building that has been recommended to be a benchmark for future studies, the major part of this saving can results from the cost of the floor slabs which has the biggest effect.
In 2012, Awad, et. al. [3], reviewed the optimization techniques and their applications for the design of fiber composite structures of civil engineering applications. Verifying the importance of some of the used methods to optimize this kind of structures and recommending the fields that each method can give the best solution. The authors suggested an optimization procedure to link different design aspects to achieve an optimum design. These aspects are: experimental material test, FE analysis, design codes and standards, and optimization methods. Considering the limitations of the existing optimization methods, this approach was found to be more suitable for the design optimization of FRP composite structures because it takes into consideration the variables and constraints uncertainty in the design.
2. Beam Objective Function
For this case, the design criterion is the cost of the reinforced concrete beam. The objective is to minimize the cost without violating the constraints. The cost of the beam includes the cost of the concrete and the cost of the reinforcing steel. The total cost of the reinforced concrete beam is:
Ct = Volc Cc + Vols Cs (1)
Ct = Cc × b × { (d + t) + r ×
ρ
× d } (2)Where:
Ct: The total material cost
Cc: The concrete cost / unit volume
Cs: The steel reinforcement cost / unit volume Volc: Volume of concrete
Vols: Volume of steel
r: is a cost ratio, that represents the cost of a unit volume of steel to a unit volume of concrete (Cs/Cc), taken to be as (75).
d: Effective depth b: Member width
ρ : Reinforcement ratio
As for the cost of shear and torsion steel reinforcement, another separate cost function will be added to the main cost function, because the design variables that will be used for optimizing the shear and torsional reinforcement will affect the direction that will be taken to find the optimum values, so it was preferred to optimize the beam into two levels, one for flexure and the other for shear and torsion.
3. Design Constraints for Beams
A reinforced concrete beam must have a structural capacity greater than the factored applied loading and meet the specifications defined in the ACI Code [4]. The ACI Code has restrictions and limitations on the cross-sectional geometry of a beam and the position and quantity of steel reinforcement for all kinds of loading.
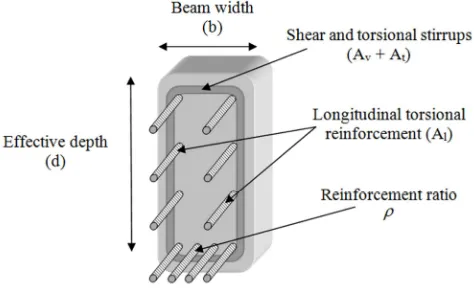
Many researchers used the dimensions only as design variables, and then the reinforcement ratio was calculated depending on these variables, Govindaraj and Ramasamy 2005 [1], then it was topology optimized, on the contrary, of this study, which used not only the reinforcement ratio as a design variable in addition to the dimensions as shown in Figure 1, (which will give the minimum cost) but also including the effect of shear and torsion on these optimum dimensions besides other constraints. These constraints were used in order to specify the main variables in such a case where they can resist the applied loads (in many ways), and also to stay within the limits of the used code, in order to make the optimal solution more realistic and applicable.
Figure 1. Reinforced concrete beams design variables.
The first constraint eq.(3) was used to make the three variables ρ, b and d (reinforcement ratio, beam width and beam effective depth) of the section carry the smallest values that can resist the applied moment on that section. While eqs. (4) And (5) represent the constraints that were used to prevent the reinforcement ratio neither from exceeding the maximum value nor below the minimum value specified according to the ACI Code.
2
1 0 ( )
0.9( ( ))
2
k w L
a
b d fy d
ρ
× × − ≤
Where: a=(ρ× × ×b d fy) / (0.85× fc′×b)
min
1 ρ 0
ρ
− ≤ (4)
max
1 0
ρ
ρ − ≤ (5)
Eq. (6) was used to guarantee that the optimum section will not have a depth less than the depth that controls the elastic deflection, ACI code (9.5.2.2), Building Code Requirements 2012 [4], considering the effects of cracking and reinforcement on member stiffness, Adeli and Sarma 2006 [5].
m in
1 h 0
h
− ≤ (6)
In order to make the dimensions more realistic, eqs. (7) And (8) were used to keep the ratio of the optimum depth to the optimum width between (1.5) and (2.5), (specified by the designer).
1.5 h 0
b
− ≤ (7)
0 5 . 2 ≤ − b h (8)
Keeping the dimensions of the optimum width in the range (200 mm) and (500 mm), and the optimum depth in the range (300 mm) and (1250 mm), have been used through the eqs. (9) And (10), also (specified by the designer).
(1 0) ( 1 0)
200 500
b b
and
mm mm
− ≤ − ≤ (9)
( 1 0) (1 0)
1250 300
h h
and
mm− ≤ − mm≤ (10)
To reduce unsightly cracking, and to prevent crushing of the surface concrete due to the inclined compressive stresses caused by shear and torsion, eq. (11) was used to limit the optimum dimensions within this condition. No more specifications could be achieved for the case of limiting the reinforcing steel for shear and torsion, since it depends on the section dimensions before it is found optimally, and if the steel area was used as a constraints, then the solution direction will be decided to reinforce the section with minimum reinforcement or without reinforcement at all. So this solution will not be a general optimum but an optimum design for a special case that was decided before starting the solution. Therefore, for the case of shear and torsion, the right decision for optimizing the section generally as much as it could be, should be limiting the cross section dimensions through the code specifications and leaving the reinforcing area of steel to be found by the designer, and then optimizing it through the bar selection procedure.
2 2 2 1.7 1 0 0.66
u u h
oh
c
c
V T P
bd A V f bd ϕ + − ≤ ′ + (11)
And finally, eqs. (12) and (13) was used for the reinforcement topology through the section, considering the minimum spacing between the chosen bars, Adeli and Sarma 2006 [5]. _ (1 0) _ _ (1 0) 25 Bars Spacing Bars Diameter Bars Spacing or mm − ≤ − ≤ (12) _ (1 0) 25 Layers Spacing mm
− ≤ (13)
4. Optimum Design for Columns Under
Axial Loading
When a symmetrical column is subjected to a concentric axial load P, longitudinal strains develop uniformly across the section, because the steel and concrete are bonded together, the strain in concrete and steel are equal. For any given strain, it is possible to compute the stresses in the concrete and steel using the stress – strain curves for the two materials. The forces Pc and Ps in the concrete and steel are equal to the stresses multiplied by the corresponding areas. The total load P on the column is the sum of these two quantities. Wight and MacGregor 2009 [6]. Failure occurs when P reaches a maximum. For steel with well-defined yield strength, this occurs when:
0.85
c c c
P = f A′ and Ps = f Ay st (14)
Therefore:
0.85 ( )
o c g st y st
P = f′ A −A + f A (15)
Where:
Ag: The gross area of the section.
Ast: The total area of the longitudinal reinforcement. Design axial strength
φ
Pn of compression tied members shall not be taken greater thanφ
Pn, max, computed by eq. (16), according to the ACI code (10.3.6.2).,max 0.8 [0.85 ( ) ]
n c g st y st
P f A A f A
φ = φ ′ − + (16)
where:
φ
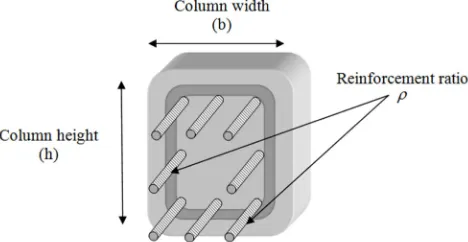
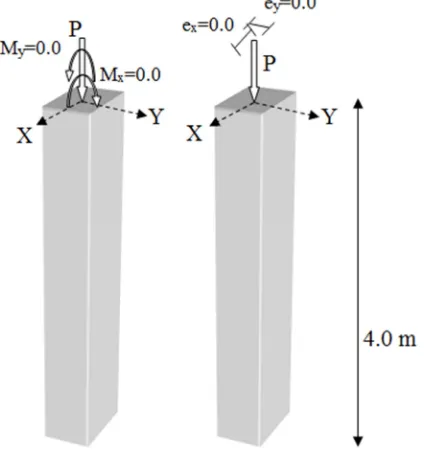
: Strength reduction factor = 0.65, ACI code (9.3.2.2) The cost function of this case is represented by eq. (17), which represent the cost of concrete and steel materials, Najem, Rabi’ M. and Yousif, Salim T., 2015 [7].While the design variables are the dimensions of the column and the reinforcement ratio, considering that the width and the depth of the column cross section will be equal, as can be shown in Figure 2.
Figure 2. Reinforced concrete column design variables for axially loaded column.
To achieve the optimum solution using the GAs with matlab [8], design constraints for the problem should be defined. For the axially loaded column, the used design constraints were: the maximum design strength of the section, eq. (18).
[
]
1 00.65 0.8 1 2
Pu
a a − ≤
× × + (18)
Where:
1 (0.85 (( ) ( )))
a = × ×fc′ b h× − × ×
ρ
b h2 ( ( ))
a = fy× × ×ρ b h
Limiting the reinforcement ratio with maximum and minimum values using eqs. (19) And (20), according to the ACI code (10.9.1) [9] [10].
1 0 0.08
ρ − ≤
(19)
1 0
0.01 ρ
− ≤ (20)
And using a constraint for ensuring that the optimum dimensions of the column will not be less than a specified limit, eqs. (21) and (22).
1 0
0.3 0.25
b or
− ≤ (21)
1 0
0.3 0.25
h or
− ≤ (22)
Finally, a constraint to make the optimum section symmetrical as shown earlier to achieve the axially loaded column requirements, eq. (23).
0
b− =h (23)
5. Example 1: Effect of Steel and
Concrete Unit Cost on Beams
In this example, the prices of steel and concrete are changed according to each other, i.e. the ratio (r: cost of steel to the cost of concrete). This change is within acceptable limits following the market prices. A cantilever beam was designed optimally by the GAs, the beam was under Mu = 600 kN.m, Vu = 150 kN, Tu = 20, 30, 40, 50 and 60 kN.m with fc' = 30 MPa and fy = 400 MPa. The ratio (r) was changed from 40 to 100, and the sections were designed under different values of torsion with a constant moment and shear, and the optimum design variables and optimum costs were found.
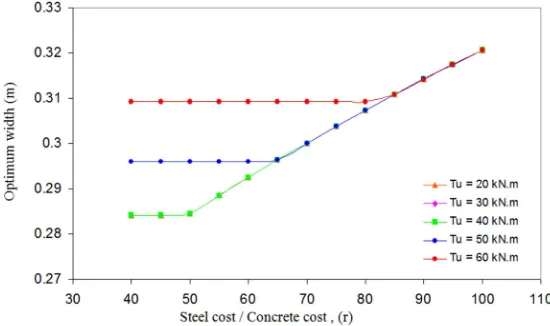
Figure 3 shows the optimum reinforcement ratio with (r) for different values of Tu. The optimum values of the reinforcement ratio seems to have a constant value at some level but it begins to decrease gradually as the steel price become more expensive, this is because the GAs solver tend to use the cheapest material to fulfill the design requirements, so it uses concrete instead of the steel with the design limitations by increasing the concrete cross sectional area and decreasing the reinforcement ratio. Vice versa, as the steel price becomes cheaper, but at some level, the optimum design section under torsion should not have dimensions less than a certain limit. So the optimum cross sectional dimensions have a constant value, and due to this fact, the optimum steel reinforcement ratio is also constant according to these dimensions. According to that, the optimum dimensions behave in a way similar to the reinforcement ratio as shown in Figures 4 and 5. As for the optimum cost a linear relation can express its behavior, Figure 6. Increasing the applied torsion on the section from 20 to 60 kN.m with 40 Cc as constant cost ratio r, decreases the optimum reinforcement ratio by 28%. But at the same time this increment of torsion increases the optimum dimensions by almost 9%, causing an increment for the optimum cost of about 3.8%.
Figure 4. Variation of (Steel / Concrete) ratio with optimum width.
Figure 5. Variation of (Steel / Concrete) ratio with optimum effective depth.
Figure 6. Variation of (Steel / Concrete) ratio with optimum cost.
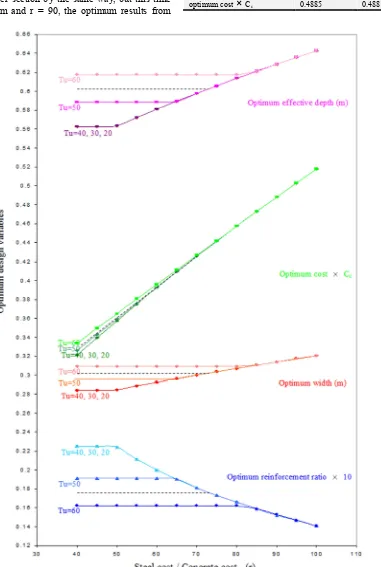
6. Optimum Design Chart
The previous relations can be used to conduct the optimum design variables for any applied torsion with the same previous moment and shear, and for any value of the steel to concrete ratio (r), as shown in Figure 7. For example, to design the same section optimally but with applied torsion of 55 kN.m, and (r) is equal to 45, an imaginary interpolated curve can be drawn between the curves of values Tu = 50
kN.m and Tu = 60 kN.m in Figure 7 for all the optimum design variables and optimum costs curves. Then, the value of (r) can be projected on this imaginary curve to get the optimum design variables for this specific case, which is as follows:
The optimum reinforcement ratio = 0.0177 The optimum width = 303 mm
The optimum effective depth = 604 mm The optimum cost = 0.346
×
Ccwith the same applied loads, the following optimum design variables were found.
The optimum reinforcement ratio = 0.0175 The optimum width = 302.8 mm
The optimum effective depth = 603.6 mm The optimum cost = 0.3457
×
CcDesigning another section by the same way, but this time with Tu = 35 kN.m and r = 90, the optimum results from
Figure 7 and the GAs Matlab solver are shown in Table 1:
Table 1. Design results using GAs solver and optimum design chart.
Optimum design variables Figure 7 GAs Matlab solver
optimum reinforcement ratio 0.01525 0.0152 optimum width (mm) 314 314.2 optimum effective depth (mm) 628.5 628.6 optimum cost
×
Cc 0.4885 0.48817. Example 2: Effect of Steel and
Concrete Unit Cost on Axial Columns
To begin with, the 4.0m column shown in Figure 8, was designed optimally using the GAs. The concrete compressive strength was 25 MPa and the steel yield stress was 400 MPa. The column was loaded with different values of load (1000, 1400, 1800, 2200, 2600 and 3000 kN), and it was designed optimally according to each value of these loads with a cost ratio of about 75 once and again with a cost ratio of about 15, in order to realize the difference between the expensive and cheep materials prices. The values of Mx and My were taken to be zero for this example. Before starting the designing procedure, the section was designed to be square and the cross sectional dimensions of the columns were limited between 250 mm and 400 mm, whereas the reinforcement ratio was limited between 0.01 and 0.08.
Figure 8. Designed 4.0m axial column using the Gas.
In Figure 9, the optimum designed height of the column cross section and the optimum reinforcement ratio, are drawn together for the case of r=75. As long as the price of the steel is high compared to the concrete, then the GAs optimization solver will tend to use the minimum value of the reinforcement ratio, instead of using the concrete to fulfill the strength of the designed section, until it reaches the limited value of the dimensions specified by the designer. After that, the solver increases the value of the reinforcement ratio and uses it optimally in designing the section.
As shown in this figure, the solver used the minimum reinforcement ratio 0.01 for the applied load between 1000 kN and 2000kN, but keeps increasing the dimensions of the designed section to provide the strength of the column. After 2000 kN of applied load, it is noticed that the dimensions of the designed section reaches their maximum limitations of 400 mm and the value of the optimum reinforcement ratio
starts to increase instead. The same procedure was used again but this time the cost ratio r =15. Since the concrete price now is relatively higher, the solver starts the designed sections with the minimum value of the cross sectional dimensions 250 mm for the loads between 1000 kN and 2000 kN, but keeps raising the value of the reinforcement ratio until it reaches its maximum limit of 0.08, as shown in Figure 10. Then the solver starts to increase the dimensions of the designed sections with the same maximum value of reinforcement ratio.
Figure 9. Optimum designed variables of columns for different values of applied load with cost ratio r = 75.
Figure 10. Optimum designed variables of columns for different values of applied load with cost ratio r = 15.
8. Conclusions and Recommendations
It is worth considering that, the methodology of the solution with the (GAs) provides a robust optimum design approach for the challenging problems especially the required large constraints and the minimum time and effort for achieving the design requirements. This in turn, makes this method on the top of the available choices for any engineer seeking the optimum design. Also, by increasing the applied torsion on a beam section with a constant cost ratio r, the optimum reinforcement ratio will decreases by 28%, and this increment of torsion increases the optimum dimensions by almost 9%, causing an increment for the optimum cost of about 3.8%.
The concrete unit cost is more effective in columns design than the reinforcing steel (when there is a need to increase the section resistance) in finding the better cost that resists the same applied loads and moments if the steel was used.
Acknowledgements
for the time they spend to evaluate this work.
References
[1] Govindaraj V. and Ramasamy J. V., 2005, “Optimum Detailed Design of Reinforced Concrete Continuous Beams Using Genetic Algorithm”, Computers and Structures, No. 84, pp. 34 – 48.
[2] Sahab M. G., 2008, “Sensitivity of The Optimum Design of Reinforced Concrete Flat Slab Buildings to The Unit Cost Components And Characteristic Material Strengths”, Asian Journal of Civil Engineering ( Building and Housing ), Vol. 9, No. 5, pp. 487 – 503.
[3] Awad Z. K., Arvinthan T., Zhuge Y. and Conzalea F., 2012, “A Review of Optimization Techniques Used in The Design of Fiber Composite Structures For Civil Engineering Applications”, Materials And Design, No. 33, pp. 534 – 544. [4] Building Code Requirements for Structural Concrete (ACI
318 M–11), Reported by ACI Committee 318.
[5] Adeli H. and Sarma K. C., 2006, “Cost Optimization of Structures”, John Wiley & Sons Ltd.
[6] Wight J. K. and MacGregor J. G., 2009, “Reinforced Concrete – Mechanics And Design”, Fifth Edition, Pearson Education Inc.
[7] Najem, Rabi’ M. and Yousif, Salim T., 2015, “Optimum Structural Cost: A Genetic Algorithms Approach”, Scholar’s Press, Deutschland, Germany.
[8] Global Optimization Tool Box 3, 2010, “User’s Guide”, The Math Works Inc.
[9] Wight, James K. and MacGregor, James G, 2009, “Reinforced Concrete: Mechanics And Design”, Fifth Edition, Pearson Education Hall.