Published online October 30, 2014 (http://www.sciencepublishinggroup.com/j/ijmea) doi: 10.11648/j.ijmea.20140205.11
ISSN: 2330-023X (Print); ISSN: 2330-0248 (Online)
Numerical study on flow length in injection molding
process with high-speed injection molding
Pham Son Minh
*, Tran Minh The Uyen
Department of Mechanical Engineering, HCMC University of Technology and Education, Ho Chi Minh City, Vietnam
Email address:
[email protected] (P. S. Minh)
To cite this article:
Pham Son Minh, Tran Minh The Uyen. Numerical Study on Flow Length in Injection Molding Process with High-Speed Injection Molding.
International Journal of Mechanical Engineering and Applications. Vol. 2, No. 5, 2014, pp. 58-63. doi: 10.11648/j.ijmea.20140205.11
Abstract:
In thin-wall injection molding, due to the very fast polymer melt heat transfer to the mold wall, the freeze layer appears quickly during the filling stage. In this study, high-speed injection molding (up to 1400 mm/s injection speed) was studied. A mold of spiral shape, 0.4 mm thick, is used to verify the ability of melt filling under different injection speeds. Simulation by Moldflow software was also performed for verification. The result shows that when injection speeds vary for 100 mm/s, 500 mm/s, 1000 mm/s, and 1400 mm/s, the flow length to thickness ratio was increased with the value of 335, 467.5, 605, and 640, respectively. The simulation results also show that the heat transfer coefficient between hot melt and mold wall has a strong influence on the flow length, especially with the high-speed injection molding. In general, slower injection speed requires a higher heat transfer coefficient, whereas higher injection speed require only a lower heat transfer coefficient.Keywords:
High-Speed Injection Molding, Flow Length to Thickness Ratio, Heat Transfer Coefficient1. Introduction
Injection molding is a popular technology for manufacturing. However, as products become thinner and smaller, it is difficult to manufacture them using conventional injection molding (CIM), because heat transfers rapidly from the melt to mold wall due to part’s thinness. Increasing the mold temperature, melt temperature, or packing pressure, it increases the cycle time. There are two definitions of “thin-wall” parts: a part with a thickness below 1 mm across an area greater than 50 cm2 [1, 2]; and a flow length to thickness (L/t) ratio greater than 100:1 or 150:1 [3, 4]. To fill the cavity in an extremely short time before the formation of the skin layer in thin-wall parts, injection machine manufacturers have developed machines for high-speed injection, and this process was called high-speed injection molding (HSIM) [5, 6]. The object of HSIM is to fill the cavity in an extremely short time. Hence, a higher injection pressure, a stable controller, and rigid steel for the injection machine and mold are necessary.
HSIM rapidly fills the mold cavity, enabling it to more precisely mold thin-wall parts or parts with micro structures [7 – 9]. For example, there are many micro structures on light guide plates, making transcription uniformity very important. The usual method is to increase the mold or melt temperature
to improve the transcription uniformity. However, increasing the temperature possibly increases the cycle time. Yokoi [10, 11] found that HSIM was useful in improving both the transcription ratio and transcription uniformity of a light guide plate. HSIM permits the melt to fill the cavity as rapidly as possible, before the formation of the solidified skin layer. Despite the potential usefulness of HSIM in the manufacture of precision parts, few studies have explored HSIM. Manufacturers generally use trial and error approaches to obtain the properties of HSIM. This is unsystematic and wastes time and money.
they can easily be anticipated through simulation.
Over the past few years, the thin-wall injection molding speed was about 500 mm/s [1 – 10], but with products becoming ever smaller and thinner, 500mm/s proved too slow to satisfactorily mold them. In response, injection machine manufacturers began developing new injection machines with speeds exceeding 500 mm/s. However, at present, HSIM is used only by those who have special requirements, and there have been few reported investigations of HSIM. When the injection speed becomes high-speed, many conventional conditions must be altered. The goals of this study thus include (1) using flow length study to visualize high speed injection characteristic through both numerical and experimental methods; (2) investigating the relationship between the heat transfer coefficient and injection speed. Since the behavior of the material is changed by high injection speed, the conditions of the simulation should also be modified. We first use the spiral model to experimentally obtain the flow length at injection speeds ranging from 100 mm/s to 1400 mm/s, and then heat transfer coefficients that affect the thermal conductivity in simulation are varied from 5000 to 20,000 W/m2 °C by Moldflow software to anticipate the flow length. Finally, the results of the experiments and simulations will be compared and discussed.
2. Experiment and Simulation Work
2.1. Experimental Work
The high-speed injection molding machine in this study was a High Speed High Pressure Injection Molding Machine TX-SC Series by CHUAN LIH FA. On this machine the arrangement of the accumulator, the control valve, and the injection unit eliminates delays in control and losses by piping, and by adopting the V-line system, only the plunger is under control. This machine can reach a maximum injection speed of 1500 mm/s and a maximum injection pressure of 343 MPa. The injection speed control is an important property of the machine that goes from zero to maximum speed in 0.1 s and from maximum speed to zero in 0.215 s.
The material used was Acrylonitrile Butadiene Styrene (ABS), type PA-756, supplied by Chi-Mei. The experimental model was a spiral shape 6 mm long and 0.4 mm thick, as shown in Figure 1, and was used to measure the flow length. After the injection molding process was finished, the part will be rejected, then, the melt flow length will be measured. If the flow length is longer, it means the material has better flow behavior [7 - 9]. The experimental mold temperature, shown in Table 1, was set at 30 °C, while melt temperature was 240 °C. Since these experiments were designed for verifying the melt flow length, so, the packing pressure was ignored, and the melt volume was fixed at a ram position of 20 mm. The injection speed conditions were selected as 100, 500, 1000, and 1400 mm/s, and the injection pressure was 343 MPa.
To ensure the accuracy of the simulation, the heat transfer coefficient (HTC) between the mold and melt is a key point, especially for thin-wall parts. Therefore, this parameter was varied in the simulation. According to introduction to HTC in the Moldflow software, during the mold filling in injection molding, as shown in Figure 2 [12], due to the thermal contact resistance between mold and melt, the mold-melt interface temperature (Tmt) is usually higher than the set mold
temperature (Tmb). The difference between Tmb and Tmt
depends on the thermal properties of the mold metal and the melt, as well as on the process conditions. Generally speaking, Tmt may not be greatly different from Tmb. This means that Tmb
may be used to represent Tmt directly in the CAE molding
simulation. However, for cases involving thin-wall parts, high speed filling, or melt with highly temperature-dependent viscosity, the use of Tmt tends to underestimate the mold-melt
interface temperature, which further leads to an overestimate of the injection pressure. It is often convenient to work with the HTC, which is defined by an expression analogous to Newton’s law of cooling:
= ℎ × ∆ (1)
Where:
Q = thermal energy in Joules h = heat transfer coefficient
A = Surface area of the heat being transferred
∆T = Difference in temperature between the solid surface and surrounding fluid area.
Figure 1. Spiral shaped mold insert with a thickness of 0.4 mm
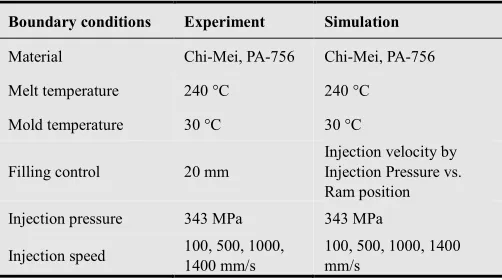
Table 1. Boundary conditions in experiment and simulation.
Boundary conditions Experiment Simulation
Material Chi-Mei, PA-756 Chi-Mei, PA-756
Melt temperature 240 °C 240 °C
Mold temperature 30 °C 30 °C
Filling control 20 mm
Injection velocity by Injection Pressure vs. Ram position
Injection pressure 343 MPa 343 MPa
Injection speed 100, 500, 1000,
1400 mm/s
Mold
plate
Melt
T
mtT
mbCL
Underestimated temperature
by a constant mold tem perature Reasonable temperature through HTC
Figure 2. The schematic of thermal conductivity during filling stage [12].
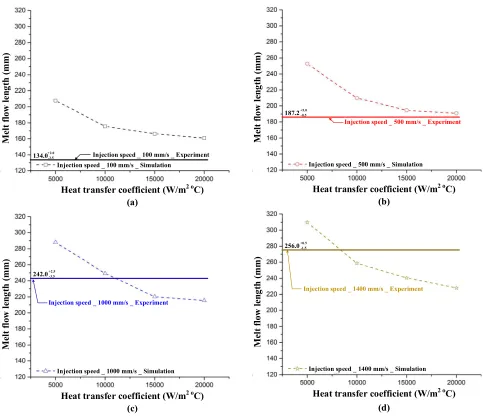
In the simulation model shown in Figure 3, the total element count was 1,050,225, with element types of Tetra. The parameters of the simulation, as shown in Table 1, were the same as in the experiments. Normally, the HTC value set to the default 5000 W/m2 °C. In this study, we simulate high-speed injection molding. HTC would thus be set at 5000, 10000, 15000, and 20000 W/m2 °C under different injection speeds to determine which HTC approaches the experimental results.
(a) (b)
Figure 3. (a) CAD model. (b) The meshing model in Moldflow simulation.
3. Results and Discussions
In this paper, the part thickness is only 0.4 mm, meaning that the heat of polymer could more easily be dissipated by the mold wall. By comparing with the same time for melt flowing, with a slower injection speed, the freeze layer will defend seriously the melt [1 - 3]. On the contrary, with a higher injection speed, the polymer will flow faster, as a result, the effect of freeze layer could be reduced [5, 6]. On the other hand, the shear heating also impact on the melt temperature, as well as the melt viscosity. With the higher injection speed, the higher shear rate will appear. So, the melt will be heated by the shear heating effect [10, 11], which will create higher melt temperature, so, the melt will flow easier. So, in general, according to the effect of freeze layer and shear rate heating, the higher injection speed will let the longer flow length.
In this research, the melt of ABS – PA756 will be filled into cavity with the melt temperature of 240 °C, mold temperature of 30 °C, and the injection pressure of 343 MPa. After the
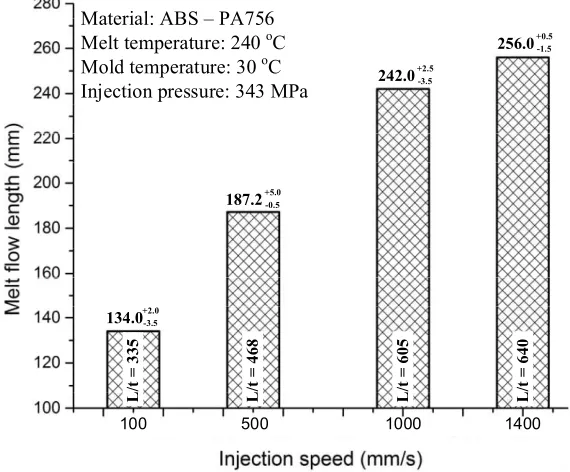
molding process was finished, the melt flow length will be measured by the length of molding part. For observing the influence of injection speed on the ability of melt filling, four injection speed will be applied. Each type of injection speed, the molding process will be run with 10 cycles for reaching to the stable stage. Then, in the next 10 processes, the molding part will be collected and its length values will be used for comparing and discussing. The length of parts under different injection speed were shown in Figure 4. The melt flow length comparison with different injection speeds are shown in Figure 5. According to these results, with the common injection speed (lower than 500 mm/s [1, 8, 9]), when the injection speed increases from 100 mm/s to 500 mm/s, the melt flow length was increased 39.7%. However, with high-speed injection molding, when the injection speed increases to 1400 mm/s, the flow length could reach to 91% longer than the case of 100 mm/s. With the case of 1400 mm/s injection speed, the flow length to thickness (L/t) reaches to 640. This ratio shows a bright improvement with the cases of common injection speed [1 - 8]. In the other injection speed, the experiment show that the L/t ratios are 335, 468, 605, and 640 with the injection speed of 100 mm/s, 500 mm/s, 1000 mm/s, 1400 mm/s, respectively.
W/m2 °C. On the other hand, these results also show that, with the simulation step, the higher injection speed should have a smaller HTC in the set up.
In general, for improvement of the simulation accuracy, the
cases of high-speed injection molding. If the HTC is too high, the melt flow length in simulation will be shorter than the real value. However, if the HTC is too low, the melt flow length in simulation will be longer than the real value.
(a) Injection speed : 100 mm/s Melt flow length: 134 mm
R/t = 335
(b) Injection speed : 400 mm/s Melt flow length: 187 mm
R/t = 468
(c) Injection speed : 1000 mm/s Melt flow length: 242 mm
R/t = 605
(d) Injection speed : 1400 mm/s Melt flow length: 256 mm
R/t = 640
Figure 4. Melt flow length by experiment with injection speeds varies from 100 mm/s to 1400 mm/s.
100 500 1000 1400
134.0 +2.0-3.5
187.2 +5.0-0.5
242.0 +2.5-3.5
256.0 +0.5-1.5
L
/t
=
3
3
5
L
/t
=
4
6
8
L
/t
=
6
0
5
L
/t
=
6
4
0
Material: ABS – PA756 Melt temperature: 240 oC Mold temperature: 30 oC Injection pressure: 343 MPa
Injection speed _ 100 mm/s _ Simulation
Injection speed _ 100 mm/s _ Experiment
M el t fl o w l en g th ( m m )
134.0 +2.0 -3.5
Heat transfer coefficient (W/m2 oC)
Injection speed _ 500 mm/s _ Simulation
Injection speed _ 500 mm/s _ Experiment
M el t fl o w l en g th ( m m )
187.2 +5.0-0.5
Heat transfer coefficient (W/m2 oC)
Injection speed _ 1000 mm/s _ Simulation
Injection speed _ 1000 mm/s _ Experiment
M el t fl o w l en g th ( m m )
242.0 +2.5-3.5
Heat transfer coefficient (W/m2 oC)
Injection speed _ 1400 mm/s _ Simulation
Injection speed _ 1400 mm/s _ Experiment
M el t fl o w l en g th ( m m )
256.0 +0.5 -1.5
Heat transfer coefficient (W/m2 oC)
(a) (b)
(c) (d)
Figure 6. Comparison of melt flow length between simulation and experiment under different heat transfer coefficient.
4. Conclusion
In this research, by simulation and experiment, the effect of injection speed on the melt flow length was overseen. In addition, by varying the heat transfer coefficient in simulation cases, the accuracy of simulation was verified. Based on the result, these conclusions were obtained:
1. In injection molding process with the thin-wall parts, thermal energy is rapidly transferred from the melt to the mold material, it means that the HTC must be modified in the simulation based on the injection speed. 2. In the experiment, when the injection speed of 1400
mm/s was used, the melt flow length was improved 91% with the case of 100 mm/s, and the L/t ratios was increased from 335 to 640.
3. With higher HTC increased, the simulation results for L/t become shorter. When the injection speed exceeds 1000 mm/s, HTC should be adjusted to 10000 W/m2 °C, respectively
Acknowledgements
This research was supported by HCMC University of Technology and Education, Hochiminh City, Vietnam.
References
[1] S. C. Chen, W. H. Liao, J. P. Yeh, R. D. Chien, “Rheological behavior of PS polymer melt under ultra-high speed injection molding”, Polym. Test., vol 31, pp. 864 – 869, October 2012.
[2] F. Yu, H. Deng, Q. Zhang, K. Wang, C. L. Zhang, F. Chen, Q. Fu, “Anisotropic multilayer conductive networks in carbon nanotubes filled polyethylene / polypropylene blends obtained through high speed thin wall injection molding”, Polym., vol. 54, pp. 6425–6436, November 2013.
injection speed control of an ultra-high-speed plastic injection molding machine”, Mech., vol. 19, pp. 147–155, March 2009.
[5] H. Bormuth, “High-speed injection moulding with Polypropylene”, Mater. Design, vol. 5, pp. 137–138, June–July 1984.
[6] D. Drummer, K. Vetter, “Expansion–injection–molding (EIM) by cavity near melt compression – About the process characteristic”, CIRP J. Manuf. Sci. Technol., vol. 4, pp. 376–381, 2011.
[7] B. Sha, S. Dimov, C. Griffiths, M.S. Packianather, “Micro-injection moulding: factors affecting the replication quality of micro features”, 4M 2006 - Second International Conference on Multi-Material Micro Manufacture, pp. 269–272, 2006.
[8] C.A. Griffiths, S.S. Dimov, D.T. Pham, “Micro injection moulding: the effects of tool surface finish on melt flow
Multi-Material Micro Manufacture, pp. 373–376, 2006.
[9] D. Annicchiarico, U. M. Attia, J. R. Alcock, “A methodology for shrinkage measurement in micro-injection moulding”, Polym. Test., vol. 32, pp. 769–777, June 2013.
[10] W. M. Yang, H. Yokoi, “Visual analysis of the flow behavior of core material in a fork portion of plastic sandwich injection molding”, Polym. Test., vol 22, pp. 37–43, February 2003.
[11] H. Yokoi, , N. Masuda, H. Mitsuhata, “Visualization analysis of flow front behavior during filling process of injection mold cavity by two-axis tracking system”, J. Mater. Process. Technol., vol 130–131, pp. 328–333, December 2002.
![Figure 2. The schematic of thermal conductivity during filling stage [12].](https://thumb-us.123doks.com/thumbv2/123dok_us/8462762.1708935/3.595.170.427.85.239/figure-schematic-thermal-conductivity-filling-stage.webp)