are centers of recreational and retirement activity that attract urban tourists, retirees, and businesses. The remaining 31 percent (599) of rural counties, which contain 14.6 million residents or 32 percent of the rural population, have had mixed periods of growth and decline, but their cumulative population losses have been far more modest than in the depopulating coun-ties that have been in decline for many years.
Rural Depopulation in a Rapidly Urbanizing
America
K e n n e t h M . J o h n s o n a n d D a n i e l T . L i c h t e r
National Issue Brief #139 Winter 2019
Carsey School of Public Policy
CARSEY RESEARCH
T
his brief examines demographic trends in rural America, a region often overlooked in a nation dominated by urban interests. Yet, 46 million people live in rural areas that encompass 72 percent of the land area of the United States. “Rural America” is a simple term that describes a remarkably diverse collection of people and places. It encompasses vast agricultural regions that are among the most produc-tive in the world; sprawling exurban areas just beyond the urban fringe; successful ultra-modern industrial, energy, and warehousing complexes strung along rural interstates; regions where coal, ore, oil, gas, and timber are extracted, processed, and shipped; strug-gling factory towns facing intense global competition; and fast-growing recreational areas situated near scenic mountains and lakes.1Depopulation in Rural America
Depopulation occurs when an area experiences substantial population loss over a protracted period, resulting in significant population decline (see Box 1). How widespread is depopulation? In all, 746 coun-ties representing 24 percent of all U.S. councoun-ties are depopulating, and nearly all of them—91 percent—are rural. Just 9 percent of urban counties are depopulat-ing (Figure 1). Such depopulation is a clear indicator of a lack of demographic vitality in a significant part of rural America. Over one-third (35 percent) of all rural counties (676) are depopulating (Figure 2). Today, only 6.2 million residents remain in these depopulating rural counties, a third fewer than resided there in 1950.Though rural depopulation is widespread, many rural counties are thriving and gaining population. Indeed, 35 percent (673) were at their peak population in 2010 and contained 24.8 million residents in 2016—54.5 percent of the rural total. Such growing rural counties often benefit from proximity to metropolitan areas or
FIGURE 1. DEPOPULATION IS MUCH MORE COMMON IN RURAL THAN URBAN COUNTIES
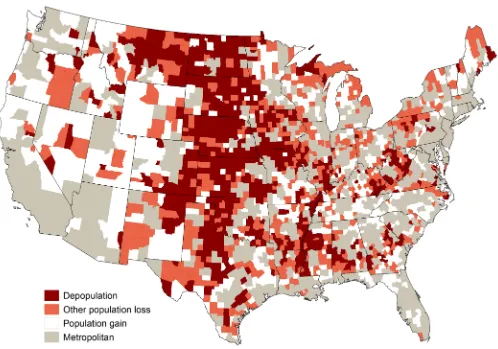
The prevalence, timing, and magnitude of depopu-lation have unfolded unevenly across the geographic landscape of rural America. Depopulating rural counties are concentrated in the Great Plains and lie in a north-south band from the Dakotas through Nebraska, Kansas, and Oklahoma to central Texas (see Figure 3). Clusters of depopulating rural coun-ties are also evident in the northern Great Lakes, the interior of the Southeast, the Mississippi Delta, and the mining regions of West Virginia and Kentucky. In many cases, counties with less severe population losses are proximate to these depopulating counties, illuminating the spatial clustering of population loss in rural America. In contrast, most rural counties at peak populations are in the West, along the Atlantic or Pacific coasts, or proximate to metropolitan coun-ties. There are exceptions to this general pattern, however, in high-amenity areas of the upper Great Lakes and Northern New England, as well as in the Ozarks and the Great Smoky Mountains.
The uneven spatial distribution of population loss and gain reflects the diverse forces influencing rural demographic trends. For example, depopula-tion is prevalent in remote rural counties that are not adjacent to metropolitan areas: more than 46 percent of these remote counties are depopulating, compared to 24 percent of those adjacent to metro-politan counties, trends that may reflect the advan-tages of proximity to urban labor markets, services,
Box 1. Defining Depopulation
We use population data from 1900 to 2010 to group counties with similar patterns of population change. In this brief, a depopulation county reached its peak population by 1950 and lost at least 25 percent of that peak population by 2010. In contrast, gain counties had a larger population in 2010 than at any point in the past. A third group of counties, other loss, had mixed histories of population gain and loss but each reached its peak population after 1950 or lost less than 25 percent of its peak population by 2010 or did both. For examples, see Box 2. We focus on rural counties, which include all nonmetropolitan counties (see the Methods sec-tion). We use the terms rural and nonmetropolitan interchangeably, as we do the terms urban and
metropolitan. and economic activities. Depopulation also reflects the historical impact of employment declines in agriculture resulting from mechanization and farm consolidation. More than 80 percent of all rural farm counties are depopulating, compared to just 15 percent of nonmetropolitan recreational coun-ties and 13 percent of retirement councoun-ties. Indeed, 59 percent of the recreational and 74 percent of the retirement counties are currently at their popula-tion peaks. Thus, while depopulapopula-tion is prevalent in some rural areas, it is far from universal.
The Demographic Drivers of
Depopulation and Their Impact
on the Rural Population
Population loss from outmigration is the most important factor in the initial stages of depopulation, and young adults are particularly prominent in these outmigration streams. Depopulating rural counties had an average migration loss of 43 percent of their 20-24-year-olds in each decade from 1950 to 2010, and such chronic young-adult outmigration meant that there were far fewer women of childbearing age and, as a result, many fewer births. In contrast, the sizeable older population that did not migrate aged in place, resulting in rising mortality. Consequently, between 2000 and 2010, 60 percent of depopulat-ing rural counties had more deaths than births. This combination of young-adult outmigration, fewer births, and more deaths produced a downward spiral of population loss that can be difficult to break.
FIGURE 2. MOST OF THE RURAL POPULATION LIVES IN GROWING COUNTIES, BUT MOST RURAL COUNTIES ARE NOT GROWING
What overall impact has depopulation had on the rural counties experiencing it? Between 1950 and 2016, depopulating counties lost more than 34 percent of their original population. Among coun-ties with mixed histories of growth and decline, the population grew by 5 percent through 2016. Among rural counties at their population peak in 2010, the population grew by nearly 75 percent.
How did rural areas fare during the Great Recession and its aftermath? Between 2010 and
2016, America’s nonmetropolitan population declined overall for the first time ever.2 Losses were greatest in depopulating counties, among which 82 percent lost population, reflecting the cumulative impact of natural decrease and widespread outmi-gration. The situation was only slightly better among rural counties with mixed histories of population gain and loss: nearly 80 percent lost population between 2010 and 2016. Perhaps the most striking finding from the contemporary data is that, even among the nonmetropolitan counties that were at their population peak in 2010, just 56 percent gained population between 2010 and 2016. That nearly half of the counties with long histories of popula-tion gain are now losing populapopula-tion underscores the demographic and economic headwinds that non-metropolitan America faces.
FIGURE 3. DEPOPULATION IN NONMETROPOLITAN AMERICA
Source: Census Bureau, Census of 1900 to 2010.
Rural Policy in an Urban Nation
Rural concerns are often overlooked in a nation domi-nated by urban interests.3 Yet a vibrant rural America contributes to the nation’s intellectual and cultural diversity as well as providing most of its food, minerals, energy, clean air, and clean water.
winners and losers is a matter of considerable policy debate. This approach is also at odds with the con-temporary rural economic development strategies that sometimes target declining places with little prospect of success.
• As a community, promote receptiveness to immigra-tion. Recent immigrants can provide a demographic lifeline for fading rural communities, not just through their numbers and the higher fertility of a younger population, but also by contributing to a community’s economic, cultural, and social resources.5
This study provides a demographic window to the future and a sober forecast of continuing rural popula-tion decline in many economically depressed regions. Future rural population growth and decline clearly are deeply rooted in evolving patterns of migration, fertil-ity, and mortality. It is past time to refocus our atten-tion on the rural people and places left behind.
Methods
An important challenge in studying rural America is defining where it begins and where it ends. Clearly, farm towns on the Great Plains are rural and Los Angeles is not, but where do we draw the line? There is no simple answer. Here we rely on a widely accepted method using the 2013 definition from the U.S. Office of Management and Budget to classify metropolitan counties as urban and non-metropolitan counties as rural.6 We use the terms nonmetropolitan and rural interchangeably, as we do the terms metropolitan and urban. The 3,141 U.S. counties are appropriate units of analysis because they have historically stable boundaries and are a basic unit for reporting demographic data. We restrict our analysis to the continental United States because Alaska and Hawaii were not states during our entire study period. Historical demographic data come from the decennial Census for 1900 to 2010 and from migration files developed by teams of demographers over the past 60 years.7 Demographic data from 2010 to 2016 are from Census Bureau Population Estimates.
Rural concerns are often overlooked in a
nation dominated by urban interests. Yet
a vibrant rural America contributes to the
nation’s intellectual and cultural diversity as
well as providing most of its food, minerals,
energy, clean air, and clean water.
Our research provides clear evidence of depopulation across a broad swatch of rural America. Depopulation seemingly is now built into the demographic fabric of some parts of rural America—a result of chronic outmigration among young adults of reproductive age, along with population aging and high mortality rates. Yet, depopulation is far from universal. Many rural regions continue to grow, often rapidly, including exurban areas just beyond the metropolitan suburban fringe, and high-amenity recreational and retirement areas. These counties are likely to hold their own demographically in the future. The situation is much different for the depopulating rural counties caught in a downward spiral of population loss.
From a policy standpoint, investments in rural infra-structure and other community development activities must be carefully targeted for success. There are at least three possible policy avenues for addressing the prospect of rural depopulation, and each has its political challenges:
• Change the location of investment by diverting resources from local to regional economic growth —per-haps first in urban employment centers—with the expectation that surrounding rural communities will share the benefits from integration and economic interconnections (that is, commuting and economic spillovers) under a mostly urban umbrella.4
E n d n o t e s
1. This brief summarizes the authors’ research in K.M. Johnson and D.T. Lichter, “Rural Depopulation: Growth and Decline Processes Over the Past Century,” Rural Sociology (2019), doi:10.1111/ruso.12266.
2. J. Cromartie, “Rural Areas Show Overall Population Decline and Shifting Regional Patterns of Population Change,” Amber Waves (U.S. Department of Agriculture), September 5, 2017, https://www.ers.usda.gov/amber- waves/2017/september/rural-areas-show-overall- population-decline-and-shifting-regional-patterns-of-population-change/.
3. See the special issue on “The New Rural-Urban Interface,” Annals of the American Academy of Political and Social Science 672, no. 1; also D.T. Lichter and J. P. Ziliak, “The Rural-Urban Interface: New Patterns of Spatial Interdependence and Inequality in America,” Annals of the American Academy of Political and Social Science 672, no. 1 (2017): 6–25.
4. A. Tsvetkova, M. Partridge, and M. Betz,
“Entrepreneurial and Employment Responses to Economic Conditions Across the Rural-Urban Continuum,” Annals of the American Academy of Political and Social Science 672, no. 1 (2017): 83–102.
5. P.J. Carr, D.T. Lichter, and M.J. Kefalas, “Can Immigration Save Small-Town America? Hispanic
Boomtowns and the Uneasy Path to Renewal,” Annals of the American Academy of Political and Social Science 641, no. 1 (2012): 38–57; K.M. Johnson and D.T. Lichter, “Diverging Demography: Hispanic and Non-Hispanic Contributions to US Population Redistribution and Diversity,” Population Research and Policy Review 35, no. 5 (2016): 705–25. 6. Because we use a constant 2013 Office of Management and Budget (OMB) definition of metropolitan, several hundred counties that would have been classified as nonmetropolitan under previous OMB definitions are defined as metropolitan here. This highly selective reclassification process has, over the course of several decades, removed many fast-growing counties from the universe of nonmetropolitan counties and reclassified them as metropolitan. As a result, the population of nonmetropolitan America is considerably smaller and the growth rate significantly less than it would have been had these counties remained rural.
7. R.L. Winkler, K.M. Johnson, C. Cheng, P.R. Voss, and K.J. Curtis, “County-Specific Net Migration by Five-Year Age Groups, Hispanic Origin, Race, and Sex, 2000–2010,” CDE Working Paper No. 2013-04 (Madison: University of Wisconsin, Center for Demography and Ecology, 2013). Box 2. Examples of Population Gain and Loss
in Rural America
Depopulating Counties: Rural America was settled by people who wrestled food, fiber, and minerals from the land. Among these were the families that settled in the Kansas farm counties of Jewell, Osborne, Republic, and Smith, situ-ated along the Nebraska-Kansas border and far removed from the urban scene. In 1900, nearly 66,000 people lived and farmed in these counties. The population has declined ever since, and by 2016 only 14,800 people remained.
Growing Counties: Michigan’s Grand Traverse County, situated on a beautiful Lake Michigan bay, characterizes fast growing recreational and retire-ment counties. In 1900, Grand Traverse had 20,500 residents. It has grown rapidly since the 1970s by attracting migrants from the metropolitan areas of Michigan, as well as from Chicago. Growth slowed during the Great Recession, but it has since picked up. By 2016, Grand Traverse had 91,900 residents— nearly 3.5 times as many as in 1900.
The Carsey School of Public Policy at the University of New Hampshire is nationally recognized for its research, policy education, and engagement. The school takes on the pressing issues of the twenty-first century, striving for innovative, responsive, and equitable solutions.
Huddleston Hall • 73 Main Street • Durham, NH 03824 (603) 862-2821
TTY Users: dial 7-1-1 or 1-800-735-2964 (Relay N.H.)
carsey.unh.edu
University of New Hampshire
Carsey School of Public Policy A c k n o w l e d g e m e n t s
This brief summarizes the authors’ research in K.M. Johnson and D.T. Lichter, “Rural Depopulation: Growth and Decline Processes Over the Past Century,”
Rural Sociology (2019), doi:10.1111/ruso.12266. Kenneth Johnson’s work was supported by his Andrew Carnegie Fellowship from the Carnegie Corporation of New York and by the New Hampshire Agricultural Experiment Station in support of Hatch Multi-State Regional Project W-4001. The opinions presented here are those of the authors and do not necessarily reflect those of the Carnegie Corporation of New York or the New Hampshire Agricultural Experiment Station. Barbara Cook of the Carsey School of Public Policy provided geographic information system support.
A b o u t t h e A u t h o r s
Kenneth M. Johnson is senior demographer at the Carsey School of Public Policy, Class of 1940 Professor of Sociology at the University of New Hampshire, and an Andrew Carnegie fellow (ken.johnson@unh.edu).