ARTICLE
Families’ Health-Related Social Problems and Missed
Referral Opportunities
Eric W. Fleegler, MD, MPHa,b, Tracy A. Lieu, MD, MPHb,c,d, Paul H. Wise, MD, MPHe, Sharon Muret-Wagstaff, PhD, MPAb,d
aDivision of Emergency Medicine anddDepartment of Medicine, Children’s Hospital Boston, Boston, Massachusetts;bHarvard Medical School, Boston, Massachusetts; cCenter for Child Health Care Studies, Department of Ambulatory Care and Prevention, Harvard Pilgrim Health Care, Boston, Massachusetts;eDepartment of Pediatrics,
Stanford University School of Medicine, Stanford, California
The authors have indicated they have no financial relationships relevant to this article to disclose.
ABSTRACT
OBJECTIVES.The objectives of this study were to characterize (1) families’ cumulative
burden of health-related social problems regarding access to health care, housing, food security, income security, and intimate partner violence; (2) families’ expe-riences regarding screening and referral for social problems; and (3) parental acceptability of screening and referral.
METHODS.We surveyed 205 parents of children who were 0 to 6 years of age and
attended 2 urban pediatric clinics for a well-child visit using a self-administered, computer-based questionnaire. The questionnaire included previously validated questions about health-related social problems and new questions about screening and referral in the past 12 months.
RESULTS.A total of 205 (79%) of 260 eligible families participated. Eighty-two
percent of families reported ⱖ1 health-related social problem; 54% experienced problems inⱖ2 social domains. Families experienced similar types and frequencies of problems despite demographic differences between clinics. One third of families reported no screening in any domain in the previous 12 months. Of 205 families, 143 (70%) identified at least 1 need for a referral; 101 (49%) expressedⱖ1 unmet referral need. Of families who reported receiving referrals, 115 referrals were received by 79 families; of the referrals made, 63% (73 of 115) led to contact with the referral agency, and 82% (60 of 73) of the referral agencies were considered helpful. A computer-based system in a pediatrician’s office for future screening and referral for health-related social problems was deemed acceptable by 92% of parents.
CONCLUSIONS.Urban children and families reported a significant burden of
health-related social problems yet infrequent pediatric screening or referral for these problems. Of families who reported receiving referrals, a majority contacted the recommended agencies and found them helpful. This study also demonstrates the feasibility of using a computer-based questionnaire to identify health-related social problems in a routine outpatient clinic setting.
www.pediatrics.org/cgi/doi/10.1542/ peds.2006-1505
doi:10.1542/peds.2006-1505
Results from this study were presented at the annual research meeting of AcademyHealth; June 7, 2004; San Diego, CA; and the annual meeting of the Pediatric Academic Societies; May 16, 2005; Washington, DC.
Key Words
social problems, screening, referral, access to health care, housing, hunger, income, domestic violence, computer, pediatric
Abbreviations
AAP—American Academy of Pediatrics HRSP— health-related social problem AHP—academic health practice CHC— community health center CCHIP—Childhood Community Hunger Identification Project
FPL—federal poverty level CI— confidence interval
Accepted for publication Nov 27, 2006
Address correspondence to Eric W. Fleegler, MD, MPH, Division of Emergency Medicine, MA-001, Children’s Hospital Boston, 300 Longwood Ave, Boston, MA 02115. E-mail: eric.fleegler@childrens.harvard.edu
T
HE AMERICAN ACADEMY of Pediatrics (AAP) states that its mission “is to attain optimal physical, mental and social health and well-being for all infants, children, adolescents and young adults.”1 To fulfill this charge,pediatricians must address medical problems as well as social and economic issues that can adversely affect health. Children are particularly vulnerable to problems such as food insecurity and substandard housing,2,3and
their effects can be lifelong. Providing assistance for fam-ilies’ health-related social problems (HRSPs) requires systematic screening and referral.
Although the AAP recommends screening for major social problems in primary care settings,4–7the extent of
comprehensive screening for HRSPs in routine practice is unknown. The rate of screening for intimate partner violence alone may be as low as 5%.8Whereas parents’
approval of screening for intimate partner violence is well documented,9–11no research published to date has
evaluated parents’ support for comprehensive screening for HRSPs in pediatric settings.
In this study, families with young children provided self-assessments of HRSPs by completing a computer-based questionnaire before a clinic visit. We specifically evaluated (1) the presence of HRSPs in 5 social domains, (2) the frequency of pediatric screening and referral for these problems, and (3) families’ attitudes toward screening and referral for HRSPs.
METHODS
Design and Participant Selection
This is a cross-sectional, descriptive study of families’ self-assessed health-related social problems and referral needs conducted in August to September 2003 at 2 outpatient pediatric clinics in Boston: 1 academic health practice (AHP) and 1 community health center (CHC). Each family was represented by a primary caregiver. Adults in clinic waiting areas were screened
consecu-tively by 1 of 4 bilingual research assistants as a com-puter became available; not all eligible participants were screened because of limited computer availability.12
Eli-gibility requirements were (1) the adult was a parent or primary caregiver of the child (referred to from here forward as “parent”), (2) the child was 0 to 6 years of age, (3) the child was at the clinic for a well-child visit, and (4) the parent could read English or Spanish. Infor-mation from all adults approached, including reason for exclusion or refusal to participate, was collected.
The purpose of the study was explained to eligible parents, and written informed consent was obtained. The survey was an anonymous, self-administered, com-puter-based questionnaire available in English or Span-ish. Participants completed the 20-minute survey on 1 of 2 laptop computers equipped with privacy screens. All participants in the final study received a referral sheet listing local agencies that could help with problems in each of the social domains. The study was approved by the Committee on Clinical Investigation of Children’s Hospital Boston.
Survey Instrument and Measures
The survey instrument focused on HRSPs and experi-ences and opinions related to screening and referral for social problems (Table 1; the original questionnaire may be viewed at www.onlineadvocate.org). A possible in-clusion list of 25 social domains was initially derived using literature review and key informant interviews with health and social services experts. A modified Del-phi technique was used to select the top 5 most relevant topics for inclusion. The 5 health-related social domains were (1) access to health care, (2) housing, (3) food security, (4) income security, and (5) intimate partner violence. Confidentiality and anonymity were protected and emphasized throughout the computer survey
pro-TABLE 1 Survey-Item Categories
Health-Related Social Domains Previous
Experiences
Parental Opinions Demographics
Access to health care Social problems Acceptability of screening individual social domains Parent and child ages No health insurance Screened Acceptability of using computer to screen and refer in pediatric office Parent and child genders
Missed medical care Referred Comfort using computer Education level
Missed prescriptions Referral agencies Distance willing to travel Race/ethnicity
Housing Followed up Marital status
Homeless or doubled up Helpfulness Immigration status
Utilities shut off Household composition
Major housing problem Income
Food security Transportation availability
Food-insecure or hungry Language
Income security
Unemployed and looking for work Intimate partner violence
cess. The survey did not collect any identifying data or contain any links to the informed consent.
The survey instrument combined previously vali-dated questions and scales to assess the social domains as well as new questions to assess experience with social problem screening and referral. Questions in the health-related social domains evaluated the presence and the extent of problems, use of available social services, and barriers to access that families experienced. The survey used a response-driven, branched questionnaire that ranged from 90 to 166 questions.
The access to health care domain included questions from the National Health Interview Survey,13Behavioral
Risk Factor Surveillance System,14and Child Care
Expe-rience and Needs Questions15and assessed for both the
parent and the child their health insurance status (pres-ence/absence and type of health care coverage, reason without health insurance), use of primary care providers and usual source of care, and problems receiving medical services and/or medications within the previous 12 months (and reason for problem). An access to health care problem included either current lack of health in-surance or inability to receive medical care or fill a prescription during the previous 12 months for the par-ent or the child.
The housing domain included questions from the American Housing Survey16and assessed household size
and makeup, current housing status (own/rent/doubled up/homeless), cost of housing, concerns about impend-ing eviction, and previous 12-month experiences with homelessness/doubled up (presence and duration), housing utilities (threatened/shut off/receipt of fuel as-sistance), and housing hazards. Housing hazards within the past 12 months included: roof leaked, problems with electrical wiring, no heat for⬎24 hours, and water leaks in the home from inside (pipes, sinks, toilets) and out-side (walls, roof). Housing hazards within the past 3 months included: none of the toilets worked, any rats or mice in home or building, any cockroach/insect infesta-tion, no running water in the house, and broken utili-ties. A housing problem included either currently home-less or doubled up, utilities shut off during the previous 12 months, or a major structural housing problem as defined by the American Housing Survey and validated in previous research studies.17
The food security domain included the previously validated 8-point food security scale from the Childhood Community Hunger Identification Project (CCHIP).18–20
The CCHIP asks the parent to think about the past 12 months and answer questions about (1) running out of money to buy food, (2) using a limited number of foods to feed the family, (3) adults eating less than they should, (4) adults skipping meals, (5) children eating less than they should, (6) children saying that they were hungry because of lack of food, (7) children skipping meals, and (8) children going to bed hungry because of
lack of food. Additional questions assessed use of food stamps and participation in the Supplemental Nutrition Program for Women, Infants, and Children. A food se-curity problem was defined as food insecure (1– 4 posi-tive responses) or frank hunger (5– 8 posiposi-tive responses) according to the CCHIP scale.
The income security domain used questions from the Philadelphia Survey of Work and Family21and surveys
noted previously.13–15 Questions assessed employment
status (employed/self-employed/out of work [duration]/ homemaker/student/retired/unable to work), reason for difficulty finding/maintaining work, use of job training/ job placement/interest in getting a paid job, and house-hold income, as well as use, duration, and amount of welfare,22Supplemental Security Income, and child
sup-port. Additional questions assessed problems with and reasons for missing work and for missing medical ap-pointments. An income security problem was narrowly defined as being currently unemployed and looking for work.
The intimate partner violence domain included an introduction and 3 questions that were used previously to screen women with young children.10These questions
included the following: “In the past year, have you been emotionally or verbally abused by your partner or some-one important to you; for example, has anysome-one sworn at you, threatened you, or threatened to throw something at you?” “In the past year, have you been hit, slapped, kicked, or otherwise physically hurt by your partner or someone close to you?” and, “Do you feel safe in your current relationship?” Additional questions assessed the type of intimate partner violence experienced and use of medical care or services related to violence. An intimate partner violence problem was defined as verbal or phys-ical abuse during the previous year.
Previous experience with screening and referral was assessed with a series of up to 5 questions for each social domain. Referral need in each domain was ascertained using the following question: “In the past 12 months, have you been given a referral to an agency to help you with your [domain category]?” A response of “yes” or “no, but I wanted a referral,” defined a referral need (versus, “No, and I did not want a referral” or “not sure”). A question at the end of the survey asked, “Think about the survey you have just completed. How would you feel about taking a computer-based survey in your doctor’s waiting room that evaluated a family’s social issues and made referrals to local agencies?” Reply op-tions were (1) welcome it, (2) not mind at all, (3) be mildly annoyed, and (4) be very annoyed.10
Computer Program
The computer program was adapted from the Promote Health Survey11,12with permission of the principal
first name using a single question per screen. The survey consisted of yes/no, multiple-choice, fill-in-the-blank, and checklist questions. A figure on the bottom of the screen tracked the percentage of completion of the sur-vey. Data were collected and stored using Microsoft Ac-cess and Excel 2002/SP-2 (Microsoft Corp, Redmond, WA).
Translation and Testing
The survey wording was translated, back-translated, and refined by professional translators who represented 6 different Spanish-speaking countries. The English ver-sion was at a fifth- to sixth-grade reading level and the Spanish version was at a fourth- to fifth-grade reading level.23A focus group of 13 volunteer parents and health
care providers pilot-tested the computerized question-naire for usability, content, and construct validity.
Analysis
The primary outcome measures were the percentages of families who (1) experienced HRSPs; (2) received screening for social problems, received needed referrals, and found referral agencies helpful; and (3) reported willingness to use computer-based screening and referral for social problems in pediatric settings in the future. Although demographics differed between the 2 clinic sites, the frequencies of HRSPs, the experience with referrals, and acceptability of screening were similar. Therefore, data from the 2 clinic settings were combined to provide a descriptive analysis of the families’ burden of HRSPs, parental experiences with screening and re-ferral, and parental opinions. Between-site differences in demographics and all outcome measures were tested by using the2and Student’sttest when appropriate and are noted when statistically significant differences exist.
Differences in presence of social problems by demo-graphics and household characteristics were tested by using the 2 test. All statistical tests were 2-tailed and considered significant atP⬍.05. All analyses were per-formed using SPSS 11.1 (SPSS, Chicago, IL).
RESULTS
Study Population
During a 5-week period, trained research assistants ap-proached 450 families. A total of 190 did not meet in-clusion criteria. Among the 260 eligible parents, 79% (205 of 260) agreed to participate. Ninety-four percent (193 of 205) of participants completed the entire survey, and an additional 5 completed the HRSP questions but not the demographics (Fig 1). Demographics of eligible parents who refused are not available.
Thirty-four percent (70 of 205) of parents took the survey in Spanish. Of the 193 surveys completed, aver-age time to completion was 20 minutes, and participants answered an average of 123 questions (interquartile range: 117–128). Table 2 depicts demographics of the surveyed participants. Overall, 57% of parents were His-panic and 29% were black. Among respondents, 34% had not completed high school and 62% were immi-grants; 62% had a family income at or below the poverty level.
HRSPs
Of the 198 families who completed all 5 social domains, 162 (82%) hadⱖ1 HRSP. Comorbidity was high: of the 198 families, 28% experienced 1 HRSP, 32% experi-enced 2 HRSPs, and 22% experiexperi-enced ⱖ3 HRSPs. De-mographic variables that correlated with higher risk for having an HRSP are shown in Table 2 and included
FIGURE 1
race/ethnicity (Hispanic [85%] and black [84%] versus white [64%];P ⫽.043), relationship status (single, no partner [89%] versus married [72%]; P ⫽ .021), and percentage of the federal poverty level (FPL) (ⱕ50% FPL [87%] versus⬎200% FPL [52%];P⬍.001). Despite the demographic diversity and differences between sites, the percentage of families withⱖ1 HRSP was similarly high at each clinic: 76% at AHP and 86% at CHC (P⫽.029). Table 3 depicts the specific HRSPs experienced by the families. Problem prevalence in each social domain was based on the number of families who completed that domain’s questions. Statistically significant differences between the sites for specific social problem prevalence occurred in the housing and income domains, as noted next.
Forty-five percent of families (95% confidence inter-val [CI]: 38 –52) had a problem with access to health
care, including no health insurance, unable to receive medical care, or unable to fill a prescription. In addition, 22% relied on “routine care” from either an emergency department or urgent care center or lacked a place for usual medical care.
Housing problems were the most prevalent HRSP (56%; 95% CI: 48 – 62), with a higher prevalence among the CHC participants (62%) compared with the AHP participants (48%; P ⫽ .034). Fifteen percent of the families were either homeless or doubled up; an addi-tional 10% had experienced homelessness within the past year, and 22% expressed concern about being evicted. Eight percent of families had had their utilities shut off during the previous 12 months, and an addi-tional 15% had had their utilities threatened. Forty-four percent of families had ⱖ1 major structural housing problems, and 24% hadⱖ2.16
Overall food insecurity was 39% (95% CI: 31– 45) and was greater among CHC participants (43%) than AHP participants (33%; P ⫽ .017). The CCHIP scale identified 28% of families as “food insecure” (score of 1– 4; limited food availability primarily affecting the par-ent) and an additional 11% of families as “hungry”
TABLE 2 HRSPs Experienced by Families (nⴝ193) in the Preceding 12 Months
Demographic Total (n⫽193),
n(%)
ⱖ1 HRSP, %
P
Mean (SD) age of parent, y 29.3 (6.3) Mean (SD) age of child, y 2.1 (1.9) Parent gender
Female 174 (90) 82
Male 19 (10) 79 .777
Child gender
Female 100 (52) 82
Male 93 (48) 81 .809
Parent race/ethnicitya
Hispanic 110 (57) 85
Black 55 (29) 84
White/mixed/other 28 (15) 64 .043
Parent educationa
No high school degree 66 (34) 85 High school diploma or GED 58 (30) 88
Some college or more 70 (36) 73 .066
Parent immigration statusa
Undocumented/unsure 28 (15) 93
Legal immigrant 90 (47) 83
Born in US 75 (39) 75 .087
Parent relationship status
Single, no partner 61 (32) 89
Single, living separate from partner 31 (16) 94 Single, living with partner 30 (16) 77
Married 71 (37) 72 .021
Median household size, No. of people 4 Income, median, $a 15 314
No income reported 24 (12) 96
ⱕ15 000 84 (44) 87
⬎15 000 85 (44) 72 .006
FPLa
Not calculableb 31 (16) 97
ⱕ50 % 53 (28) 87
ⱕ100 % 37 (19) 92
ⱕ200 % 36 (19) 78
⬎200 % 36 (19) 52 ⬍.001
GED indicates general equivalency diploma.
aStatistically significant difference between clinics (P⬍.05) by2or Student’sttest. bNo income or household size was reported.
TABLE 3 Prevalence of HRSPs
Parameter n(%) 95% CI
No. of HRSPs (N⫽198)
0 36 (18) —
1 55 (28) —
2 63 (32) —
ⱖ3 44 (22) —
Domain and problem (N⫽198–203)a
Access to health care (N⫽203) 92 (45) 38–52 No health insurance for parent 43 (21) 15–26 No health insurance for child 19 (9) 5–13 Unable to receive medical care 39 (19) 13–24 Unable to fill prescription 37 (18) 12–23
Housing (N⫽202)b 113 (56) 48–62
Homeless or living in homeless shelter 14 (7) 3–10
Doubled up 16 (8) 4–11
Utilities shut off 17 (8) 4–12
Major structural housing problems (ⱖ1) 88 (44) 36–50
1 42 (21) 15–26
2 27 (13) 8–18
ⱖ3 19 (9) 5–13
Food security (N⫽201)c 78 (39) 31–45
CCHIP 1–4 (food-insecure) 56 (28) 21–34
CCHIP 5–8 (hungry) 22 (11) 6–15
Income security (N⫽198) 34 (17) 11–22 Unemployed and looking for work 34 (17) 11–22 Intimate partner violence (N⫽198) 28 (14) 9–19
Verbal violence 26 (13) 8–17
Physical violence 13 (7) 3–10
Physical violence within past month 7 (4) 0–6
(score 5– 8; limited food affecting the parent and the child). Eleven percent of families stated that they did not have “enough food to eat today.” Food subsidy use was high; 54% of families were enrolled in the Supplemental Nutrition Program for Women, Infants, and Children, and 40% received food stamps.
Income insecurity was narrowly defined as being “unemployed and looking for work”; 17% of families (95% CI: 11–22) met this criterion. An additional 34 (17%) parents stated that they were interested in getting a paid job. A total of 108 (55%) families had an income of $15 000 or less or no reported income (61%ⱕ100% FPL). Twelve percent of parents reported that their child did not go to the doctor because the parent could not leave school or work, and 18% of parents reported that their child had not gone to the doctor because of finan-cial concerns.
Fourteen percent of parents (95% CI: 9 –19) had ex-perienced intimate partner violence within the past year; 13% reported being “emotionally or verbally abused,” including threats of harm, and 7% reported physical violence. Four percent had experienced physical vio-lence within the past month. Seven percent of parents reported not feeling safe in their current relationship. Of the 28 parents who experienced intimate partner vio-lence, only 5 (18%) had seen a doctor secondary to abuse.
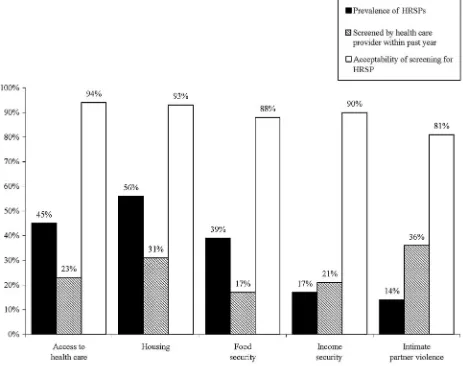
Screening, Referral Need, and Referral Agency Experience Parent-reported screening rates in the previous year were low in all domains. Screening rates by health-related social domains were: access to health care, 23%; housing, 31%; food security, 17%; income security, 21%; and intimate partner violence, 36%. Comprehen-sive screening of families was minimal. Of the 198 fam-ilies who completed all 5 domains, only 2% (5 of 198) had been screened in all 5 domains, and 32% (66 of 198) had not been screened in any domain. Table 4 shows the screening rate, referral need, referral receipt, and referral agency experience. Screening rates between clinics dif-fered only in the housing domain (22% [AHP] vs 39% [CHC];P⫽.037).
Referral need (referral received or wanted) ranged from a low of 15% for intimate partner violence to a
high of 44% for housing. For each domain, referral receipt percentage was calculated with respect to the total number of referrals needed. In aggregate, 143 (70%) of 205 families identified a need for referral inⱖ1 domain, and 101 (49%) of 205 hadⱖ1 unmet referral need. With the exception of access to health care, fewer than half of families received needed referrals in each domain, with a low of 14% for income security and a high of 65% for access to health care.
Of families who reported receiving referrals, the ma-jority contacted the referral agency; the lowest contact rate was for income referrals (55%), and the highest contact rate was for housing referrals (68%). The ma-jority of referred parents found the referral agencies helpful, with the 1 notable exception of agencies that assist with income security, which were found helpful by only 17% (1 of 6) of families. Families found other referral agencies significantly more helpful: helpfulness of agencies that assist with access to health care, 92% (24 of 26); with housing, 71% (12 of 17); with food security, 94% (15 of 16); and with intimate partner violence, 100% (8 of 8).
Screening Desirability
More than 80% of parents said that they would “wel-come” or “not mind at all” inquiries about problems within each domain (Fig 2). When asked specifically about the acceptability of using a computer system to screen and refer families for HRSPs at the pediatrician’s office during a well-child visit, 92% responded that they would “welcome it” or “not mind at all.”
DISCUSSION
This study found that despite high rates of HRSPs, re-ported screening and referral rates were low among families in 2 urban populations. Our research was unique in that it demonstrated the feasibility of using a computer-based questionnaire in pediatric outpatient clinical settings to ask families about HRSPs and referral needs.
Prevalence
Within each social domain, the problems that were iden-tified in this population reflect similar findings in
previ-TABLE 4 HRSP Screening, Referral Need/Receipt, and Referral Agency Experience Within Past 12 Months
Domain Respondents,
N
Screened,n(%) Needed,n(%)a Received,n
(% of Needed)b
Contacted,n
(% of Referred)b
Helpful,n
(% of Contacted)b
Access to health care 203 47 (23) 63 (31) 41 (65) 26 (63) 24 (92)
Housingc 202 63 (31)c 89 (44) 25 (28) 17 (68) 12 (71)
Food security 201 35 (17) 68 (34) 24 (35) 16 (67) 15 (94)
Income security 198 42 (21) 77 (39) 11 (14) 6 (55) 1 (17)
Intimate partner violence 198 71 (36) 30 (15) 14 (47) 8 (57) 8 (100)
aNeeded indicates referral received or wanted. bPercentage of previous column.
ous studies.24–29It is notable that 45% of families have a
problem with access to health care, although they were screened within a health care setting. This is likely a reflection of a high level of access afforded children via MassHealth (Medicaid) and the State Children’s Health Insurance Program but denied to the parents who lack health insurance. Although the correlation between low income and high rates of HRSPs is not surprising, the frequent overlap of multiple problems is significant and likely compounds their impact on pediatric families. Within this study, 54% of families experiencedⱖ2 ma-jor HRSPs, an important finding that was elucidated by comprehensive rather than single-issue screening. Pop-ulations that are screened in nonmedical settings may have even higher rates of HRSPs, because families who are screened within a pediatric clinic already have some level of demonstrated access to health care.
Identification and Referral for HRSPs
Pediatricians may underestimate the prevalence of HRSPs and the value of providing referrals. Our finding that 49%
of families have an unmet referral need demonstrates a gap between what families need and how their physicians are responding. National and local studies have demonstrated screening and referral rates for intimate partner violence as low as 5%8,30; no other known studies have evaluated
screening for other major social problems.
Within this study, when families received referrals, 63% (73 of 115) contacted the agency, and of those, 82% (60 of 73) of the agencies contacted were considered helpful. Previous studies in the medical, social work, and psychol-ogy literature support the utility of referral interventions, including increased rates of health insurance,31,32improved
food security, and increased economic resources.33
Feasibility of Computer-Based Screening and Referral
Can a computer-based screening and referral system within a pediatrician’s office connect families to referral agencies? Sixty-two percent of families stated that they welcomed such a tool, and an additional 30% said that they would not mind at all using it. The Health Belief Model, which informed the conceptual development of
FIGURE 2
this project, describes the probability of an individual taking action to get help with a health problem as a balance among (1) an individual’s perception of his or her susceptibility to and seriousness of the problem, (2) modifying factors that include perceived threats and cues to actions, and (3) the perceived benefits minus the perceived barriers to taking action.34 A computer-based
system that assesses HRSPs and provides feedback as well as actual referrals has the capacity to reinforce a family’s awareness of the HRSPs, provide cues to action that can be reinforced by the pediatrician, explain the benefits of following up with the agencies, and, finally, reduce barriers by providing printed referrals that help families connect with appropriate agencies. Future re-search will evaluate the use and utility of a fully inte-grated screening and referral system and will assess fam-ilies’ desire to share the provided information with their physician and whether to include it within the medical chart.
Previous studies of computer use in medical settings support its acceptance. A study of computer use by fam-ilies in medical settings demonstrated⬎90% support for use of a computer before each medical visit to improve health services delivery.35Other studies have shown that
patient-centered computer systems are an effective means to obtain medical histories,36–38 to make clinical
decisions,39,40 to develop asthma action plans,41 to
im-prove parental knowledge of key pediatric issues,42and
to improve overall delivery of pediatric primary care.43
As stated, this study was performed within the waiting rooms of an AHP and a CHC. Although barriers to using a computer in these settings, including crowded condi-tions and minimal privacy, may seem extremely chal-lenging, 79% of eligible families participated and 94% of participating families completed the survey. We believe that this speaks to the strong desire of families to use computer systems that are designed to help them and their faith in privacy that is afforded to them by the privacy screens and the reinforced confidential nature of the tool. Of note, during the study, both doctors and nurses thanked the research assistants for giving their patients something meaningful to do while waiting to be seen.
Strengths and Limitations
The primary strength of this study was its comprehen-sive analysis of HRSPs in a broad array of domains col-lectively. In addition, it was conducted in the real-world settings of community and academic-based clinics using a computer. Although the study is limited by a relatively small sample size from 2 clinics in a single city, the populations studied reflect 2 of the largest minority eth-nic groups in the United States (black and Hispaeth-nic). Both of these clinics have onsite social workers and
missions to serve the underserved; therefore, the extent of social problems and referral rates may actually be greater than elsewhere. The generalizability of these findings to other clinical practices in other cities with potentially different social problems and a different range of social service agencies available will need addi-tional study.
Self-reported responses may be affected by social de-sirability bias. The effect of social dede-sirability bias might have led to families’ minimizing problems or giving higher ratings than warranted on helpfulness of social services. However, previous studies of computer-based evaluation of sensitive and personal issues suggested that high rates of “honest” reporting can be expected by this modality.39Recall bias may lead parents to
underes-timate (or overesunderes-timate) whether they had been screened by a clinician for each of the HRSPs.
Another limitation is the lack of formal assessment of the burden on the clinics of screening families. However, active family self-assessment using a computer in the waiting room is likely to be more systematic and less time-consuming for the clinician than traditional assess-ment by interview.
CONCLUSIONS
Urban families with young children bear a significant burden of HRSPs that remain largely unobserved and unattended by pediatric practices. Among families who reported receiving referrals, most said that they made contact with designated agencies and found the agencies helpful in addressing these challenges. Pediatric practices have the potential to play an important role in enabling families to identify HRSPs and receive referrals to com-munity resources. Finally, this study demonstrates the feasibility of using a computer-based system to imple-ment family self-assessimple-ment in a routine outpatient set-ting and may thereby help address some of the barriers in providing these assessments and referrals in pediatric practices.
ACKNOWLEDGMENTS
Dr Fleegler was supported by Agency for Healthcare Research and Quality grant T32 HS000063 to the Har-vard Pediatric Health Services Research Fellowship Pro-gram. We are grateful for additional funding support provided by the American Medical Association Founda-tion Seed Grant, Boston Medical Center Department of Pediatrics Kids’ Fund, and Children’s Hospital Boston, Division of General Pediatrics
program-ming; Henry Feldman, PhD, for statistical support; Ma-lini Sur and Laura Arandes for research assistance; and Marisa Brett-Fleegler, MD, for editing.
REFERENCES
1. American Academy of Pediatrics.75 Years of Caring 1930 –2005: Celebrating 75 Years in Pediatrics.Elk Grove Village, IL: American Academy of Pediatrics; 2005
2. Sandel M, Zotter J. How substandard housing affects children’s health.Contemp Pediatr.2000;17:134 –148
3. Bunker JP, Gomby DS, Kehrer BH.Pathways to Health: The Role of Social Factors. Menlo Park, CA: Henry J. Kaiser Family Foundation; 1989
4. American Academy of Pediatrics, Committee on Child Abuse and Neglect. The role of the pediatrician in recognizing and intervening on behalf of abused women.Pediatrics.1998;101: 1091–1092
5. Werner M, Joffe A, Graham A. Screening, early identification, and office-based intervention with children and youth living in substance-abusing families.Pediatrics.1999;103:1099 –1112 6. Pbert L, Moolchan E, Muramoto M, et al. The state of
office-based interventions for youth tobacco use. Pediatrics. 2003; 111(6). Available at: www.pediatrics.org/cgi/content/full/111/ 6/e650
7. American Academy of Pediatrics, Committee on Psychosocial Aspects of Child and Family Health. The new morbidity revisited: a renewed commitment to the psychosocial aspects of pediatric care.Pediatrics.2001;108:1227–1230
8. Borowsky I, Ireland M. Parental screening for intimate partner violence by pediatricians and family physicians. Pediatrics. 2002;110:509 –516
9. Newman JD, Sheehan KM, Powell EC. Screening for intimate-partner violence in the pediatric emergency department. Pedi-atr Emerg Care.2005;21:79 – 83
10. Kahn RS, Wise PH, Finkelstein JA, Bernstein HH, Lowe JA, Homer CJ. The scope of unmet maternal health needs in pe-diatric settings.Pediatrics.1999;103:576 –581
11. Rhodes KV, Lauderdale DS, He T, Howes DS, Levinson W. “Between me and the computer”: increased detection of inti-mate partner violence using a computer questionnaire.Ann Emerg Med.2002;40:476 – 484
12. Rhodes KV, Lauderdale DS, Stocking CB, Howes DS, Roizen MF, Levinson W. Better health while you wait: a controlled trial of a computer-based intervention for screening and health promotion in the emergency department. Ann Emerg Med. 2001;37:284 –291
13. National Center on Health Statistics.National Health Interview Survey. Washington, DC: US Department of Health and Human Services; 1995
14. Centers for Disease Control and Prevention. Behavioral Risk Factor Surveillance System. Washington, DC: US Department of Health and Human Services; 2001
15. Center for Survey Research.Study of Child Care Experiences and Needs. Boston, MA: University of Massachusetts Boston; 2001 16. US Census Bureau.The American Housing Survey. Washington, DC: Department of Housing and Urban Development; 1994 17. Sharfstein J, Sandel M, Kahn R, Bauchner H. Is child health at
risk while families wait for housing vouchers? Am J Public Health.2001;91:1191–1192
18. Weinreb L, Wehler C, Perloff J, et al. Hunger: its impact on children’s health and mental health. Pediatrics.2002;110(4). Available at: www.pediatrics.org/cgi/content/full/110/4/e41 19. Wehler C, Scott R, Anderson J.Community Childhood Hunger
Identification Project: A Survey of Childhood Hunger in the United States. Washington, DC: Food Research and Action Center; 1991
20. Wehler C.Community Childhood Hunger Identification Project: New Haven Risk Factor Study. Hartford, CT: Connecticut Association for Human Services; 1986
21. Cress J, Fagan J.The Philadelphia Survey of Child Care and Work. Philadelphia, PA: Temple University; 2003
22. Administration for Children & Families, Office of Family As-sistance, US Department of Health and Human Services. Wel-come to the Office of Family Assistance. Available at: www. acf.hhs.gov/programs/ofa. Accessed October 17, 2003 23. Flesch-Kincaid Grade Level Score[computer program]. Microsoft
Word 2002 SP-2. Redmond, WA: Microsoft Corp; 2002 24. Duchon L, Schoen C, Doty MM, Davis K, Strumpf E,
Brueg-man S.Security Matters: How Instability in Health Insurance Puts U.S. Workers at Risk—Findings from the 2001 Health Insurance Survey. New York, NY: Commonwealth Fund; 2001. Publica-tion 512
25. Child Trends Databank. Health care coverage. Available at: www. childtrendsdatabank.org/indicators/26HealthCareCoverage.cfm. Accessed April 26, 2006
26. Krieger J, Higgins D. Housing and health: time again for public health action.Am J Public Health.2002;92:758 –768
27. Alaimo K, Olson CM, Frongillo EA Jr. Food insufficiency and American school-aged children’s cognitive, academic, and psy-chosocial development.Pediatrics.2001;108:44 –53
28. Nord A, Stevenson C.Household Food Security in the United States. Washington, DC: US Department of Agriculture; 2003 29. Novello AC, Rosenberg M, Saltzman L, Shosky J. From the
Surgeon General, US Public Health Service.JAMA.1992;267: 3132
30. Kerker BD, Horwitz SM, Leventhal JM, Plichta S, Leaf PJ. Identification of violence in the home: pediatric and parental reports.Arch Pediatr Adolesc Med.2000;154:457– 462
31. Gordon JA, Dupuie TA. Child health insurance outreach through the emergency department: a pilot study.Acad Emerg Med.2001;8:1088 –1090
32. Gordon JA, Emond JA, Camargo CA Jr. The State Children’s Health Insurance Program: a multicenter trial of outreach through the emergency department.Am J Public Health.2005; 95:250 –253
33. Wise PH, Wampler NS, Chavkin W, Romero D. Chronic illness among poor children enrolled in the temporary assistance for needy families program. Am J Public Health. 2002;92: 1458 –1461
34. Janz NK, Champion VL, Strecher V. The health belief model. In: Glanz K, Rimer BK, Lewis FM, eds. Health Behavior and Health Education: Theory, Research, and Practice. 3rd ed. San Fran-cisco, CA: Jossey-Boss; 2002:45– 67
35. Sciamanna C, Diaz J, Myne P. Patient attitudes toward using computers to improve health services. BMC Health Serv Res. 2002;2:1– 6
36. Bobula J, Anderson LS, Riesch SK, et al. Enhancing survey data collection among youth and adults: use of handheld and laptop computers.Comput Inform Nurs.2004;22:255–265 37. Porter S, Kohane I, Goldmann D. Parents as partners in
ob-taining the medication history.J Am Med Inform Assoc.2005; 12:299 –305
38. Turner C, Ku L, Rogers SM, Lindberg LD, Pleck JH, Sonenstein FL. Adolescent sexual behavior, drug use, and violence: in-creased reporting with computer survey technology.Science. 1998;280:867– 873
40. Hunt D, Haynes RB, Hanna SE, Smith K. Effects of computer-based clinical decision support systems on physician perfor-mance and patient outcomes.JAMA.1998;280:1339 –1346 41. Porter S, Cai Z, Gribbons W, Goldmann DA, Kohane IS. The
asthma kiosk: a patient-centered technology for collaborative decision support in the emergency department. J Am Med Inform Assoc.2004;11:458 – 467
42. Sanghavi D. Taking well-child care into the 21st century: a novel, effective method for improving parent knowledge using computerized tutorials. Arch Pediatr Adolesc Med. 2005;159: 482– 485
DOI: 10.1542/peds.2006-1505
2007;119;e1332
Pediatrics
Eric W. Fleegler, Tracy A. Lieu, Paul H. Wise and Sharon Muret-Wagstaff
Families' Health-Related Social Problems and Missed Referral Opportunities
Services
Updated Information &
http://pediatrics.aappublications.org/content/119/6/e1332 including high resolution figures, can be found at:
References
http://pediatrics.aappublications.org/content/119/6/e1332#BIBL This article cites 26 articles, 7 of which you can access for free at:
Subspecialty Collections
y_sub
http://www.aappublications.org/cgi/collection/psychiatry_psycholog
Psychiatry/Psychology
ub
http://www.aappublications.org/cgi/collection/psychosocial_issues_s
Psychosocial Issues
al_issues_sub
http://www.aappublications.org/cgi/collection/development:behavior
Developmental/Behavioral Pediatrics
following collection(s):
This article, along with others on similar topics, appears in the
Permissions & Licensing
http://www.aappublications.org/site/misc/Permissions.xhtml in its entirety can be found online at:
Information about reproducing this article in parts (figures, tables) or
Reprints
DOI: 10.1542/peds.2006-1505
2007;119;e1332
Pediatrics
Eric W. Fleegler, Tracy A. Lieu, Paul H. Wise and Sharon Muret-Wagstaff
Families' Health-Related Social Problems and Missed Referral Opportunities
http://pediatrics.aappublications.org/content/119/6/e1332
located on the World Wide Web at:
The online version of this article, along with updated information and services, is
by the American Academy of Pediatrics. All rights reserved. Print ISSN: 1073-0397.