University of Pennsylvania
ScholarlyCommons
Publicly Accessible Penn Dissertations
1-1-2016
Characterization of Solid Lewis Acids in Biomass
Conversion Reactions
Jingye Yu Yu
University of Pennsylvania, [email protected]
Follow this and additional works at:
http://repository.upenn.edu/edissertations
Part of the
Chemical Engineering Commons
This paper is posted at ScholarlyCommons.http://repository.upenn.edu/edissertations/2122
For more information, please [email protected].
Recommended Citation
Yu, Jingye Yu, "Characterization of Solid Lewis Acids in Biomass Conversion Reactions" (2016).Publicly Accessible Penn Dissertations. 2122.
Characterization of Solid Lewis Acids in Biomass Conversion Reactions
Abstract
Solid Lewis acids can be very selective in many important biomass reactions. Unfortunately, our
understanding of solid Lewis acidity is very poor, making it difficult to design and select specific catalysts for a particular reaction. In this dissertation, characterization and examination of solid Lewis acids were performed through home-built instruments including Temperature-Programmed Desorption
(TPD)/Thermogravimetric Analysis (TGA), calorimetry, and a multiphase continuous flow reactor. A number of important catalyst families were examined in this work, including bulk metal oxides, ion-exchanged zeolites and framework substitution Lewis acid zeolites. In this work, it has been shown that the adsorption features obtained from TPD-TGA, calorimetry experiments are very helpful in understanding reaction results from reactor study. Adsorption studies are able to determine Lewis site density, relative adsorption strength and activation energy of monomolecular reactions which are extremely valuable information for catalysts. Biomass reactions over Lewis acid catalysts are through multiple and complicated steps. Works in my study provides a valuable method to understand solid Lewis acidity in biomass reactions through an adsorption feature investigation.
Degree Type Dissertation
Degree Name
Doctor of Philosophy (PhD)
Graduate Group
Chemical and Biomolecular Engineering
First Advisor Raymond J. Gorte
Keywords
Adsorption, Bronsted Acid, Catalysis, Characterization, Lewis Acid, Reaction
Subject Categories Chemical Engineering
CHARACTERIZATION OF SOLID LEWIS ACIDS IN BIOMASS CONVERSION
REACTIONS
Jingye Yu
A DISSERTATION
in
Chemical and Biomolecular Engineering
Presented to the Faculties of the University of Pennsylvania
In Partial Fulfillment of the Requirements for the
Degree of Doctor of Philosophy
2016
Supervisor of Dissertation
________________________
Raymond J. Gorte,
Professor of Chemical and Biomolecular Engineering, University of Pennsylvania
Graduate Group Chairperson
________________________
John C. Crocker,
Professor of Chemical and Biomolecular Engineering, University of Pennsylvania
Dissertation Committee
John M. Vohs, Professor of Chemical and Biomolecular Engineering, University of Pennsylvania
Robert Riggleman, Assistant Professor of Chemical and Biomolecular Engineering, University of Pennsylvania
ii
ACKNOWLEDGMENT
I would like to thank my advisor, Professor Raymond J. Gorte, for his time and effort
guiding and supporting me through my Ph.D. and the effort conducting my research. Catalysis is
a fascinating research field, I have gained great insights and understanding of this subject under
his guidance and I will always be grateful for the experience working with him.
Thanks are also due to my official committee members Professor John M. Vohs,
Professor Wei Fan and Professor Robert Riggleman for their valuable suggestions and advice
during the past five years. I also owe much to my colleagues in the Department of Chemical and
Biomolecular Engineering for always being there to bounce an idea off or to join me in my
extracurricular activities.
Finally, I would like to dedicate my dissertation of my parents and my fiancée who have
iii
ABSTRACT
CHARACTERIZATION OF SOLID LEWIS ACIDS IN BIOMASS CONVERSION
REACTIONS
Jingye Yu
Raymond J Gorte
Solid Lewis acids can be very selective in many important biomass reactions. Unfortunately,
our understanding of solid Lewis acidity is very poor, making it difficult to design and select
specific catalysts for a particular reaction. In this dissertation, solid Lewis acids were
characterized using Temperature-Programmed Desorption (TPD)/Thermogravimetric Analysis
(TGA), calorimetry, and a multiphase continuous flow reactor. A number of important catalyst
families were examined in this work, including bulk metal oxides, ion-exchanged zeolites and
framework substituted Lewis acid zeolites. It has been shown that the adsorption properties
obtained from TPD-TGA and calorimetry experiments are very helpful in understanding reaction
results. Adsorption studies are able to determine Lewis site density, relative adsorption strength
and activation energies of monomolecular reactions, providing are extremely valuable
information for catalysts. Biomass reactions over Lewis acid catalysts occur through multiple,
complicated steps. My studies provide a basis for understanding solid Lewis acidity in biomass
iv
TABLE OF CONTENTS
ACKNOWLEDGMENT ... ii
ABSTRACT ... iii
LIST OF TABLES ... viii
LIST OF FIGURES ... x
Chapter 1.
Introduction ... 1
1.1 Background ... 1
1.2 Definition ... 2
1.3 Solid Lewis Acids in Biomass Reactions ... 2
1.3.1 Bulk Metal Oxides ... 3
1.3.2 Framework Substituted Lewis Acid Zeolites ... 3
1.3.3 Ion-exchange Zeolites ... 3
1.4 Mechanisms of solid Lewis acids as catalysts in biomass reactions ... 4
1.4.1 Glucose Isomerization, MPV reaction and Baeyer-Villiger oxidation reaction over Sn-BEA ... 4
1.4.2 Alcohol dehydration over -Al2O3 ... 7
1.4.3 Summary of mechanisms for Lewis acids in Biomass reactions ... 10
1.5 Approaches to Study Solid Brønsted Acidity by Adsorption Measurements ... 10
1.5.1 Site densities and stoichiometric adsorption complexes ... 10
1.5.2 Calorimetric measurements ... 11
1.5.3 Reaction Chemistry ... 14
1.5.4 The Approaches to study solid Lewis Acidity ... 16
1.6 Scope of the Thesis ... 16
v
2.1 Characterization Techniques ... 19
2.1.1 TPD-TGA measurement ... 19
2.1.2 Calorimetric measurement ... 22
2.1.3 FTIR ... 23
2.2 Tubular flow reactor ... 23
2.3 Catalyst Preparation ... 24
2.3.1 Alkali-exchanged zeolite ... 25
2.3.2 Dealumination of a BEA zeolite ... 25
Chapter 3.
Lewis acidity of metal-oxides and metal-oxides over SBA-15 and the
effect of acidity on HMF etherification reaction ... 26
3.1 Introduction ... 26
3.2 Experimental methods ... 29
3.2.1 Materials ... 29
3.2.2 Experimental ... 30
3.3 Results and discussion ... 32
3.3.1 Isopropylamine adsorption ... 32
3.3.2 Alcohol dehydration over metal oxides ... 34
3.3.3 HMF etherification reaction studies ... 39
3.4 Summary ... 44
Chapter 4.
An Examination of Alkali-Exchanged BEA Zeolites as Possible
Lewis-Acid Catalysts ... 45
4.1 Introduction ... 45
4.2 Experimental ... 47
4.3 Results ... 48
vi
4.3.2 Adsorption studies of 2-propylamine and pyridine ... 51
4.3.3 Adsorption studies of acetonitrile ... 56
4.3.4 Adsorption of 2-Methyl-2-Propanol and Diethyl Ether ... 59
4.3.5 Liquid-Phase Reductive Etherification of HMF ... 63
4.4 Discussion ... 64
4.5 Summary ... 65
Chapter 5.
Adsorption Study of CH
4on ZSM-5, MOR, and ZSM-12 Zeolites ... 66
5.1 Introduction ... 66
5.2 Methods ... 69
5.2.1 Experimental ... 69
5.2.2 Calculations ... 70
5.3 Results and Discussion ... 74
5.3.1 H-ZSM-5 ... 74
5.3.2 MOR and MTW ... 85
5.4 Summary ... 93
Chapter 6.
Adsorption and Reaction Properties of SnBEA, ZrBEA, and H-BEA
for Formation of p-Xylene from DMF and Ethylene ... 94
6.1 Introduction ... 94
6.2 Experimental Methods ... 95
6.3 Results ... 98
6.3.1 Adsorption Studies ... 99
6.3.2 Reaction Measurements ... 104
6.4. Discussion ... 112
6.5. Summary ... 113
vii
viii
LIST OF TABLES
Table 3.1: TPD-TGA desorption peaks of the alkenes, experimental activation energies and BET surface areas of the oxides. The values of alcohol dehydration on γ-Al2O3 have been taken from ref [19] ... 35
Table 3.2: Site densities and BET surface area of the catalyst sample used in this study ... 39
Table 3.3: Turnover rates and product selectivities of HMF etherification with IPA at 413 Ka ... 40
Table 5.1: Zeolite samples used in this study. ... 69
Table 5.2: Equilibrium constants for adsorption of CH4 on the four H-ZSM-5 samples at 195 K, determined from the slope of the isotherms near zero coverage. ... 75
Table 5.3: Calculated enthalpy of adsorption for CO and CH4 (in kJ/mol) on Brønsted and non-Brønsted forms of two sites in ZSM-5 at 195 K. ... 81
Table 5.4: Calculated binding energy (ZPE corrected) values for CO and CH4 (in eV) on
Brønsted and non-Brønsted forms of two sites in ZSM-5 (1eV ~ 96.5 kJ/mol). ... 81
Table 5.5: Calculated enthalpy of adsorption for CH4 (in kJ/mol) on the T12-O8-T3 Brønsted and non-Brønsted forms of ZSM-5 ... 82
Table 5.6: Difference in CH4 binding energies between Brønsted and non-Brønsted T7-O17-T8 site of ZSM-5 using different functionals and dispersion treatments ... 83
Table 5.7: Difference in methane binding energies between Brønsted and non-Brønsted T12-O26-T12 site of ZSM-5 using different functionals and dispersion treatments. ... 84
Table 5.8: Enthalpy of adsorption of CH4, O2, and Ar in the two adsorption regions of MOR at 195 K. All values are in kJ/mol. ... 89
Table 5.9: ZPE corrected binding energy of CH4, O2, and Ar in the two adsorption regions of MOR. All binding energy values are in eV (1eV ~ 96.5 kJ/mol). ... 90
Table 5.10: Enthalpy of adsorption of CH4, O2, and Ar in ZSM-12 at 195 K. All energy values are in kJ/mol. ... 92
Table 5.11: ZPE corrected binding energy of CH4, O2, and Ar in ZSM-12. All binding energy values are in eV (1eV ~ 96.5 kJ/mol). ... 92
ix
Table 6.2: Rates for 2-wt% 2,5-dimethylfuran in heptane with ethylene as a function of space time at 700 K. ... 105
Table 6.3: results on Sn-BEA at 650 K with different partial pressure of C2H4 and
2,5-dimethylfuran ... 106
Table 6.4: Reaction rates for 0.1g H-BEA and Zr-BEA under 55 bar at different temperature with different partial pressure of C2H4 and 2,5-dimethylfuran ... 111
Table 6.5: Reaction results for different temperature at 55 bar, gas flow rate 25ml/min, liquid flow rate 0.1ml/min, 0.1g catalysts (H-BEA, Sn-BEA, Zr-BEA), 2% 2,5-dimethylfuran
x
LIST OF FIGURES
Figure 1.1: Glucose isomerization mechanism by way of intramolecular hydride transfer in
presence of SnBEA [14] ... 5
Figure 1.2: Mechanism of MPV reaction through SnBEA [16]. ... 6
Figure 1.3: SnBEA catalyzed Baeyer–Villiger reaction mechanism [18] ... 7
Figure 1.4: Activation energy of experimental results (■), theoretical results involving dehydration on a two-coordinated (●) and three-coordinated (○) O atom vs PA [19] ... 8
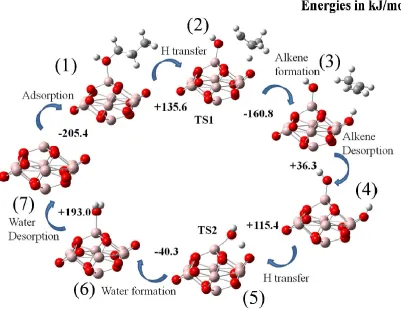
Figure 1.5: Scheme of 1-propanol dehydration reaction involving a tri-coordinated Al Lewis-acid site and a two-coordinated O of γ-Al2O3. The steps are: 1) adsorption, 2) dehydration TS, 3) Alkene formation, 4) Alkene desorption, 5) water formation TS, 6) water formation, and 7) water desorption. ... 9
Figure 1.6: Differential heats of adsorption for pyridine on three H-MFI samples with varying Al contents. The drops in the heats occur at the Brønsted site densities for each sample [36] ... 12
Figure 1.7: Plot of the heat of formation of the 1:1 complex in H-MFI versus (□) pyridines (▲) amines, and (○) acetonitrile for their (a) the enthalpy of protonation in aqueous solutions; (b) the gas-phase proton affinities ... 13
Figure 1.8: Potential energy diagram of alcohol/H-MFI interactions. The adsorption of alcohols and olefins on the zeolite is assumed to occur through proton transfer, allowing the use of known proton affinities to calculate relative heats of formation [30] ... 15
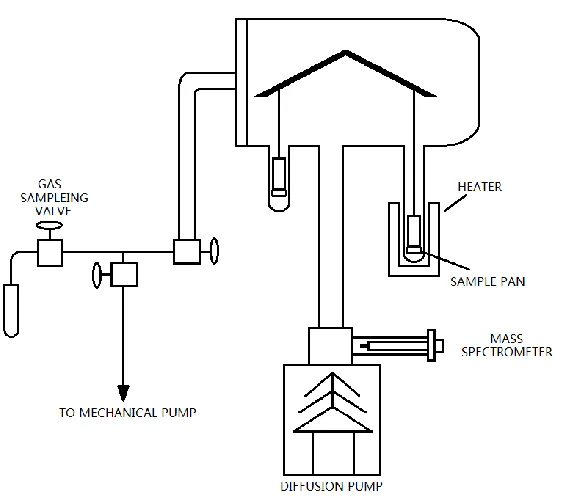
Figure 2.1: Schematic diagram of TPD-TGA system ... 19
Figure 2.2: TPD-TGA of 1-propanol over TiO2 ... 21
Figure 2.3: Schematic diagram of calorimetric system... 22
Figure 2.4: Schematic diagram of continuous flow reactor ... 24
Figure 3.1: (a) Direct etherification of HMF, (b) one-pot reductive etherification of HMF via hydrogenation, (c) transfer hydrogenation via Meerwein–Ponndorf–Verley reaction, and (d) reductive etherification of HMF via transfer hydrogenation ... 27
xi
Figure 3.3: TPD-TGA for 2-propylamine over (a) γ-Al2O3 (b) ZrO2 (c) TiO2 (d) 10 wt%
Al2O3/SBA-15 (e) 10 wt% ZrO2/SBA-15 (f) 10 wt% TiO2/SBA-15. For 2-propylamine, the peaks correspond to 2-propylamine (m/z=44), propene (m/z=41) and amine (m/z=17) ... 33
Figure 3.4: TPD-TGA results for 1-propanol, 2-propanol and 2-methyl-2-propanol over TiO2 and ZrO2. The corresponding TPD-TGA results over γ-Al2O3 can be found in ref[19]. For 1-propanol, the peaks correspond to 1-propanol (m/z=31) and propene (m/z=41); for 2-propanol, the peaks are for propanol (m/z=45) and propene (m/z=41); for methyl-propanol, the peaks are 2-methyl-2-propanol (m/z=59) and butane (m/z=41) ... 34
Figure 3.5: TPD-TGA results for 1-propanol over (a) γ-Al2O3 (b) Al2O3-SBA15 (c) ZrO2 (d) ZrO2-SBA15. For 1-propanol, the peaks correspond to 1-propanol (m/z=31) and propene
(m/z=41)... 37
Figure 3.6: HMF conversion and product distributions over different catalysts as a function of temperature and catalyst loading ... 42
Figure 4.1: Calorimetric data for CO and O2 adsorption on Li-BEA and for CO on Na-BEA, K-BEA and SnK-BEA. The measurements were performed at 195 K. ... 50
Figure 4.2: TPD-TGA results for 2-propylamine on (a) SiBEA, (b) SnBEA (c) Li-BEA, (d) Na-BEA, and (e) K-BEA. For 2-propylamine TPD, the peaks correspond to 2-propylamine (m/z=44), propene (m/z=41) and amine (m/z=17). Deamination reaction is not observed on any of these samples ... 52
Figure 4.3: TPD-TGA results for pyridine on (a) SiBEA, (b) SnBEA (c) Li-BEA, (d) Na-BEA, and (e) K-BEA. For pyridine TPD, the peak correspond to pyridine (m/z=52). ... 53
Figure 4.4: FTIR spectra of pyridine adsorbed on (i) H-BEA, (ii) SiBEA (iii) SnBEA (iv) Li-BEA, (v) Na-Li-BEA, and (vi) K-BEA. ... 55
Figure 4.5: TPD-TGA results for acetonitrile on (a) SiBEA zeolite, (b) SnBEA (c) Li-BEA, (d) Na-BEA, and (e) K-BEA. For acetonitrile TPD, the peak correspond to acetonitrile (m/z=41). .. 57
Figure 4.6: FTIR spectra of CD3CN adsorbed on (i) SnBEA, (ii) Li-BEA, (iii) Na-BEA, and (iv) K-BEA. ... 58
Figure 4.7: TPD-TGA results for diethyl ether on (a) SiBEA, (b) SnBEA (c) Li-BEA, (d) Na-BEA, and (e) K-BEA. For diethyl ether TPD, the peak correspond to diethyl ether (m/z=31). .... 60
Figure 4.8: TPD-TGA results for 2-methyl-2-propanol on (a) SiBEA, (b) SnBEA (c) Li-BEA, (d) Na-BEA, and (e) K-BEA. For propanol TPD, the peaks correspond to 2-methyl-2-propanol (m/z=59), 2-methyl-2-propene (m/z=56) and water (m/z=18) ... 62
Figure 5.1: Differential heats for CH4 adsorption on the different H-ZSM-5 samples at 195 K. (a) (●)H-ZSM-5(50) and (○)H-ZSM-5(280). (b) (◆) ZSM-5(F,Si) and (◇)H-ZSM-5(F,Al). ... 74
xii
Figure 5.3: Zeolite ZSM-5 with the most stable location of Brønsted site (Al7-O17-Si8). The left hand side shows the view perpendicular to the axis of the straight channel. The right hand side explicitly shows the structure along the axis of the straight channel. The dashed line indicates a hydrogen bond between the Brønsted proton and a nearby oxygen atom. Key: Oxygen ( ), silicon ( ), aluminum ( ), and hydrogen ( ). ... 78
Figure 5.4: Zeolite ZSM-5 with a Brønsted site (Al12-O26-Si12) at the intersection of straight and sinusoidal channels. The left hand side shows the view perpendicular to the axis of the straight channel. The right hand side explicitly shows the structure along the axis of the straight channel. Key: Oxygen ( ), silicon ( ), aluminum ( ), and hydrogen ( ). ... 78
Figure 5.5: Preferred CH4 adsorbed state on T7-O17-T8 location with a Brønsted site (left) and in purely siliceous form (right) in zeolite ZSM-5. Two views (top and bottom) are shown for comparison on the CH4 location in the presence and absence of Brønsted proton. Key: Oxygen ( ), silicon ( ), aluminum ( ), carbon ( ), and hydrogen ( ). ... 79
Figure 5.6: Preferred CH4 adsorbed state on T12-O26-T12 location with a Brønsted site (left) and in purely siliceous form (right) in zeolite ZSM-5. Key: Oxygen ( ), silicon ( ), aluminum ( ), carbon ( ), and hydrogen ( ). ... 79
Figure 5.7: Preferred CO adsorbed state on T7-O17-T8 location with a Brønsted site (left) and in purely siliceous form (right) in zeolite ZSM-5. Key: Oxygen ( ), silicon ( ), aluminum ( ), carbon ( ), and hydrogen ( ). ... 80
Figure 5.8: Preferred CO adsorbed state on T12-O26-T12 location a with Brønsted site (left) and in purely siliceous (right) form of zeolite ZSM-5. Key: Oxygen ( ), silicon ( ), aluminum ( ), carbon ( ), and hydrogen ( ). ... 80
Figure 5.9: Zeolite ZSM-5 with the most stable location of Brønsted site (Al7-O17-Si8). The left hand side shows the view perpendicular to the axis of the straight channel. The right hand side explicitly shows the structure along the axis of the straight channel. The dashed line indicates a hydrogen bond between the Brønsted proton and a nearby oxygen atom. Key: Oxygen ( ), silicon ( ), aluminum ( ), and hydrogen ( ). ... 83
Figure 5.10: Differential heats of adsorption for CH4 at 195 K on (■) H-MOR and (▲ )H-ZSM-12. ... ………...85
Figure 5.11: Differential heats of adsorption for O2 at 195 K on (■) H-MOR and (▲) H-ZSM-12. ... 87
Figure 5.12: Differential heats of adsorption for Ar at 195 K on (■) H-MOR and (▲) H-ZSM-12. ... 88
Figure 5.13: Siliceous mordenite (MOR) showing the channels along z axis. Two channels with eight (8 MR) and twelve (12 MR) membered-ring openings and a side pocket with eight
xiii
Figure 5.14: Most stable adsorption structure of: (a) methane in 12 MR channel, (b) methane in 8MR side pockets, (c) oxygen in 12 MR channel, (d) oxygen in 8 MR side pockets, (e) argon in 12 MR channel, and (f) argon in 8 MR side pockets of MOR. Key: Oxygen ( ), silicon ( ), carbon ( ), hydrogen ( ), and argon ( ). ... 90
Figure 5.15: Siliceous ZSM-12 showing the channel along z axis. Adsorption is in the channel with 12 membered ring opening (12 MR channel). Key: Oxygen ( ) and silicon ( ). ... 91
Figure 5.16: Most stable adsorption structure of (a) methane, (b) oxygen, and (c) argon in the 12 MR channels of ZSM-12. Key: Oxygen ( ), silicon ( ), carbon ( ), argon ( ), and hydrogen ( ). ... 91
Figure 6.1: TPD-TGA of diethylether on (a) H-BEA, (b) SnBEA, and (c) ZrBEA. The peaks corresponds to diethylether (m/e=28, 31), ethene (m/e=28), and water (m/e=18). ... 99
Figure 6.2: TPD-TGA of 2,5-dimethylfuran on (a) SiBEA, (b) SnBEA, (c) ZrBEA, and (d) H-BEA. Peaks correspond to 2,5-dimethylfuran (m/e=41, 96) and oligomers (m/e=41). ... 100
Figure 6.3: TPD-TGA of 2,5-hexanedione at high coverage on (a) SiBEA and (b) H-BEA. Peaks correspond to 2,5-hexanedione (m/e=99), 2,5-dimethylfuran (m/z=96), water (m/e=18) and oligomers (m/e=41). ... 102
Figure 6.4: TPD-TGA of 2,5-hexanedione at low coverage on (a) H-BEA, (b) SnBEA, and (c) ZrBEA. Peaks correspond to 2,5-hexanedione (m/e=99), 2,5-dimethylfuran (m/e=96), water (m/e=18), and oligomers (m/e=41). ... 103
Figure 6.5: TPD-TGA of p-xylene on (a) SiBEA, (b) H-BEA, (c) SnBEA, and (d) ZrBEA. .... 104
Figure 6.6: Turn over frequency versus the product of c(C2H4) and c(DMF) on Sn-BEA at 650 K ... 107
Figure 6.7: Turn over frequency vs time on 0.1 g H-BEA at 625 K, on 0.1g ZrBEA at 650 K, and on SnBEA at 650 K. The total pressure was 55 bar. ... 108
Figure 6.8: Turn over frequency vs the product of c(C2H4) and c(DMF), for 0.1 g H-BEA and ZrBEA at 55 bar ... 109
1
Chapter 1.
Introduction
1.1 Background
Acid-catalyzed biochemical transformations are among the most important biomass
conversion reactions. While these reactions are usually carried out with homogeneous phase
acids, heterogeneous solid acids would have significant advantages since the solids are less
corrosive, more environmentally friendly and easily separated from reactants. Much work has
gone into understanding solid Brønsted acids due to their importance in refinery reactions, such
as hydrocarbon cracking, olefin oligomerization, and aromatic alkylations. However, Brønsted
sites tend to be unselective for many reactions involving biomass molecules due to the molecules
being highly functionalized. Highly functionalized molecules tend to polymerize on the surface of
Brønsted sites.
By comparison, solid Lewis acids can be very selective. Unfortunately, our understanding of
solid Lewis acidity is very poor, making it difficult to design and select specific catalysts for a
particular reaction. The goal of my Ph.D. research is to develop a better understanding of solid
Lewis acids in biomass conversion and to devise methods for characterizing solid Lewis acidity.
To study this, I built instruments for simultaneous Temperature-Programmed Desorption
(TPD)/Thermogravimetric Analysis, calorimetry, and a multiphase continuous flow reactor for
characterization and examination of solid Lewis acids. I used these techniques to characterize a
number of important catalyst families were examined in this work, including bulk metal oxides,
ion-exchanged zeolites and framework substitution Lewis acid zeolites. These advances will help
2
1.2 Definition
A brief review of definitions for Brønsted and Lewis acids is necessary before discussing
methods and approaches. Brønsted acids are defined as proton donors [1]:
1.1)
In aqueous solutions, the strength of an acid is usually defined by the equilibrium
constant: pKa = − log10𝐾𝑎where Ka is the equilibrium constant for Equation 1.1). For gas-phase
acids, Brønsted acidity is measured in terms of proton affinity (PA=H of Equation 1.1)) or
gas-phase basicity (GB=G of Equation 1.1)). Although GB should be directly related to pKa,
solvent effects often dominate the energetics of proton transfer in solutions. In most cases, PA
and GB are used to extract information on the effects of the solvent.
Lewis acids are electron-pair acceptors, as shown in Equation 1.2).
1.2)
Similar to Brønsted acidity, the energetics of Equation 1.2), either H or G, can be used
to define the strength of a Lewis acid [2]. However, problem of Equation 1.2) is that it can be
used to describe any chemical reaction, making the definition so broad that it is not always useful.
For example, reactions as dissimilar as CO adsorption on Ni and benzene interacting with AlCl3
can be considered as Lewis acid/base reactions. For quantification purposes, the reference base is
also critically important in Lewis acidity. Unlike protons in Brønsted acids, electrons are not
independent of the Lewis base; consequently there is no universal scale of Lewis acidity [3].
1.3 Solid Lewis Acids in Biomass Reactions
A major challenge in developing bio-based chemical industry is the development of selective,
stable and active catalysts. In recent years, several Lewis catalytic systems have been successfully
3
introduce the main solid Lewis catalyst families for biomass conversion reactions and several
important examples to illustrate their applications.
1.3.1 Bulk Metal Oxides
Metal oxides are the traditional choice for dehydration catalysts [4], and have also been
successfully applied in isomerization reactions in biomass conversion. One important example is
that of -Al2O3, which has been used to carry out alcohol dehydration to olefins without leading
to undesired side reactions, such as isomerizations or double-bond shifts [5]. Also, ZrO2 and
anatase TiO2 are reported to be active for isomerization of glucose and fructose in
hot-compressed water at 473 K and further dehydration reaction into 5-hydroxymethyl-2-furaldehyde
(HMF) [6].
1.3.2 Framework Substituted Lewis Acid Zeolites
Zeolites are widely used solid catalysts with high surface area, thermal stability, and
usually strong Brønsted acidity. When aluminum atoms inside zeolites are substituted with
tetravalent Lewis acidic metal atoms like Sn or Ti, the zeolite becomes a pure solid Lewis acid in
the absence of Brønsted acid sites. Framework-substituted, Lewis-acid zeolites are found to be
extremely effective in many biomass conversion reactions. For example, for the isomerization of
glucose, SnBEA (zeolite with BEA topology containing framework Sn) gives product yields of
approximately 46% glucose, 31% fructose and 9% mannose after 12 min at 413K [7]. Sn and Zr
BEA are also very active catalysts for Meerwein-Ponndorf-Verley (referred as MPV) reduction
reaction and Baeyer-Villiger oxidation reactions which will be introduced in later sections [8,9].
1.3.3 Ion-exchange Zeolites
Although framework substituted zeolites are attractive catalysts, many of these materials
can be difficult to synthesize. Ion-exchange provides an easy and convenient way to replace the
4
normally thought of as basic materials, there is indeed evidence that using ion-exchanged zeolites
may act as solid Lewis acid. For example, Huang and Kaliaguine reported that
alkali-ion-exchanged ZSM-5 was active for the transformation of propene to aromatics and the
dehydrogenation of cyclohexane [10]. Tago, et al. found that activity of alkali-ion-exchanged
BEA zeolites for the production of isobutylene from acetone followed the order of the acidity of
the cations [11]. It is also reported by Davis et al. that Na-exchanged SnBEA would shift the
reaction pathway toward glucose-fructose-mannose isomerization.
1.4 Mechanisms of solid Lewis acids as catalysts in biomass reactions
As pointed earlier, the nature of solid Lewis acids is not well understood in many cases.
Here, I will briefly introduce some of the mechanisms the have been proposed in biomass
conversion reactions for the interaction of Lewis sites and functional groups in biomass
molecules. Some of these will be very helpful in understanding the characterization of Lewis
acids I have carried out in my thesis.
1.4.1 Glucose Isomerization, MPV reaction and Baeyer-Villiger oxidation reaction over
Sn-BEA
Isomerization of glucose into fructose has played a crucial role in the biomass-derived
chemical platforms [12]. The reaction is limited by equilibrium and typically catalyzed by an
immobilized enzyme [13]. However, the narrow range of operating conditions for enzymes limits
their application. As mentioned earlier, SnBEA was shown to be active over wide temperature
range in acid solutions. Moreover, SnBEA showed superb stability over multiple cycles after
5
Figure 1.1: Glucose isomerization mechanism by way of intramolecular hydride transfer in presence of SnBEA [14]
A 1H and 13C NMR spectroscopy study by Davis et al. demonstrated that the
isomerization reaction in the presence of SnBEA occurred through an intramolecular hydride
6
atoms in zeolite act as a six-member center which connect the carbonyl group at the C1 position
and the hydroxyl group at the C2 position. The intrinsic hydride transfer then occurs between the
C1 and C2, completing the transformation from glucose to fructose.
As shown by Corma et al., the MPV reaction can also be catalyzed by SnBEA via a very
similar mechanism [15,16]. In Fig. 1.2, co-adsorption of ketone and secondary alcohol on the Sn
center makes it possible for carbon-carbon hydride transfer between two molecules through the
catalyst. The difference between isomerization of glucose and the MPV reaction is that the former
is an intramolecular reaction. The high electronegativity of Sn gives it a strong ability to interact
with the carbonyl group, making the activity of SnBEA much higher than that of Al-BEA or
Ti-BEA in several MPV reduction reactions [15].
Figure 1.2: Mechanism of MPV reaction through SnBEA [16].
Another important reaction is the Baeyer-Villiger oxidation of ketones for the selective
formation of the corresponding lactones which can also be catalyzed through SnBEA zeolite [17].
7
and H2O2 in this reaction, which occurs via an oxygen insertion through a seven-member ring
intermediate [18].
Figure 1.3: SnBEA catalyzed Baeyer–Villiger reaction mechanism [18]
For all these important reactions over SnBEA and other framework substituted zeolite
catalysts, the most important step in each of the mechanisms is the adsorption of different
functional groups onto Lewis-site centers. These mechanisms provide us an important view for
Lewis acidity in biomass conversion reactions.
1.4.2 Alcohol dehydration over -Al2O3
Oxygen removal is required for converting lignocellulosic biomass to hydrocarbon fuels.
Dehydration is one of the most common methods for oxygen removal from molecules. Since
Brønsted acidity in solid acids can lead to undesired side reactions with different functional
groups in biomass molecules, dehydration through solid Lewis acids in biomass upgrading is
more attractive [12]. However, even for the simplest dehydration reaction, for example the
8
Dehydration of a series of alcohols over -Al2O3 by Roy, et al. showed that both
experimental and theoretical results indicate a linear relationship between dehydration activation
energy of alcohol and the proton affinity of corresponding carbenium-ion. This is shown in Fig.
1.4 [19]. The relationship indicates that the dehydration mechanism involves a carbenium-like
transition state during the reaction.
Figure 1.4: Activation energy of experimental results (■), theoretical results involving dehydration on a two-coordinated (●) and three-coordinated (○
) O atom vs
PA [19]After investigating various dehydration mechanisms, they reported that a concerted
E2-type, dehydration mechanism explains the energy barrier obtained from experiments [19]. From
9
alcohol adsorption on the Al-Lewis site; then, in the next step, H is transferred from the
secondary carbon of the alcohol to a surface O atom of the alumina. After that, alkene is formed
and desorbs from the surface to the gas-phase. Finally, water is formed from the remaining H and
OH groups and desorbs into the gas-phase.
10
1.4.3 Summary of mechanisms for Lewis acids in Biomass reactions
From the mechanisms introduced above, it can be concluded that the adsorption of
molecules onto Lewis-acid centers, especially the adsorption of functional groups onto catalysts,
is crucial in biomass conversion reactions. Therefore, understanding adsorption of typical
biomass molecules on Lewis sites is important for characterization of solid Lewis acids. Some
methods that have been developed to study the adsorption properties will be discussed in the next
section.
1.5 Approaches to Study Solid Brønsted Acidity by Adsorption Measurements
The systematic studies of zeolite Brønsted acidity by Gorte et al. [20,21] provide a good
background for discussing Brønsted sites and demonstrate methods for understanding and
predicting catalytic chemistry from adsorption properties. A review of these approaches provides
a path for understanding and characterizing solid Lewis acidity and will be described in this
section.
1.5.1 Site densities and stoichiometric adsorption complexes
Determination of the concentration of acid sites is essential before one can begin to
describe reactions on Brønsted-acid sites. 27Al NMR together with elemental analysis is able to
determine the framework Al content in zeolites. However, the equipment is expensive and the
method suffers from the problem that not all framework Al in zeolites are accessible to reactant
molecules [22]. Another widely used methods for obtaining Brønsted site densities is
Temperature Programmed Desorption (TPD) of ammonia. Ammonia TPD results are often
ambiguous because adsorption of ammonia is not specific to Brønsted sites [23].
An easy and effective method for measuring Brønsted site densities is simultaneous
temperature programmed desorption (TPD) and thermogravimetric analysis (TGA) measurements
11
behind the technique is that alkyl-ammonium ions can be formed by protonation of amines at
Brønsted sites. At high temperatures, these react via a Hoffman elimination reaction to form an
alkene and ammonia in a very narrow temperature range, as shown below:
The reaction of one molecule per framework Al has been observed on H-MFI samples
with different Al contents for a variety of amines small enough to enter the pores of zeolites.
Since the reaction is from the 1:1 complexes, TGA results are very useful to determine whether
there is a residual mass remaining on the sample and to quantify the amount of reacting amines
by monitoring the mass change over the temperature at which reaction occurs. An investigation of
a series of FAU showed a linear correlation between site density determined by TPD-TGA of
2-propylamine and framework Al content, which can be used as an additional evidence that the
measurement of site density is accurate in zeolites [28].
It is also important to know the stability and chemical structure of reactants, products and
intermediates at the catalytic sites in order to describe a surface-catalyzed reaction. TPD-TGA is
one of the clearest methods to observe the 1:1 complexes. TPD-TGA results provide information
on the adsorption complexes from the TGA results. Many types of molecules including alcohols
[29,30], amines [31], nitriles [32], pyridines [33], ketones [34,35], and diethyl ether [32] have
been demonstrated to form 1:1 adsorption complexes on H-MFI.
1.5.2 Calorimetric measurements
As described in Section 1.2, the definition of Brønsted acidity in either solution phase or
gas phase can be scaled into a universal form from the change of free energy of the protonation
12
a powerful method for defining solid acidity by comparing thermodynamic properties in zeolites
to thermodynamic properties in homogeneous acids [21].
The microcalorimeter used in my thesis is a home-built instrument which is able to
simultaneously measure the heats of adsorption and adsorption isotherms. The instrument is
described in detail in Chapter 2. To demonstrate how it can be used to quantify acidity, it is useful
to consider the data in Fig. 1.6. The figure shows the differential heats for pyridine on three
different H-MFI samples with different Si/Al ratios at 480 K. The differential heats are 200
kJ/mol up to the coverage of one per site and the heats fall rapidly to around 70 kJ/mol at the
coverage above one per site [36]. Taking the difference between these values, one can calculate
the enthalpy change for the proton-transfer reaction to be 130 kJ/mol in the zeolite. By
comparison, -Hpro,que is approximately 20 kJ/mol in aqueous solution. This difference between
solution phase and the zeolite can have a huge impact on reaction kinetics.
13
The comparison of differential heats for a series of molecules including amines,
ring-substituted pyridines and nitriles with their protonation heats in aqueous solution and gas phase is
shown in Fig. 1.7(a) and 1.7(b) [32,33,37]. It is obvious from this data that the correlation
between the differential heats in H-MFI and gas-phase proton affinities (PA) in 1.7(b) is much
better than that for the differential heats with effective pKa in aqueous solution in 1.7(a).
Moreover, the linear correlation between differential heats and proton affinities has a slope of
one. This strong correlation suggests that the Hbinding for Brønsted acid sites with different base
molecules (including pyridine, amines) should be a constant. These experiments provide strong
evidence that solution-phase definition as pKa’s, are not be useful in predicting chemistry in
zeolites. Even if the zeolite is placed in the aqueous phase, one should not expect for the same
binding energy for Brønsted-acid sites in zeolites to be the same as hydrogen ion with base
molecules in water.
14
The intent in this section was to demonstrate that microcalorimetry provides a powerful
framework for understanding Brønsted acidity in zeolites. The approach to extending these
concepts to reaction chemistry will be discussed in the next section.
1.5.3 Reaction Chemistry
In this section, the alcohol dehydration reaction, catalyzed by H-MFI, will be shown as a
practical application to demonstrate that the proton-affinity picture, together with the concept of
stoichiometric adsorption complexes, is useful in predicting chemistry. The reaction pathway for
alcohol dehydration can be simplified as follows:
Adsorption studies demonstrated that 1:1 complex can be formed by adsorption of
various alcohols onto zeolite. Dehydration happens through formation of water and a
zeolite-bound carbenium ion, which finally decomposes back to the zeolite and an olefin. If we use the
conclusion from calorimetric studies that the heats of formation for complexes on the zeolite can
be calculated from tabulated proton affinities of olefins and alcohols and the linear correlation in
Fig. 1.7 (b), energies of all transition states during dehydration for different alcohols can be
determined. The result of this calculation is shown in Fig. 1.8.
Fig. 1.8 allows us to predict alcohol dehydration reactions in H-MFI. Based on the
potential energy diagram, one would expect that each of the gas-phase alcohols should adsorb
onto the Brønsted acid sites and form oxonium-ion adsorption complexes. The energy differences
between oxonium-ion complexes for different alcohols with H-MFI are very small. However, the
energy differences for forming the carbenium ions from their corresponding oxonium ions are
15
between the oxonium ion and carbenium ion, one would expect a dramatic difference in the
reaction chemistries. For example, in the case of methanol, the formation of the methyl
carbenium-ion is extremely unfavorable, requiring more than 55 kcal/mol from the oxonium ion.
By contrast, the energy difference between the oxonium and carbenium ions for t-butanol is only
8 kcal/mol.
Figure 1.8: Potential energy diagram of alcohol/H-MFI interactions. The adsorption of alcohols and olefins on the zeolite is assumed to occur through proton transfer, allowing the use of known proton affinities to calculate relative heats of formation [30]
The predictions for alcohol dehydration based on adsorption studies correspond well with
observations from adsorption studies [30]. From TPD-TGA experiments, the 1:1 complex for
isopropanol decomposes into propene and water at ~400 K while dehydration of t-butanol
16
In summary, these approaches provide a proper understanding of the nature of solid
acidity. By determining structures and energies of all species along a reaction coordinate from
adsorption measurements, one can describe and predict a surface-catalyzed reaction.
1.5.4 The Approaches to study solid Lewis Acidity
The success in understanding solid Brønsted acidity encouraged us to seek a better
understanding of solid Lewis acidity for purposes of predicting Lewis-catalyzed biomass
reactions. The main methods and approaches for studying solid Lewis acidity were similar to that
used in characterizing solid Brønsted acidity.
1.6 Scope of the Thesis
This thesis is divided into 7 chapters. Chapter 2 provides descriptions of the
characterization techniques and preparation methods of catalysts in this work.
Chapter 3 focuses on the characterization of metal oxides and metal oxides over SBA-15
support. The acidity of each material was examined by adsorption and reaction studies. The
relationship between Lewis acidity, Brønsted acidity and the etherification reaction of
5-hydroxymethylfurfural (HMF) with 2-propanol was also described.
In Chapter 4, the possibility of using alkali-exchanged BEA zeolites as Lewis-acid
catalysts was examined using temperature-programmed desorption (TPD)/thermogravimetric
analysis (TGA) measurements of adsorbed pyridine, 2-propanamine, diethyl ether,
2-methyl-2-propanol, and acetonitrile, FTIR of pyridine and CD3CN, calorimetry of CO, and reaction rates
for reductive etherification of 5-hydroxymethyl furfural (HMF) with 2-propanol. Adsorption on
the alkali cations occurs through ion-dipole interactions, as evidenced by the fact that adsorption
is strongest on Li, followed by Na and K. Adsorption of all the probe molecules was much
alkali-17
exchanged BEA samples were not catalytically active for alcohol dehydration or reductive
etherification of HMF. The implications of these results for the characterization of solid Lewis
acidity are discussed.
In Chapter 5, CH4 adsorption was studied experimentally and theoretically on ZSM-5,
MOR, and ZSM-12 zeolites using calorimetric measurements at 195 K and plane wave DFT
calculations. Differential heats measured on four different H-ZSM-5 samples were determined to
be 22.5±1 kJ/mol, independent of Brønsted site density or defect concentration. However, DFT
calculations performed using various functionals and on the most stable Brønsted site indicated
that CH4 should bind to this site by an additional 1 to 7 kJ/mol, a discrepancy that is due to the
inability of standard DFT methods to capture hydrogen-bonding effects accurately with CH4.
Differential heats for CH4 in MOR were 30±1 kJ/mol at low coverages, falling to 25 kJ/mol for
coverages above one molecule per 8-membered-ring side pocket, while differential heats on
ZSM-12 were initially 22.5 kJ/mol, decreasing to 21 kJ/mol with coverage. DFT calculations on
the siliceous form of the zeolites were able to predict these values within 5 kJ/mol in most cases.
The results indicate that CH4 is an excellent probe molecule for characterizing the pore structure
of zeolites. on adsorption studies of methane over ZSM-5, MOR, and ZSM-12 using
calorimetric measurements and DFT calculations.
In Chapter 6, the adsorption and reaction properties of H-BEA, SnBEA, ZrBEA, and
siliceous BEA were examined in order to understand the reaction of 2,5-dimethylfuran (DMF)
with ethene to produce p-xylene. Temperature-programmed desorption (TPD) of diethyl ether,
DMF, 2,5-hexanedione, and p-xylene on each of the zeolites demonstrated that the Brønsted sites
in H-BEA are much more reactive than the Lewis sites in SnBEA and ZrBEA and tend to
promote oligomerization of DMF and hexanedione, even at 295 K; however, adsorbed
18
ZrBEA were all able to catalyze the reaction to p-xylene with high selectivity in a continuous
flow reactor, with all three showing rates that are first-order in both DMF and ethene. H-BEA
was found to deactivate rapidly due to coking, while ZrBEA and SnBEA were both very stable.
The implications of these results for practical applications are discussed.
19
Chapter 2.
Experimental Techniques
This chapter will describe the various techniques used to characterize the catalysts,
including the continuous-flow reactor designed for biomass conversion, as well as the
pretreatment methods used in preparing the catalysts.
2.1 Characterization Techniques
2.1.1 TPD-TGA measurement
Figure 2.1: Schematic diagram of TPD-TGA system
Simultaneous thermogravimetric analysis (TGA) and temperature programmed
desorption (TPD) was found to be one of the most useful methods available for the initial
20
TGA unit in this system has an accuracy of 0.01 mg and allows the measurement of weight
changes as small as 0.01%. After exposure to the vapors of interest, the sample can be evacuated
by a diffusion pump, which ensures that the pressure above the sample is low enough to minimize
secondary reactions. Desorbing species can be monitored with high sensitivity by a mass
spectrometer. From the TPD-TGA results, one can quantify the desorption amount and determine
whether there is a reaction on the sample during desorption.
In a typical TPD-TGA experiment, the sample is first heated to 830 K in vacuum to
remove water and other impurities. After cooling to room temperature, the sample is exposed to
several Torr of the probe molecule of interest. After evacuation, the temperature is then ramped at
10 K/min to 830 K, while the sample mass and desorbing products are monitored.
If readsorption is negligible, the rate of desorption from a unit surface area can be written
as:
𝑁(𝑡) = −
𝑑𝜎𝑑𝑡
= 𝑣
𝑛𝜎
𝑛
𝑒𝑥𝑝 (
−𝐸𝑅𝑇
)
2.1)
Where: 𝑁 is the desorption rate
σ is the surface coverage (molecules/cm2)
𝑛 is the order of the reaction
𝑣𝑛is the rate constant
𝐸 is the activation energy of reaction(kJ/mol)
Because the temperature is linearly ramped to 830 K, temperature of the system can be
written as a function of time 𝑇 = 𝑇0+ 𝛽𝑡. If we assume that the reaction is first order and the
activation energy 𝐸 is independent of σ, then the expression of peak temperature 𝑇𝑝 below can be
21
𝐸 𝑅𝑇𝑝2
=
𝑣1
𝛽
𝑒𝑥𝑝 (
−𝐸𝑅𝑇𝑃
)
2.2)
While this description is not appropriate for desorption from porous catalysts due to
readsorption effects, the approach is useful for describing decomposition reactions where the
products leave the sample once they are formed [20]. In this circumstance, the activation energy
of the reaction may be obtained from the peak temperature of the products using Eqn 2.2. For
example, a TPD-TGA of 1-propanol over TiO2 is shown in Fig. 2.2. The dehydration reaction of
1-propanol into propylene and water occurs during TPD and propylene cannot readsorb on titania.
Using the peak temperature for propylene of 596 K, the activation energy for dehydration of
1-propanol can be calculated to be 171 kJ/mol by assuming a normal reaction pre-exponential of
1013 s-1.
22
2.1.2 Calorimetric measurement
Calorimetry is a direct method for measuring heats of adsorption for gaseous adsorbates
on acid sites. Our home-built, Calvent-type calorimeter allows the use of relatively large samples
(0.5g~1g) spread into very thin beds (~1 mm thick) for rapid adsorption and heat transfer. As
shown in Fig. 2.3, the calorimeter cell is surrounded on five of six sides by highly sensitive
thermopiles which generate a voltage proportional to the heat flow released by adsorption. The
calorimeter cell is enclosed in a large aluminum block, which in turn is kept within a Styrofoam
cooler, to maintain isothermal conditions. A dosing loop is connected to a six-port valve which
allows calibrated volumes of gas to be admitted into the calorimeter cell. Two pressure
transducers are separately positioned on the dosing system, which is used to fill the dosing loop,
and the calorimeter cell.
23
The dosing procedure involves switching the six-port valve to the dosing side, filling the
dosing loop with the adsorbate gas, and then switching the six-port valve to the calorimeter side.
Usually, adsorption equilibrium is achieved in approximately 20 min. The amount of gas
introduced to the dosing loop and the amount remaining at equilibrium can be determined by the
volume, pressure, and the temperature.
In a typical measurement, the samples were heated in the evacuated calorimeter cell to
~600 K overnight to clean the sample before beginning to expose the sample to gaseous
adsorbates. Aliquots of adsorbate were then dosed onto the sample by switching the six-port
valve from dosing side to the calorimeter side. Dosing continued until saturation coverage was
reached. The adsorption isotherm was obtained simultaneously with the heats by measuring the
amount of gas remaining at equilibrium with the pressure above the sample.
2.1.3 FTIR
Fourier Transform Infrared Spectroscopy (FTIR) is another useful technique to study the
adsorption properties on the catalyst. Comparing spectra before and after adsorption of certain
probe molecules provides a convenient method to characterize solid Lewis acid catalysts. The
spectra were recorded using Mattson Galaxy 2020 FTIR spectrometer which has an accuracy of 2
cm-1 resolution. A Spectra-Tech diffuse-reflectance accessory (Collector II), which allowed
programmed heating during measurements on powder samples, was available on the FTIR
spectrometer.
2.2 Tubular flow reactor
A schematic diagram of the continuous-flow, tubular reactor used in my studies of the
biomass conversion reaction is shown in Fig. 2.4. Detailed kinetic studies are easier to interpret in
continuous flow reactors comparing to batch reactors because they operate at steady state. In most
24
tube and held by glass wool. A stainless-steel stick was placed downstream from the catalyst in
the tube in order to reduce the empty volume of the reactor and hold the catalyst bed. A solution
of reactants from a feed reservoir was introduced into the reactor by a HPLC pump (Series III,
Scientific System) at a controllable flow rate from 0.05 ml/min to 1.0 mol/min. A back-pressure
regulator (KPB series, Swagelok) was placed downstream from the reactor in order to control the
pressure. The pressure inside the system can also be measured by the HPLC pump. A gas tank
equipped with a high pressure delivery regulator was used to introduce gas into the system
through 7 ft of 0.002-in. ID capillary tube (Valco Instruments). The relationship between pressure
drop across the capillary tube and the gas flow rate can be determined by calibration.
Figure 2.4: Schematic diagram of continuous flow reactor
2.3 Catalyst Preparation
In my work, I started with commercially available zeolites. However, some of these
materials were modified by alkali exchange to change the nature of the sites and by
25
discussed, while the details of the preparation procedures will be described in corresponding
chapters.
2.3.1 Alkali-exchanged zeolite
Alkali-ion exchange replaces Brønsted-acid sites in zeolites into alkali-ion sites. As
discussed in Chapter 1, alkali-ion-exchanged zeolites can be viewed as solid Lewis acids. To
obtain the alkali (M+) form, 1 g of the NH
4+or H+ form of the zeolite was stirred with a 300 mL
solution that was 0.1 MCl and 0.001 MOH for four hours, followed by filtering. As a final step,
the sample was calcined at 550℃ under flowing air for four hours to remove surface impurities.
2.3.2 Dealumination of a BEA zeolite
The activity of zeolites is related to the ion-exchange sites in the framework. The removal
of framework Aluminum atoms provides a zeolite sample with the same topology of the original
one but essentially no acid sites. Dealuminated zeolites can be used as a precursor in synthesizing
framework Lewis acids.
To obtain dealuminated BEA zeolite without losing its original crystallinity, 3 g of BEA
zeolite was mixed with 60 ml 13 mol/L nitric acid for 4 h at 373 K, with stirring. The suspension
was then filtered and washed multiple times to remove any remaining acid. Finally, the sample
26
Chapter 3.
Lewis acidity of metal-oxides and metal-oxides over SBA-15
and the effect of acidity on HMF etherification reaction
3.1 Introduction
The conversion of cellulosic biomass into liquid fuels, or fuel additives, would be
attractive if it could be performed economically. While potential processes exist for taking
cellulose to C-5 and C-6 sugars, and these can in turn be converted into furfural and
5-hydroxymethylfurfural (HMF), additional processing is required in order to stabilize furfural and
HMF because they remain highly functionalized. Since H2 is expensive to produce and compress
and is not economically renewable, processes that avoid its use and minimize its consumption are
preferred. One interesting approach for upgrading furfural and HMF that avoids the need for
gas-phase H2 involves reactions with alcohols or aldehydes to produce higher molecular weight
products that can be used in diesel fuel, either directly or after minor additions of hydrogen
[38,39]. One example where this has been accomplished involves cross-aldol condensation with
acetone [40] and hydroxylation [41].
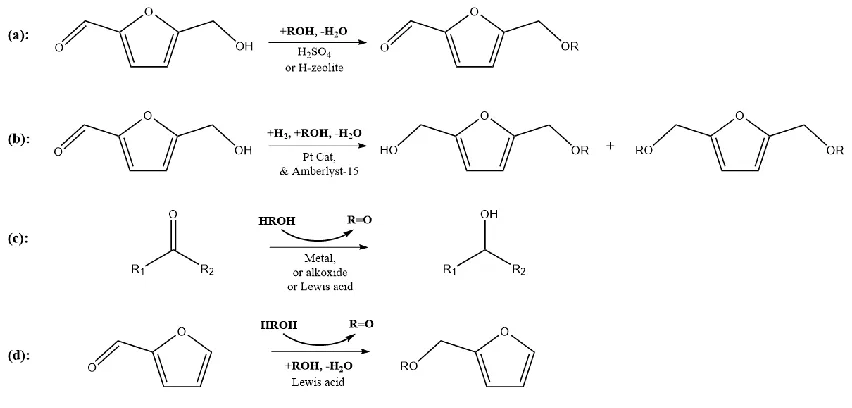
An alternative approach to aldol condensation involves etherification of HMF with an
alcohol. The direct etherification of HMF to form the mono-ether furfural can be catalyzed by
Brønsted acids, including H2SO4 [38] and H-zeolites [42], as shown in Fig. 3.1(a). However, the
remaining carbonyl functional group in the mono-ether furfurals reduces the stability of the
molecule compared to the corresponding alcohols [38,43]. Formation of di-ethers from
2,5-bis(hydroxymethyl)-furan (BHMF) has been demonstrated but this requires a two-step process in
which the carbonyl group is first reduced [44]. Reductive etherification, in which the carbonyl is
hydrogenated and then reacted to form the di-ether, avoids this problem. In a demonstration of
27
form 2,5-bis(alkoxymethyl)furan, shown in Fig. 3.1(b). This reaction requires H2 to reduce the
carbonyl group, increasing the material and process cost.
Figure 3.1: (a) Direct etherification of HMF, (b) one-pot reductive etherification of HMF via hydrogenation, (c) transfer hydrogenation via Meerwein–Ponndorf–Verley reaction, and (d) reductive etherification of HMF via transfer hydrogenation
Transfer hydrogenation via the Meerwein–Ponndorf–Verley (MPV) reaction, shown in
Fig. 3.1(c), provides the opportunity for an interesting variation on reductive etherification, since
the alcohol used as the reactant for making the ether can also be used as the hydrogen source. The
aldehyde or ketone produced by oxidation of the alcohol would need to be hydrogenated in a
separate step, but this subsequent reaction could be carried out in the gas phase and would not
require high-pressure H2 [45]. Alternatively, the aldehyde or ketone produced could be used in
aldol-condensation of HMF. Some examples where transfer hydrogenation has been used include
the following: Petra et al. [46] performed transfer hydrogenation over ruthenium(II) for the
28
aldehydes using isopropanol as hydrogen donor and ytterbium triflate as the catalyst; Misra et
al. [48] applied bimetallic alkoxides of praseodymium and neodymium to carry out the transfer
hydrogenation of octanone. Of particular interest, transfer hydrogenation has been shown to be
catalyzed by solid, inexpensive oxides. For example, Dumesic and coworkers [49] showed that
ZrO2 can be effective for transfer hydrogenation of levulinic acid/ethyl levulinate to
γ-valerolactone. Similarly, Corma et al. [16] reported the reduction of cyclohexanone to
cyclohexanol in large-pore zeolites with framework Sn or Zr. Presumably, the oxides in these
examples are acting as solid Lewis acids. An additional benefit of using solid acids to catalyze
transfer hydrogenation is that the acids may also catalyze the etherification reactions. The
feasibility of this has been demonstrated by Bui et al. [50] and Jae et al. [51], who performed the
sequential transfer hydrogenation and etherification of furfural to furfuryl ether over zeolite BEA
with framework Zr, Sn and Ti, using an alcohol as hydrogen donor. This reaction is shown in Fig.
3.1(d). Metal oxides exhibit Lewis acid properties for reaction involving alcohols [4,52–56].
There are even questions concerning whether the active sites are Brønsted- or Lewis-acid in
nature, especially in the presence of water, which is a product of the reaction.
5-[(1-29
methylethoxy) methyl]furfural (MEF), 5-[(1-methylethoxy)methyl]-2-furanmethanol (MEFA), 2,5-bis[(1-methylethoxy)methyl]furan (BEF)
In the present work, we combine TPD–TGA experiments and the performance of a range
of solid acids for the reaction of HMF with 2-propanol in the liquid phase in order to gain insights
into what properties are most desirable for carrying out transfer hydrogenation and the subsequent
etherification reactions. We examined both solid Lewis acids (Al2O3, ZrO2, TiO2, and Sn-BEA)
and solid Brønsted acids (H-BEA, Al2O3/SBA-15, and ZrO2/SBA-15). What we will show is that
each of the materials showed activity but that the product selectivities varied strongly with the
oxide acidities (Fig. 3.2).
3.2 Experimental methods
3.2.1 Materials
The γ-Al2O3 (99%, Alfa Aesar) was pre-treated with a 1 mol L−1 NH4NO3 solution in
order to remove Naimpurities [19]. In the NH4NO3 treatment, 500 mg of γ-Al2O3 was stirred with
300 mL of the solution at 353 K for 3 hours, then calcined to 773 K. The TiO2 was purchased
from Aeroxide (99%) and used without additional pretreatment. The ZrO2 sample was prepared
by drying an aqueous solution of zirconyl nitrate hydrate (99%, Aldrich), followed by calcination
at 773 K for 4 h. The surface areas of the samples were determined from N2 isotherms using the
Brunauer–Emmett–Teller (BET) method at 78 K, after evacuation of the sample at 500 K, and are
reported in Table 3.1.
The Sn-BEA, with Si/Sn ratio of 118, was prepared by the procedure described by Corma
et al. [16]; characterization of this material has been described elsewhere [51,57]. First, 13.6 g of
TEOS (Sigma Aldrich, 98%) were hydrolyzed in 13.01 g of TEAOH (40 wt%, Sigma Aldrich)
30
98% reagent grade) in 0.92 g of DI water were added, after which the mixture was again stirred at
room temperature until the solution had decreased in weight by 12 g because of ethanol
evaporation. To the resulting clear solution, 1.47 g of HF (48 wt%) were added, causing the
formation of a thick paste. Next, 0.152 g of calcined, siliceous zeolite Si-Beta in 0.73 g of DI
water was added as seed crystals. The final gel composition was as follows: 1.0 SiO2 : 0.0083
SnO2 : 0.54 TEAOH: 7.5 H2O: 0. 54 HF. The crystallization was carried out in rotating,
Teflon-lined, stainless-steel autoclaves at 413 K for 28 days. The solid produced by this process was then
calcined in air using a heating ramp of 3 K min−1 to 853 K and held at this temperature for an
additional 3 h.
SBA-15-supported Al2O3, ZrO2, and TiO2 were also prepared and tested. The SBA-15
was a mesoporous silica, with 5.0 nm, uniform, mono-dimensional channels and has been
described elsewhere [58]. Al2O3/SBA-15 was synthesized to have 10 wt% Al2O3 by mixing 1.46
g aluminum nitrate nonahydrate (98.0% to 102.0%, Alfa Aesar) with 1.8 g SBA-15 in 100 mL of
water for 2 h at 353 K, followed by evaporation of the water and calcination of the solid at 773 K.
The 10 wt% ZrO2/SBA-15 sample was prepared in the same manner, with a zirconia nitrate
aqueous solution (99%, Aldrich). For the 10 wt% TiO2/SBA-15 sample, 1.8 g SBA-15 powder
was stirred with 0.88 mL titanium iso-propoxide (97%, Aldrich) in 100 mL tetrahydrofuran under
a N2 atmosphere. After removing the solvent by evaporation, the solid was again calcined at 773
K for 4 h.
3.2.2 Experimental
The reactions of HMF with 2-propanol were carried out in a high-pressure,
continuous-flow reactor similar to that described in Chapter 2 [59]. The tubular reactor was a 20 cm long,
stainless-steel tube with a 4 mm ID and 1/4 inch OD, passed through a tube furnace. The liquid
31
Scientific), was introduced into the reactor using an HPLC pump (Series I+, Scientific Systems
Inc.) with a fixed feed rate at 0.2 mL min−1. For these measurements, the reactor pressure was
maintained at 69 bar using a back-pressure regulator (KPB series, Swagelok). Product analysis
was carried out by means of a GC-Mass Spectrometer (QP-5000, Shimadzu), equipped with a
capillary column (HP-Innowax, Agilent Technologies). The HMF quantification was achieved by
GC/MS using standard solutions with different concentrations. Due to the lack of commercial
standards for ethers, the GC sensitivity for the products was assumed to be equal to that for HMF.
Due to the uncertainties in the calibration factors, the total GC area for all products was used to
normalize product selectivities.
To avoid large pressure drops in the reactor, the catalyst samples were first pressed into
thin wafers, which were then broken into small pieces before placing them into the reactor. The
rectangular wafers had a characteristic size of 1–2 mm and a thickness of approximately 0.3 mm.
The catalyst was loosely packed in the reactor, so that the length of the bed was approximately 1
cm for a 0.1 g loading, and 4 cm for a 0.4 g loading. Based on the volumetric flow rate, the linear
velocity of the liquid feed was determined to be 1.6 cm min−1. For differential conversions, it was
possible to calculate rates from the measured conversions, although characteristic diffusion times
(δ2/D ~ (0.015 cm)2/10−6 cm2 s−1 ~ 200 s) could affect this somewhat. However, channeling of the
reaction fluid around the catalyst particles prevents measurement of rates at higher conversions.
In this study, catalyst loading was varied in order to determine the effect of increasing conversion
on the selectivity and cannot be used as a measure of reaction rates.
To determine the effect of temperature, reactions were carried out with 0.1 g of catalyst at
413 K and 453 K. (For the H-BEA and Sn-BEA catalysts, reactions were also measured with 0.05
g at 413 K in order to maintain differential conversions.) The conversions were negligible in the
32
this study, conversions and selectivities remained unchanged over the period of several hours
required to make the measurements. The typical run time was 3 h, and the outlet products were
sampled every 30 min. In all cases, minimal changes were observed in the conversion and
selectivity; and representative data was typically chosen from the second or third measurement
(40 to 60 min after starting the reaction).
3.3 Results and discussion
3.3.1 Isopropylamine adsorption
Brønsted-acid site concentrations were determined from TPD-TGA results following
room-temperature adsorption of 2-propanamine, as shown in Fig. 3.3, which were measured on
metal oxides and metal oxides over SBA-15 samples. On γ-Al2O3, it has previously been reported
that all of the amine desorbs intact over a broad temperature range, from room temperature to 700
K [19]. The high desorption temperature demonstrates that adsorption is strong but the fact that
there is no reaction implies a complete absence of Brønsted-acid sites. This result is in sharp
contrast to that found for the Al2O3/SBA-15 sample. Following exposure to the amine and
evacuation, approximately 200 μmol g−1 of the amine reacts to propene and ammonia between
575 and 650 K. Although the Brønsted-site concentration on Al2O3/SBA-15 is significantly lower
than the Al concentration (~2000 μmol g−1), it is much higher than is normally found on
amorphous silica–alumina catalysts [27,59]. We suggest that the amorphous silica walls making
up the SBA-15 are exceptionally capable of incorporating Al3+ into tetrahedral positions in the
siliceous matrix.
The TPD-TGA results for 2-propanamine on pure and SBA-15-supported ZrO2 and TiO2
were unexpectedly similar to that found for Al2O3. Again, the pure oxides showed no Brønsted
acidity, while the SBA-15-supported oxides both showed significant concentrations of
Brønsted-acid sites, 130 μmol g−1 for ZrO
33
the reaction of the amine between 575 and 650 K. Evidence for Brønsted acidity in some zirconia
silicates has been presented previously, based on isomerization of butane and on the formation of
pyridinium ions in FTIR measurements [60]. Obviously, the nature of Brønsted-acid sites formed
by Zr4+ and Ti4+ in silica is not expected to be similar to that of sites formed by tetrahedral Al3+.
Figure 3.3: TPD-TGA for 2-propylamine over (a) γ-Al2O3 (b) ZrO2 (c) TiO2 (d) 10 wt%
34
Figure 3.4: TPD-TGA results for 1-propanol, 2-propanol and 2-methyl-2-propanol over TiO2 and ZrO2. The corresponding TPD-TGA results over γ-Al2O3 can be found in ref [19]. For
1-propanol, the peaks correspond to 1-propanol (m/z=31) and propene (m/z=41); for 2-1-propanol, the peaks are for 2-propanol (m/z=45) and propene (m/z=41); for 2-methyl-2-propanol, the peaks are 2-methyl-2-propanol (m/z=59) and butane (m/z=41)
3.3.2 Alcohol dehydration over metal oxides
TPD–TGA experiments were performed with 1-propanol, 2-propanol, and
2-methyl-2-propanol on TiO2, ZrO2 and γ-Al2O3 [19]. Fig. 3.4 shows results for 1-propanol, 2-propanol, and
35
initial coverages are 300 μmol g−1 and 250 μmol g−1, respectively. Both of these correspond to a
specific surface coverage of 3 × 10¹⁸ molecules m−2, which is close to what would be expected for
a monolayer and essentially the same as that reported for γ-Al2O3 in a previous study [19]. The
TPD results indicate that desorption occurred in two temperature regions, with unreacted
1-propanol (m/z = 31) leaving the sample below 550 K and propene (m/z = 41) desorbing in a peak
centered at ~590 K. (Desorption features for water were too broad to observe.) Propene (m/z =
41) desorption peaks on the two oxides were narrow, implying that the reaction sites on each
material are nearly catalytically identical. Mass changes associated with propene desorption
indicate that approximately 150 μmol g−1 1-propanol reacted to propene and water on TiO 2 and
120 μmol g−1 on ZrO
2. It is also interesting to note that reaction to propene and water occurred at
~550 K on γ-Al2O3 [19].
Table 3.1: TPD-TGA desorption peaks of the alkenes, experimental activation energies and BET surface areas of the oxides. The values of alcohol dehydration on γ-Al2O3 have been taken from ref [19]
Oxide BET surface area (m2 g-1) Alcohol
Alkene desorption peak T(K)
Activation energy (kJ mol-1)
TiO2 50 1-propanol 596 171
2-propanol 533 153
2-methyl-2-propanol 461 128
ZrO2 40 1-propanol 595 171
2-propanol 525 150
2-methyl-2-propanol 491 140
γ-Al2O3 120 1-propanol 550 141
2-propanol 490 121
![Figure 1.1: Glucose isomerization mechanism by way of intramolecular hydride transfer in presence of SnBEA [14]](https://thumb-us.123doks.com/thumbv2/123dok_us/9357034.1469711/20.612.174.493.82.523/figure-glucose-isomerization-mechanism-intramolecular-hydride-transfer-presence.webp)
![Figure 1.2: Mechanism of MPV reaction through SnBEA [16].](https://thumb-us.123doks.com/thumbv2/123dok_us/9357034.1469711/21.612.146.492.354.555/figure-mechanism-mpv-reaction-snbea.webp)
![Figure 1.4: Activation energy of experimental results (■), theoretical results involving dehydration on a two-coordinated (●) and three-coordinated (○) O atom vs PA [19]](https://thumb-us.123doks.com/thumbv2/123dok_us/9357034.1469711/23.612.143.512.211.524/figure-activation-experimental-theoretical-involving-dehydration-coordinated-coordinated.webp)

![Figure 1.8: Potential energy diagram of alcohol/H-MFI interactions. The adsorption of alcohols and olefins on the zeolite is assumed to occur through proton transfer, allowing the use of known proton affinities to calculate relative heats of formation [30]](https://thumb-us.123doks.com/thumbv2/123dok_us/9357034.1469711/30.612.160.477.215.512/potential-interactions-adsorption-allowing-affinities-calculate-relative-formation.webp)