University of Pennsylvania
ScholarlyCommons
Publicly Accessible Penn Dissertations
1-1-2014
Essays on Private Medicare Insurance Markets
You Suk Kim
University of Pennsylvania, youskim82@gmail.com
Follow this and additional works at:http://repository.upenn.edu/edissertations
Part of theEconomics Commons
This paper is posted at ScholarlyCommons.http://repository.upenn.edu/edissertations/1330 Recommended Citation
Kim, You Suk, "Essays on Private Medicare Insurance Markets" (2014).Publicly Accessible Penn Dissertations. 1330.
Essays on Private Medicare Insurance Markets
Abstract
This dissertation consists of two essays in economics of industrial organization on private Medicare insurance markets. In the first chapter, together with Naoki Aizawa, we study the incentives for private health insurers to use advertising to attract healthy individuals in the market for private Medicare plans called Medicare
Advantage (MA). Using data on the advertising expenditures of MA plans, individual-level and county-level MA enrollment, we document a large difference in an insurer's potential profits from healthy vs. unhealthy individuals. We then develop and estimate an equilibrium model of the MA market, which incorporates strategic advertising by insurers. Parameter estimates show that advertising has much larger effects on the demand of the healthy. We find that advertising accounts for 15% of the selection of healthier individuals into Medicare Advantage. In the second chapter, I study how consumer search frictions affect adverse selection and competition in the Medicare Supplement Insurance (Medigap) market. Using data on individual-level and market-level Medigap enrollment and claim costs, I estimate an equilibrium model of the Medigap market, which incorporates consumer search frictions and adverse selection. Parameter estimates show that search frictions are significant and that unhealthy consumers tend to face greater search costs. I find that the
correlation between search costs and health risks reduces the extent of adverse selection by keeping unhealthy consumers with high search costs outside the market. In a counterfactual experiment where the government provides more information on available options, I find that the extent of adverse selection increases and that healthy individuals become worse off.
Degree Type Dissertation
Degree Name
Doctor of Philosophy (PhD)
Graduate Group Economics
First Advisor Hanming Fang
Keywords
Adverse selection, Advertising, Insurance, Medicare, Search Frictions
ESSAYS ON PRIVATE MEDICARE INSURANCE MARKETS
You Suk Kim
A DISSERTATION
in
Economics
Presented to the Faculties of the University of Pennsylvania
in
Partial Fulfillment of the Requirements for the
Degree of Doctor of Philosophy
2014
Supervisor of Dissertation
Hanming Fang, Professor of Economics
Graduate Group Chairperson
George J. Mailath, Professor of Economics
Dissertation Committee:
Katja Seim, Professor of Business Economics and Public Policy
Robert J. Town, Professor of Health Care Management
ESSAYS ON PRIVATE MEDICARE INSURANCE MARKETS
COPYRIGHT
2014
Acknowledgments
I am greatly indebted to my advisor Hanming Fang for his guidance and support. His
continuous help and encouragement have been essential in every stage of my graduate
studies. No words can express my deep respect toward him. I would like to thank my
dissertation committee members, Katja Seim, Robert J. Town and Kenneth I. Wolpin.
Their insights and enthusiasm in economics have inspired me and helped shape my
research greatly. I am enormously grateful for their valuable comments. I thank all
of the Penn Economics faculty for being great examples of dedicated researchers and
teachers.
I am also grateful to Jaesung Choi, N. Mattis Gornemann, Ilwoo Hwang,
Eun-young Shim, Minchul Shin, Dongho Song, Suryun Rhee and Chamna Yoon for their
friendship. They made my life at Penn much more enjoyable. Special thanks go to
Naoki Aizawa. I feel extremely blessed to have him as my friend and co-author.
My deepest thanks go to my beloved family. They are my source of confidence
and hard work. I could not have made it this far without the unconditional love
and support from my wife, Aileen. Her patience and support was crucial especially
in completing last years of my graduate studies. I cannot thank her enough for
everything she has done for me. I also thank my parents for trusting my choices of
pursuing a doctoral degree and believing in me. They are the best parents anyone
could ask for. Last but not least, I am also thankful to my parents-in-law and my
ABSTRACT
ESSAYS ON PRIVATE MEDICARE INSURANCE MARKETS
You Suk Kim
Hanming Fang
This dissertation consists of two essays in economics of industrial organization on
pri-vate Medicare insurance markets. In the first chapter, together with Naoki Aizawa,
we study the incentives for private health insurers to use advertising to attract healthy
individuals in the market for private Medicare plans called Medicare Advantage (MA).
Using data on the advertising expenditures of MA plans, individual-level and
county-level MA enrollment, we document a large difference in an insurer’s potential profits
from healthy vs. unhealthy individuals. We then develop and estimate an
equilib-rium model of the MA market, which incorporates strategic advertising by insurers.
Parameter estimates show that advertising has much larger effects on the demand of
the healthy. We find that advertising accounts for 15% of the selection of healthier
individuals into Medicare Advantage. In the second chapter, I study how consumer
search frictions affect adverse selection and competition in the Medicare Supplement
Insurance (Medigap) market. Using data on individual-level and market-level
Medi-gap enrollment and claim costs, I estimate an equilibrium model of the MediMedi-gap
market, which incorporates consumer search frictions and adverse selection.
Parame-ter estimates show that search frictions are significant and that unhealthy consumers
tend to face greater search costs. I find that the correlation between search costs and
health risks reduces the extent of adverse selection by keeping unhealthy consumers
government provides more information on available options, I find that the extent of
Contents
I
Advertising Competition and Risk Selection in Health
Insurance Markets: Evidence from Medicare Advantage
1
1 Introduction 1
2 Background on Medicare Advantage 7
3 Data and Preliminary Analysis 10
3.1 Data . . . 10
3.1.1 Individual-level Data . . . 10
3.1.2 Advertising Data . . . 13
3.1.3 Plan-level Data . . . 15
3.2 Preliminary Analysis . . . 16
4 Model 19 4.1 Demand . . . 19
4.2 Supply . . . 24
5 Identification and Estimation 27 5.1 Demand . . . 27
5.2 Supply . . . 31
5.3 Estimation Algorithm . . . 35
6 Estimates 35 6.1 Utility . . . 35
7 Counterfactual Experiments 40
7.1 Ban of Advertising . . . 40
7.2 Risk Adjustment . . . 43
8 Conclusion 45
II
Consumer Search Frictions, Competition and Adverse
Selection in Health Insurance Markets: Evidence from
Medi-gap
46
1 Introduction 47 2 The Medigap Market and Data 52 2.1 The Medigap Market . . . 522.2 Data . . . 55
2.3 Discussion of the Data . . . 57
2.4 Descriptive Statistics . . . 58
3 Model 61 3.1 Demand Side . . . 61
3.1.1 Utility . . . 62
3.1.2 Search Process . . . 64
3.1.3 Demand . . . 67
3.2 Supply Side . . . 70
4 Identification and Estimation 75 4.1 Identification . . . 75
5 Estimates 83
6 Model Fit 86
7 Counterfactual Analysis 87
8 Conclusion 89
A Constructing Health Status 90
B List of Plan Characteristics Included in the Model 94
C Figures and Tables 95
D Proof for Choice Probability 109
E Figures and Table 111
List of Tables
1 Capitation Payment and Health Expenditure by Health Status in Los
Angeles County . . . 2
2 Plan Characteristics Included in Analysis . . . 94
3 Capitation Payments and Demographic Characteristics . . . 95
4 Summary Statistics at County Level . . . 97
5 Incentives for Risk Selection . . . 98
6 Relationship between Health Status and Over-payment by Location . 98 7 Relationship between Advertising and Capitation Payments . . . 99
8 Health Status and Insurer Choice by Medicare Beneficiaries . . . 100
9 Estimates for Key Parameters in Utility . . . 100
10 Elasticity of Demand with Respect to Advertising and Premiums . . 100
11 Estimates for Parameters in Mean Utility (δjmt) . . . 101
12 Estimates for Preference Heterogeneity . . . 102
13 Estimates for Marginal Costs of Providing Insurance . . . 103
14 Estimates for Marginal Costs of a Unit of Advertising . . . 103
15 Ban on Advertising . . . 104
16 Consumer’s Surplus with a Ban on Advertising . . . 104
17 Health Compositions in traditional Medicare vs MA (Ban on Advertising)105 18 Risk Adjustment . . . 105
19 Consumer’s Surplus with Risk Adjustment . . . 106
20 Health Risk Compositions in traditional Medicare vs MA (Risk Ad-justment) . . . 106
21 Logit Regression for Positive Medicare Claims Cost . . . 107
23 Medigap Market Concentration . . . 111
24 Plan C in PA . . . 112
25 Descriptive Statistics for Medigap Plans . . . 112
26 Descriptive Statistics from the MCBS . . . 113
27 Correlation Coefficient between Health Status and Internet Usage . . 113
28 Linear Probability Model for Medigap Choice . . . 114
29 Relationship between Average Claims Cost and Premium . . . 114
30 Estimates for Search Cost . . . 115
31 Utility Estimates . . . 115
32 Medigap Demand and Willingness to Pay by Health Status . . . 115
33 Estimates for Brand Effects and Sampling Probability . . . 116
34 Distribution of Numbers of Insurers in an Initial Choice Set . . . 116
35 Elasticity . . . 116
36 Estimates for Claims Cost . . . 117
37 Model Fit: Medigap Takeup Probability . . . 117
38 Model Fit: Medigap Claims Cost by Health Status . . . 118
39 Model Fit: Aggregate Claims Cost . . . 118
40 Information Provision in a Partial Equilibrium . . . 118
List of Figures
1 Relationship between Health Status and Over-payment by Location . 96
Chapter I
Advertising Competition and Risk
Selection in Health Insurance
Markets: Evidence from Medicare
Advantage
1
Introduction
Medicare provides health insurance for the majority of elderly Americans. Although
traditional fee-for-service Medicare is public insurance provided by the government,
many Medicare beneficiaries opt out of traditional Medicare to receive coverage from
Medicare Advantage (MA) plans offered by private insurance companies. A main
factor that differentiates MA plans from traditional Medicare is the provision of
ad-ditional services at the cost of a restricted provider network. In 2011, about 25% of
Medicare beneficiaries enrolled in MA. An MA plan receives a capitation payment
from the government for its enrollee and then bears the health care costs incurred by
the enrollee. The capitation payment accounts for most of the plans’ revenues, even
though MA plans often charge a premium.
A potential problem of MA is that private insurers have incentives to selectively
enroll low-cost, healthy individuals (or “risk-select”) due to an imperfect risk
adjust-ment of capitation payadjust-ments. Table 1 illustrates the presence of strong incentives
Los Angeles but also in other regions throughout the nation. Given that regulations
prohibit an MA plan from charging different premiums to individuals with different
health risks, the opportunity to increase profits by enrolling healthier individuals
pro-vides insurers incentives to risk-select. Moreover, there is regional variation in the
amounts of over-payment for the healthy, which creates incentives for MA plans to
risk-select more intensively in regions with these higher over-payments. Indeed,
pre-vious research on MA finds that MA enrollees are healthier than traditional Medicare
enrollees.1 Although preference heterogeneity between healthy and unhealthy individ-uals for MA plans can partly account for the observed selection patterns, incentives
for risk selection, as illustrated by Table 1, are strong.
Table 1: Capitation Payment and Health Expenditure by Health Status in Los Angeles County
Self-reported Health Status
Excellent Very Good Good Fair Poor Monthly Capitation Payment ($) 601.0 619.5 646.6 708.0 796.3 Monthly Health Expenditure ($) 266.0 347.8 575.4 923.7 2029.4
Monthly Over-payment ($) 335.0 271.3 71.2 -215.7 -1233.1
Note: Over-payment = Capitation payment - Health Expenditure. Source: Medicare Current Beneficiary Survey 2000–2003
The main goal of this paper is to empirically study incentives for private insurers
to use advertising as a means of risk selection and the impacts of advertising on the
MA market. Previous work on risk selection views advertising as one of the central
tools of risk selection (Van de Ven and Ellis 2000; Brown et al. 2012). MA plans might
target advertising to healthy beneficiaries, for example, through its content (Neuman
et al. 1998; Mehrotra et al. 2006). Moreover, advertising can be targeted to regions
having greater over-payments for the healthy. When private insurers can risk-select
with advertising, the effects will not be limited to MA enrollees and insurers, but
the government’s budget will also be affected through over-payments for the healthy.
Despite the potential importance of advertising in MA, however, there is no existing
quantitative analysis on the effects of advertising on risk selection or its effects on
health insurance markets in general.
In order to understand the role of advertising, we develop and estimate an
equilib-rium model of the MA market, which incorporates strategic advertising by insurers.
On the demand side of the model, consumers make a discrete choice to enroll with one
of the available MA insurers or to select traditional Medicare. We assume advertising
affects a beneficiary’s indirect utilities, thus capturing persuasive, prestige and
signal-ing effects of advertissignal-ing. We capture the effect of advertissignal-ing on risk selection with
its heterogeneous effects on demand, depending on an individual’s health status.
Cus-tomer preferences for a plan also depend on its other characteristics such as premiums
and coverage benefits. On the supply side, insurers simultaneously choose premiums
and levels of advertising to maximize profits. A firm’s revenue from an enrollee equals
the sum of the premium and capitation payment for the enrollee, while its cost of
in-suring an enrollee depends on plan characteristics and the enrollee’s health risk. Thus
the optimal pricing and advertising of a plan takes into account the effects of these
choices on the plan’s composition of health risks.
Our empirical analysis relies on data from a variety of sources. First, we use data
on advertising expenditures by health insurers in the 100 largest local advertising
mar-kets for the period 2000–2003 from AdSpender Database of Kantar Media, a leading
market research firm.2 Second, we use data on individual MA insurer choices, together
with information on the respondents’ demographic and health statuses. Third, we use
2A local advertising market consists of a major city and its surrounding counties, and the 100
data sets published by the Center for Medicare and Medicaid Services, which have
information on the number of enrollees and plan benefit characteristics for each plan
in each county in each year and capitation payments in each county in each year. The
data show the potential importance of advertising in relation to risk selection: There
is a large variation in advertising expenditures across local markets, and advertising
efforts by insurance companies are concentrated in markets with higher margins from
enrolling healthier individuals. Within a market, moreover, healthier individuals are
more likely to enroll with MA insurers that use more advertising.
We estimate the demand and supply side of the model in two steps, using
gener-alized method of moments. For estimation of the demand model in the first step, we
allow for time-invariant plan fixed effects and use instrumental variables to account
for the endogeneity of premiums and advertising stemming from (time-varying)
un-observed plan heterogeneity. In the second step, the supply model is estimated using
the estimated demand model and optimality conditions for observed pricing and
ad-vertising choices by insurers. In the supply model, we account for the possibility that
insurers choose zero advertising, which is frequently observed in the data. Parameter
estimates show that advertising has a positive effect on overall demand, but a much
larger effect on healthier consumers.
With the estimated model, we investigate the effects of advertising on the MA
market and evaluate the effects of a policy that adjusts capitation payments based on
an individual’s health risks. In order to investigate the effect of advertising on the MA
market, we simulate the model in an environment in which advertising is banned. The
ban decreases overall MA enrollment by 4% and enrollment for MA plans with
above-average advertising spending by 9%. Despite the lower demand without advertising,
we find that insurers lower their premiums by very little, which results from the
the MA insurers’ cost. The absence of advertising decreases the difference in the
expected health expenditures of enrollees in traditional Medicare and MA by 15%,
which reduces the average excess capitation payment per MA enrollee by 4%. This
finding implies that risk selection with advertising accounts for 15% of the selection
of healthier individuals into MA.
We also investigate the effects of a policy that reduces the incentive for risk
selec-tion. We consider a perfectly risk-adjusted capitation payment so that the difference
between an enrollee’s capitation payment and expected health expenditure is the same
for any individual. We find that the risk adjustment policy has large effects on the
equilibrium. Monthly premiums increase from $30.1 to $51.1; advertising
expendi-tures decrease by 30%; and overall MA enrollment rates decrease by 9%. Because
the risk adjustment policy reduces capitation payments for healthy enrollees, insurers
compensate for the decrease in revenues by increasing premiums. Moreover, insurers
reduce advertising because insuring the healthy is now less profitable. These findings
highlight a strong link between risk selection and advertising.
This paper contributes to a large body of literature empirically investigating
ad-verse selection and risk selection in insurance markets. Previous research finds that an
individual’s heterogeneous characteristics, such as risk, risk preference, income, and
cognitive ability, are important determinants of selection patterns in insurance
mar-kets.3 More recently, researchers empirically investigated the possibility that the
in-surer affects consumer selection in different health insurance market settings. Bauhoff
(2012) studies risk selection in a German health insurance market by looking at how
insurers respond differently to insurance applications from regions having different
profitabilities. Brown et al. (2012) provide descriptive evidence that insurers engage
3For examples, see Chiappori and Salanie (2000) for automobile insurance, Finkelstein and
in risk selection in MA, using the introduction of sophisticated risk adjustment of
capitation payments to MA plans. Kuziemko et al. (2013) study risk selection among
private Medicaid managed-care insurers in Texas and provide evidence that the
insur-ers risk-select more profitable individuals. Although the occurrences of risk selection
are well documented in the related works, there is still little research on its
chan-nels. This paper adds to this literature by investigating the role of advertising on risk
selection.
Our focus on an insurance company’s behavior in insurance markets is related to
a new and growing body of literature studying demand and competition in insurance
markets. For example, Lustig (2011) studies adverse selection and imperfect
compe-tition in MA with an equilibrium model that endogenizes a firm’s choice of premium
and plan generosity by creating an index of generosity. Starc (2012) investigates the
impact of adverse selection on an insurer’s pricing and consumer welfare in an
imper-fectly competitive market (Medicare supplement insurance).4 This paper adds to this literature by examining how advertising, which is a less explored and less regulated
channel relative to competition on pricing and coverage, affects risk selection and
competition.
Lastly, this paper is also related to the literature on advertising. Many
empiri-cal papers in the literature study the channels through which advertising influences
consumer demand–i.e., whether advertising gives information about a product or
af-fects utility from the product.5 More recently, researchers have studied the effects of advertising in an equilibrium framework for different markets. Goeree (2008) studies
advertising in the personal computer market in the U.S., and Gordon and Hartmann
4For other works in this literature, see Bajari et al. (2011); Bundorf et al. (2012); Carlin and
Town (2007); Cohen and Einav (2007); Dafny and Dranove (2008); Einav et al. (2010a,b); Nosal (2012); Town and Liu (2003).
(2013) study advertising in a presidential election in the U.S. A paper that is closely
related to ours is Hastings et al. (2013), who also study advertising in a privatized
government program (the privatized social security market in Mexico). An important
difference between this paper and the related works on advertising is that advertising
in MA affects not only consumers and insurers but also the government. If MA
insur-ers can risk-select with advertising, the enrollment decisions made by healthy
individ-uals will directly affect government expenditures because the government over-pays
for the insurance of these individuals.
The paper is organized as follows. Section 2 describes Medicare Advantage in
greater detail. Section 3 describes the data and presents results from the
prelimi-nary analysis. Section 4 outlines the model while Section 5 discusses estimation and
identification of the model. Section 6 provides estimates of the model, and Section 7
describes results from counterfactual analyses. Section 8 concludes.
2
Background on Medicare Advantage
Medicare is a federal health insurance program for the elderly (people aged 65 and
older) and for younger people with disabilities in the United States. Before the
in-troduction of Medicare Part D in 2006, which provides prescription drug coverage,
Medicare had three Parts: A, B, and C. Part A is free and provides coverage for
inpatient care. Part B provides insurance for outpatient care. Part C is the Medicare
Advantage program, previously known as Medicare + Choice until it was renamed in
2003.6
The traditional fee-for-service Medicare is comprised of Parts A and B, which
reimburse costs of medical care utilized by a beneficiary who is covered by Parts A
6Although we will focus on the period 2000–2003 for our analysis, we will refer to Medicare private
and B. As an alternative to traditional Medicare, a Medicare beneficiary also has
the option to receive coverage from an MA plan run by a qualified private insurer.
Insurers wishing to enroll Medicare beneficiaries sign contracts with the Center for
Medicare and Medicaid Services (CMS) describing what coverage they will provide,
and at what costs. The companies that participate in the MA program are
usu-ally health maintenance organizations (HMOs) or preferred provider organizations
(PPOs), many of which have a large presence in individual or group health insurance
markets, such as Blue Cross Blue Shield, Kaiser Permanente, United Healthcare, etc.
They contract with the Center for Medicare and Medicaid Services on a county-year
basis and compete for beneficiaries in each county where they operate.
The main attraction of MA plans for a consumer is that they usually offer more
comprehensive coverage and provide benefits that are not available in traditional
Medicare. For example, many MA plans offer hearing, vision, and dental benefits
which are not covered by Parts A or B. Before the introduction of Part D, prescription
drug coverage was available in MA plans, but not in traditional Medicare. Although a
beneficiary in traditional Medicare is able to purchase Medicare supplement insurance
(known as Medigap) for more comprehensive coverage than basic Medicare Parts
A and B, the Medigap option is priced more expensively than a usual MA plan,
many of which require no premium. Therefore, MA is a relatively cheaper option
for beneficiaries who want more comprehensive coverage than traditional Medicare
offers. In return for greater benefits, however, MA plans usually have restrictions on
provider networks. Moreover, MA enrollees often need a referral to receive care from
specialists. In contrast, an individual in traditional Medicare can see any provider
that accepts Medicare payments.
likely to enroll in a MA plan.7 The selection pattern may result from preference
heterogeneity between healthy and unhealthy individuals for MA plans. For
exam-ple, unhealthy individuals may dislike certain aspects of MA plans such as restricted
provider networks and referral requirements. However, it is also possible that
insur-ers’ risk-selection reinforces the direction of consumer selection. Indeed, incentives for
MA plans to risk-select are strong. By regulation, MA insurers must charge the same
premium for individuals with different health statuses in a county. More importantly,
capitation payments from the government do not fully account for variation in health
expenditures across individuals. Until the year 2000, the CMS paid capitation
pay-ments equal to 95% of the expected costs of treating a beneficiary within traditional
Medicare, and adjustments to payments were made based only on an enrollee’s age,
gender, welfare status, institutional status, and location. However, these adjustments,
based solely on demographic information, were found to account for only about 1%
of an enrollee’s expected health costs (Pope et al. 2004). During the period of 2000–
2003, which is a focus of this paper, the CMS made 10% of capitation payments
depend on inpatient claims data using the PIP-DCG risk adjustment model, but the
fraction of variations in expected health costs by the newer system remained around
1.5% (Brown et al. 2012).8
7For example, see Langwell and Hadley (1989); Mello et al. (2003); Batata (2004).
8From the year 2004, a more sophisticated risk adjustment model is implemented. However,
3
Data and Preliminary Analysis
3.1
Data
This paper combines data from multiple sources. We use the Medicare Current
Ben-eficiary Survey (MCBS) for the years 2000–2003 for individual-level information on
MA enrollment and demographic characteristics, including health status. Our data
on advertising by health insurers in local advertising markets for the years 2000–2003
were retrieved from the AdSpender Database of Kantar Media, a leading market
re-search firm. Market share data for the years 2000–2003 are taken from the CMS
State-County-Plan (SCP) files, and insurers’ plan characteristics are taken from the
Medicare Compare databases for the years 2000–2003.9
The reason we study MA for the years 2000–2003 is because the MCBS does not
provide information on an individual’s choice of MA insurer from 2006 onward. We
also avoid using data right before 2006 because Medicare Part D was introduced in
that year, changing many aspects of the MA market.
3.1.1 Individual-level Data
The MCBS is a survey of a nationally representative sample of Medicare beneficiaries.
This dataset provides information on a beneficiary’s demographic information such
as age, income, education, and location, as well as an extensive set of variables on
an individual’s health status: self-reported health status, difficulties in activities of
daily living (ADL), difficulties in instrumental activities of daily living (IADL), and a
history of diseases such as cancers, heart diseases, diabetes, etc. An important feature
of this dataset is that it is linked to administrative data in Medicare, which provides
information on an individual’s MA insurer choice, the amount of the capitation
ment paid for an MA enrollee in the sample, and the amount of Medicare claims costs
for individuals in traditional Medicare.
For our analysis, we only use observations who are at least 65 years old. This
means that we exclude the sample of individuals under 65 who are on Medicare solely
due to disability. Although these individuals can purchase MA plans, we exclude
them because the main factor that affected capitation payments for the years 2000–
2003 was age and because we want to have samples of individuals who are more or
less similar in terms of their capitation payments. Because beneficiaries younger than
65 years old represent a small fraction of MA enrollment (7%), we do not view this
exclusion as a serious problem.
Health status An important variable from this dataset is an individual’s health
status. A health status can be measured in many different ways, and there are
plenty of variables in the MCBS that are related to health status. Because it is
very difficult to include all possible measures separately in the empirical analysis,
we construct a one-dimensional continuous measure of health status. Our measure
of an individual’s health status is expected claims costs if an individual were to be
insured by Medicare Parts A and B. To construct this measure of health status, we use
information on an extensive set of observed health statuses and the realized amount
of Medicare Parts A and B claims for each individual who remained in traditional
Medicare. Because information on Medicare claims is available only for individuals
in traditional Medicare, we have to impute expected claims costs for MA enrollees
using their observed health statuses. Thus, we first estimate equations that relate
Medicare claims costs to an extensive list of health characteristics using beneficiaries
for traditional Medicare enrollees, but also for MA enrollees.10 A detailed discussion
on constructing the health status variable is in the Appendix.
Capitation Payment For our analysis, we need to know how much an MA plan
would receive when enrolling a Medicare beneficiary with certain characteristics.
Un-fortunately, the MCBS does not provide such information. Instead, it contains
infor-mation on how much an MA plan received for a Medicare beneficiary enrolled in MA.
In order to calculate a capitation payment amount for an enrollee, we exploit the fact
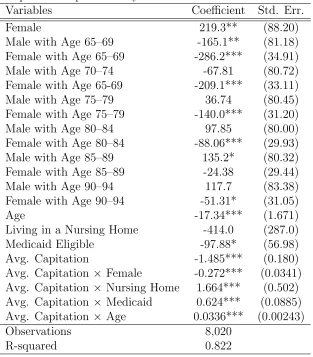
that capitation payments were mostly based on the simple demographic factors for
the years 2000–2003, as described in the previous section.11 First, we regress an actual
capitation payment for an MA enrollee in the MCBS on the enrollee’s demographic
characteristics that are used in the calculation of actual capitation payments. With
coefficient estimates from the regression, we calculate a capitation payment for any
Medicare beneficiary. Because capitation payments depend only on exogenous
demo-graphic characteristics, selection bias is not a concern here even though the regression
is run with data on MA enrollees only. The coefficient estimates in the regression are
reported in Table 3. The results show that the variables included in the regression
explain a large part of variation in capitation payments, with R-squared of 0.822.
The estimates are used to calculate a capitation payment amount for all Medicare
beneficiaries including those who chose traditional Medicare.
10An implicit assumption here is that traditional Medicare and MA enrollees do not differ in
unobserved health status. Given the extensive list of variables on health status used in imputation, however, it is reasonable to assume that we can capture most of the meaningful differences in health status.
11As explained in the previous section on MA, 10% of capitation payments depended on inpatient
3.1.2 Advertising Data
AdSpender contains information on the annual advertising expenditures and
quan-tities of health insurers in different media such as TV, newspaper, and radio in the
100 largest local advertising markets in the U.S. A local advertising market consists
of a major city and its surrounding counties, and its size is comparable to that of a
Metropolitan Statistical Area (MSA).12Advertising quantity is defined as the number
of times an advertisement appeared in a medium in a given period, and this
infor-mation is only available for TV and newspapers. AdSpender categorizes advertising
across product types whenever specific product information can be detected in an
advertisement, which allows us to isolate advertising expenditures for an insurer’s
MA plan in some instances. For example, some expenditures are reported in detail
(e.g. Humana Gold plan, which is an MA plan offered by Humana Insurance
Com-pany), while others are reported more generally (e.g., Blue Cross Blue Shield health
insurance in general). An advertisement falls into the latter category when it does
not mention product names, or when it is for an insurer itself (not for its specific
products).
In constructing a measure of advertising levels for MA plans, we excluded
adver-tising expenditures specific to insurance products that are not MA plans. Whenever
information on a product is available in the data, for example, we can tell whether the
product was sold in individual or group markets for individuals not on Medicare. In
the end, we use advertising expenditures for MA plans and general advertising
expen-ditures. Because the latter is likely to be meant not only for the Medicare population
but also for the non-Medicare population, we make adjustments for expenditures for
general advertisements, while we do not make any changes to advertising
expendi-12In the advertising industry, this local market is usually referred to as a Designated Media Market,
tures for MA plans. To be more precise, we denote adma
jmt and ad
g
jmt as a firm j’s
MA-specific and general advertising expenditures in a local advertising market m in
year t, respectively. Our final measure of advertising expenditures for firm j’s MA
plans in market m in yeart,adjmt, is that:
adjmt=admajmt+ψmtadgjmt
whereψmt∈[0,1] is a number we use to adjustadgjmt. An important issue here is the
choice of ψmt. For example, if ψmt = 1, the total advertising spending for MA will
simply be the sum of the two kinds of advertising expenditures, which may overstate
“true” MA advertising spending. For our analysis, we useψmtequal to the fraction of
the population that is at least 65 years old in each advertising market. Although the
choice ofψmt is not likely to lead to a perfect measure of advertising expenditures for
MA, the choice of ψmt will be a reasonable proxy for the relative importance of MA
business for a firm operating in a local advertising market.13
In our analysis, we do not distinguish between an insurer’s advertising
expendi-tures in different media.14 Instead, we use an insurer’s total advertising expenditure
in a local advertising market by summing the insurer’s advertising expenditures across
all media in the market. In analysis, we also use an insurer’s total advertising quantity.
Because information on advertising quantity is available only for TV and newspaper
advertising, and because a unit of TV advertising is very different from a unit of
newspaper advertising, we measure an insurer’s advertising quantity in terms of
TV-advertising-equivalent quantity. We construct this variable by dividing an insurer’s
13We plan to conduct robustness checks for the choice ofψ mt.
14We make this choice for two reasons. The first reason is that advertising in different media
total advertising expenditures in a local advertising market by the average cost of a
unit of TV advertising in the market.
3.1.3 Plan-level Data
The Medicare Compare Database is released each year to inform Medicare
beneficia-ries which private insurers are operating in their county, what plans they offer, and
what benefits and costs are associated with each plan. We take a variety of plan
benefit characteristics from the data such as premiums, dental coverage, vision
cov-erage, brand and generic prescription drug covcov-erage, and the copayments associated
with prescription drugs, primary care doctor visits and specialist visits, emergency
room visits, skilled nursing facility stays, and inpatient hospital stays. In addition to
information about plan benefits, the data also provide information from report cards
on MA plan quality.15 We use four measures of plan quality: ease of getting referral to specialists, overall rating of health plan, overall rating of health care received, and
how well doctors communicate.
The CMS State-County-Plan (SCP) files provide the number of Medicare
bene-ficiaries, number of enrollees of each MA insurer, and average capitation payments
in each county-year. A problem with this dataset is that although many insurers
offer multiple plans in the same county, the aggregate enrollment information is at
the insurer-county-year level, not at the plan-insurer-county-year level. One way to
deal with this issue is by taking the average of characteristics of plans offered by an
insurer as representative characteristics of the insurer; and another approach is to
take the base plan of each MA insurer as a representative plan because the base plan
15Dafny and Dranove (2008) find that the report cards on MA plan quality had an impact on
is usually the most popular.16 17 For the current version of this paper, we take the
first approach, and, as a result, each MA insurer will have only one representative
plan available in each county in analysis.
3.2
Preliminary Analysis
In this section, we provide summary statistics from the data and descriptive
evi-dence on how advertising relates to risk selection. Table 4 displays characteristics
of counties depending on total advertising spending in a local advertising market to
which a county belongs. Although there are plenty of counties having no advertising
spending, these counties are small in population. There is also a strong correlation
between advertising and other county-level characteristics. Counties with larger
ad-vertising expenditures tend to have a larger fraction of Medicare beneficiaries in MA,
higher capitation payments, higher health care costs in terms of traditional Medicare
reimbursement rates, and more MA insurers.
Table 5 shows the presence of strong incentives for risk selection in MA. A common
pattern observed in this table is that monthly capitation payments do not account for
the large variation in health expenditures across individuals having different health
statuses. MA insurers are paid capitation payments greater than necessary to cover
the health expenditures of relatively healthy individuals whereas capitation payments
16Previous research on MA also faced the same issue and had to deal with the issue in one of these
ways. For examples, see Hall (2007); Nosal (2012).
17Another approach taken previously by Lustig (2011) is to use the individual-level data, MCBS.
for relatively unhealthy individuals are not sufficient to cover their health
expendi-tures. As a result, MA insurers would have very strong incentives to selectively enroll
healthier individuals in any county. Moreover, there is regional variation in incentives
for risk selection. In counties belonging to local advertising markets with relatively
large advertising spending, enrolling healthy individuals is more profitable, and
en-rolling unhealthy individuals results in a larger loss.18
In order to investigate incentives for risk selection and their regional variation
more precisely, we run the following regression with the individual-level data:
Overpaymenti =β1rhi+β2rhi×capct+β3capct+Xiγ+i
Overpaymenti is the difference between in individual i’s capitation payment and
health status (measured in terms of expected traditional Medicare claims costs), which
are calculated with the individual-level data;rhiis individuali’s relative health status,
which is defined as a ratio of individuali’s health status to the average Medicare claims
cost in county c where individual i resides in year t; capct is the average capitation
payment in countycin yeart; andXi is a vector of other controls that determine the
capitation payment for individual i such as age, Medicaid status, and institutional
status. Regression results are presented in Table 6. Because the minimum
county-level average capitation payment is larger than 200, ˆβ1+ ˆβ2capct < 0 in any county
in any year. This means that more over-payments will be made in regions having
healthier individuals (lower rhi). Moreover, ˆβ2rhi + ˆβ3 > 0 for rhi < 0.97, and the
median and mean ofrhiare 0.6 and 0.89, respectively. This means that over-payments
18The regional variation results from the fact that the average and variance of health expenditures
for relatively healthy individuals are greater in regions with higher average capitation
payments. These results are summarized in Figure 1, which is based on an individual
of age 75 who is not eligible for Medicaid and not living in a nursing home. The plots
show that MA plans can increase profit by enrolling healthier individuals and that
risk selection is more profitable in regions with higher average capitation payments.
Now given that insurers have more incentives for risk selection in regions with
higher capitation payments, we investigate how an insurer’s advertising in a local
adverting market is related to regional variation in capitation payments with the
following regressions:
adjmt = βcapmt+Xmtγ+δj +jmt
adjmt = βcapmt+Xmtγ+ξjm+jmt
The two regressions are different only with respect to fixed effects. In the first
specifi-cation,δj denotes insurer fixed effects which are invariant over local advertising
mar-kets (m). In the second specification, ξjm denotes insurer-advertising market fixed
effects. adjmt is either an advertising quantity or expenditure by insurer j in local
advertising market m in year t, depending on specification.19 cap
mt is the weighted
average ofcapct (the average capitation payment in countycin yeart) across counties
in local advertising marketm, with the population of each county as a weight. Xmtis
a vector of other control variables such as the population of market m, local TV
ad-vertising cost and number of competing insurers in an adad-vertising market. The results
are reported in Table 7. For any specification, the results indicate that more
adver-tising is done in local adveradver-tising markets with higher average capitation payments,
19After all, we run four different regressions. Each equation is estimated with each of the two
where over-payments for healthy enrollees are greater. That is, MA insurers’ amounts
of advertising respond to regional variation in the profitability of risk selection.
Lastly, Table 8 shows that individuals with different health statuses are likely to be
enrolled with different insurers. MA plans in general tend to have healthier Medicare
beneficiaries than traditional Medicare, which is consistent with previous findings on
selection into MA. Among MA insurers, moreover, firms with more advertising tend
to have healthier enrollees.
4
Model
As discussed in a previous section, MA insurers contract with CMS for each county
(c) in each year (t). As a result, consumers in different counties face different choice
sets. However, each advertising decision is typically made on the basis of a local
advertising market (m), which contains several counties. Thus we assume individuals
in differentcbut in the samemare exposed to the same advertising level by the same
firm. If countyc is included in ad market m, we denote c∈m.
4.1
Demand
Consider a consumer i, living in a county c(∈ m) in year t. Consumer i chooses to
enroll with one of the available MA insurers in eachcandtor in traditional Medicare.
We assume that consumeri, living in a countycin yeart, obtains indirect utilityuijct
from insurer j as follows:
where
g(adjmt, rhi;φ) = (φ0+φ1log(rhi))×log(1 +φ2adjmt);
αi = α0+α1log(rhi);
βi = β0+β1log(rhi).
Each insurer has observable characteristics (adjmt, pjct, and xjct), insurer-county
fixed effect (ξjc), and an unobservable characteristic (∆ξjct). First, adjmt denotes
insurer j’s advertising quantity in advertising market m in year t. The effect of
advertising on indirect utility uijct is captured by g(adjmt, rhi;φ), which depends
on individual i’s relative health status (rhi).20 Parameter φ0 reflects the effects of
advertising that are independent of an individual’s health status. The effects of
advertising on risk selection are captured by its heterogeneous effects on individuals
with different rhi (φ1). We assume that the effects of advertising diminish in its
quantity by assuming thatadjt entersg(·) in logarithm. Parameterφ2 determines the
curvature of function g(·).
With this specification of uijct, we assume that advertising affects indirect utility
from an insurer, which is consistent with the persuasive, prestige and signaling effects
of advertising. The persuasive and prestige effects of advertising would directly affect
utility from an insurer, for example, by creating a certain positive image associated
with the insurer (Stigler and Becker 1977; Becker and Murphy 1993). Indeed, many
advertisements for MA show images of seniors living healthy lives: engaging in
phys-ically demanding activities like running and golfing (Neuman et al. 1998; Mehrotra
et al. 2006). These advertisements may create a positive image associated with an
20rh
i is defined as a ratio of individual i’s health status (in terms of expected Medicare claims
insurer and lead to a higher utility level from a plan of that insurer. The signaling
effects of advertising will affect demand for an insurer through expected utility by
giving a signal about the (unobservable) quality of the insurer (Nelson 1974; Milgrom
and Roberts 1986). Because indirect utilityuijctis supposed to capture expected
util-ity from an insurer, g(adjmt, rhi;φ) will contain both effects of advertising. Another
possible effect of advertising we do not exactly model is the provision of information
about the existence of a product, which is likely to affect an individual’s
considera-tion set. If advertising in MA indeed has such effects, they will be captured as an
increase in g(adjmt, rhi;φ) because we do not model the effects of advertising on an
individual’s consideration set.21
pjct denotes the premium of plan jct which a consumer pays in addition to the
Medicare Part B premium.22 The effect of p
jct on utility is also potentially
heteroge-neous depending on an individual’s health status. This is captured by parameter α1.
xjct describes plan jct’s characteristics other than adjmt and pjct. For example, xjct
includes copayments for a variety of medical services such as inpatient care and
out-patient doctor visits and variables describing drug coverage, vision coverage, dental
coverage, etc. xjct also includes quality measures of insurers taken from report cards
on MA plan quality. The quality measures included inxjct are ease of getting a
refer-ral, overall rating of health care received through a MA plan, and how well doctors
21Effects of advertising on a consumer’s consideration set would be especially important in an
environment where the number of available insurers is so large that consumers cannot easily know about available options. In the MA market, however, the number of available insurers is limited for many individuals. About 40% of Medicare beneficiaries have at most two insurers available in their county of residence; and about 70% of Medicare beneficiaries have at most four insurers available in their county of residence. Thus, although the informative effects of advertising can be still important in the MA market, the effects are not likely to be as important as in markets with a large number of available products.
22When enrolling in a MA plan, an individual must pay the Medicare Part B premium as well as
the premium charged by the plan. Here I did not include Medicare Part B premium inpjct because
in a MA plan communicate.23 With these quality measures, we can control for an
insurer’s characteristics that would be usually considered unobserved. The effects of
xjct are potentially heterogeneous with parameterβ1 capturing the differential effects
of xjct on individuals having different health statuses.24
ξjc denotes insurer-county fixed effects that capture time-invariant unobserved
characteristics of insurer j in county c such as size and quality of the insurer’s
net-works in a region. An individual’s utility also depends on aspects of an insurer that
are unobserved by researchers but observed by consumers and insurers. ∆ξjct is a
time-specific deviation from ξjc. ∆ξjct captures time-varying unobserved
character-istics and/or shocks to demand for this insurer. We assume that ∆ξjct is known by
consumers and insurers when they make decisions. Lastly, ijct is idiosyncratic
pref-erence shock, which we assume is drawn from Type I extreme value distribution and
i.i.d across individuals, insurers, counties and years.
In the model, the outside option is to enroll in traditional Medicare, from which
a consumer receives utility of ui0ct:
ui0ct =ziλ+i0ct.
zi is a vector of an individual’s characteristics including relative health status (rhi),
age, Medicaid status, and whether the individual receives insurance benefits from
an (former) employer. These individual characteristics in ui0ct will control for the
possibility of different values of the outside option relative to MA, depending on
in-dividual characteristics. For example, Medicaid-eligible inin-dividuals will receive more
23A detailed list of the variables used in analysis is reported in the Appendix.
24In order to reduce the number of parameters to be estimated, we do not interact every variable in
xjctwith health status. We select which variables to interact with health status based on the results
comprehensive coverage in traditional Medicare without having to pay an additional
premium. Those who receive insurance benefits from employers will also have a
dif-ferent value of the outside option compared to individuals only with basic Medicare
Parts A and B coverage. Moreover, many Medicare beneficiaries in traditional
Medi-care purchase MediMedi-care supplement insurance (so-called Medigap). Medigap is used
in conjunction with traditional Medicare and covers out-of-pocket expenditure risks
of individuals in traditional Medicare.25 Because we do not allow for an additional choice of purchasing Medigap in the model, the utility from the possibility of
purchas-ing Medigap is included in uioct. Previous research on Medigap finds that selection
into Medigap depends on an individual’s characteristics such as health status (Fang
et al. 2008). Then coefficientλwill also capture heterogeneous preference for Medigap
depending on zi. Moreover, it is possible that individuals have different preferences
for MA. For example, unhealthier individuals may dislike common aspects of MA
plans such as restricted provider networks and referral requirements for specialized
treatments. In this case, parameter λ will also capture heterogeneous preferences for
MA.
With the functional-form assumption on ijct, we can analytically calculate the
probability for an individual i with characteristics z to enroll plan jct. By defining
ujct(zi)≡uijct−ijct, we can write the choice probability for plan jct as follows:
qjct(z) =
exp (ujct(z))
exp(u0ct(z)) + P
k∈Jctexp (ukct(z))
(1)
Then aggregate market share for a firmjct is
Qjct =
ˆ
z
qjct(z)dFct(z) (2)
whereFct(z) is the distribution of individual characteristics z in county cand year t.
4.2
Supply
We assume that insurers play a simultaneous game in choosing optimal pricing and
advertising in each advertising market. In the model, a pricing decision is made
for each county (c) in each year (t), and an advertising decision is made for each
advertising market (m) in each year (t).
When insuring an individual with health status h (a nominal health expenditure,
not relative health rh) with plan characteristics xjct and market characteristics wct,
insurer jct expects to incur a marginal costcjct(h) as follows:
cjct(h) =xjctγ1+wctγ2+hγ3+ψj +ηjct. (3)
xjct is a vector of plan characteristics which are included in the utility specification of
a consumer such as drug coverage, copayment amounts for a variety of services, etc.
wctincludes county characteristics that can potentially influence the cost of providing
insurance, including the number of hospitals, skilled nursing facilities and physicians
in a county. For example, insurers may be able to negotiate lower payments with
providers in markets having a large number of physicians and hospitals (Ho 2009).
Importantly, the marginal cost of insuring a consumer depends on the consumer’s
health status h, and this aspect of cjct(h) creates incentives for risk selection. ψj is
a firm fixed effect that capture different administrative costs and different ways of
delivering health care at the firm level (e.g., Aetna, Blue Cross Blue Shield, Secure
Horizon, etc.). Lastly, ηjct is a firm-county-year-specific shock to marginal costs that
is constant across individuals with different h. We assume thatηjct is observed by all
Insurer j’s profit from a county c in year t, excluding advertising costs, is given
by:
πjct=Mct
ˆ
z
(pjct+capct(z)−cjct(h))qjct(z)dFct(z).
Mct is the population of those who are at least 65 years old in county c in year t,
which is the market size;pjctis the premium charged by insurerj in countycin yeart;
capct(z) is a capitation payment that depends on county, year, age, gender, Medicaid
status and institutional status; and qjct(z) is demand for insurer j by an individual
having characteristics z in (1).
Because each insurer makes an advertising decision for each advertising market,
we need to consider an insurer’s profit in an advertising market in order to analyze
its advertising choice. An insurerj’s profit in advertising market m and year t is:
πjmt = X
c∈m
πjct−mcjmtadjmt
where mcjmt is constant marginal cost per unit of advertising. We assume that
mcjmt= exp xadjmtγad+ζjmt
.
xad
jmtincludes the costs of TV advertising in media market min yeart, year dummies,
and dummy variables for large firms. We included eight dummy variables for each
of the eight largest firms. These dummy variables will capture different resources
constraints faced by different firms.26 27 ζ
jmt is a shock to the marginal cost, which
26Although marginal cost of advertising is assumed to be constant, some firms using large amounts
of advertising may face different advertising costs due to volume discounts. The dummy variables can capture the different discounts received by different firms having potentially different advertising amounts.
27Included insurers are Secure Horizon, Blue Cross Blue Shield, Kaiser Permanente, United
is also known by all insurers in a media market, but unobserved by researchers. We
assume that ζjmt ∼N(0, σζ2).28
Nash equilibrium conditions for the game for insurers are that insurers’ choices
maximize their profits given choices made by other insurers. For an insurer’s optimal
pricing condition, we have the following condition for each pjct:
∂πjmt
∂pjct
= ∂πjct ∂pjct
= 0. (4)
An insurer’s optimal advertising conditions are:
∂πjmt
∂adjmt
=X
c∈m
∂πjct
∂adjmt
−mcjmt
= 0 foradjmt >0
≤0 foradjmt = 0
. (5)
For the optimal advertising condition, we explicitly allow for the possibility of the
corner solution, which is no advertising.29 Because about 35% of insurer (j)-market
(m)-year (t) combinations do not advertise at all, we have to explicitly allow for the
possibility that insurers choose the corner solution. Condition (5) states that when
an insurer spends a positive amount of advertising spending, the optimal quantity
of advertising maximizes its profit, and that when an insurer does not advertise, its
profit gain from a small quantity of advertising should not be greater than its cost.
28The reason that we make a functional-form assumption forζwill be discussed in the section for
identification and estimation.
29Although premiums can be zero, we assume that even zero premium satisfies the pricing first
5
Identification and Estimation
For the discussion of identification and estimation of the model, we define θ as a
vector that contains all parameters in the model such thatθ = (θd, θs). θd and θs are
vectors of parameters that enter the demand and supply side, respectively.
5.1
Demand
Mean Utility In utility uijct, there are two kinds of parameters: θ1d and θ2d. We
define θ1d to be parameters that enter ‘mean utility’ δjct, which is a part of uijct that
does not depend on individual characteristics. Precisely,
δjct =φ0log(1 +φ2adjmt) +α0pjct+xjctβ0+ξjc+ ∆ξjct. (6)
θ2d is defined as parameters for interaction terms between insurer characteristics and individual characteristics. We let φ2, which determines diminishing returns of
adver-tising effects, be a part of θd
2. Berry et al. (1995) show that given a value forθ2d, there
is a unique δjct∗ (θd
2) that solves for the system of equations given by the aggregate
market share equation (2). Then parameter θd
1 is estimated using equation 6. A
well-known problem regarding identification of θd
1 is that the unobserved characteristic
(∆ξjct) and two endogenous variables in the model (pjct and adjmt) are correlated,
because ∆ξjct is assumed to be known by consumers and insurers when they make
decisions. This problem is a typical endogeneity problem, and then a simple
ordi-nary least squared regression of δ∗jct(θd
2) on the observed variables in (6) will result in
inconsistent estimates of θd
1.
Although the endogeneity problem causes challenges in identification, fixed effects
insurers. Important characteristics that are not included in xjct are an insurer’s
network size and quality in a local market. For example, Kaiser Permanente, which
is one of the largest insurers in California, has a more extensive network in California
than in other regions. As long as such characteristics do not vary much over the
time period considered in this paper, they will be controlled for by ξjc. Moreover,
xjct includes an insurer’s quality measures from report cards on MA plan quality,
such as ease of getting a referral, overall rating of an insurer, overall rating of health
care received, and how well an insurer’s physicians communicates with patients. By
including these characteristics, we will be able to control for characteristics that would
usually be considered unobservable.
However, it is still possible that xjct cannot capture all relevant characteristics
of an insurer that vary over time, which will result in the endogeneity problem. A
typical approach to accounting for the endogeneity problem is to use instruments
that are correlated with the endogenous variables, but not with the unobservable.
We construct two sets of instruments. The first set of instruments are the averages of
premiums and advertising of the same parent company in other advertising markets.
The use of functions of endogenous variables in other counties as instruments is a
strategy similar to Hausman (1996) and Nevo (2001). Town and Liu (2003) use
similar instruments in estimating a model of demand for MA plans. The identifying
assumption is that demand shock ∆ξjct is not correlated with shocks affecting the
premiums of insurer j in other markets, such as demand and marginal cost shocks
in the markets. A similar identifying assumption is made for advertising of the same
firm in other markets. A premium in a county will be correlated with the average
premiums of the same firm in other markets through, for example, common
company-level components affecting premiums. The same argument also holds for advertising.
ad-vertising choices, but do not affect utility directly. One such variable is the cost of
a unit of TV advertising in a local advertising market, which affects an advertising
decision, but does not affect utility directly. Other such variables are capitation
pay-ments in other counties in the same advertising market. Because capitation paypay-ments
in other counties in the same advertising market will affect advertising in the
adver-tising market, the payments in other counties can be valid instruments as long as they
do not enter the utility of a consumer in a county.30
Resulting moment conditions employed in the estimation are:
E[∆ξjct|Γ] = 0. (7)
Γ is a set of instruments that includes the aforementioned two sets of instruments as
well as xjct.
Preference Heterogeneity Important information for identification of parameters
for preference heterogeneity θd
2 is an individual’s insurer choice from the MCBS (the
individual-level data). Parameter θd
2 will be identified by variation in the
character-istics of insurers chosen by individuals having different charactercharacter-istics. Identification
of θd2 is aided by variation in insurer characteristics, not only across insurers within a region but also across regions. For example, advertising quantities vary across
lo-cal advertising markets depending on how profitable risk selection is in the market,
as illustrated in the previous section for preliminary analysis. Moreover, individuals
in different regions will have different choice sets, and this variation in choice sets
provides information on the substitution patterns of different individuals.
An important parameter inθd
2 is the parameter that determines the heterogeneous
30The second instrument using capitation payments in other counties is similar to the instruments
effect of advertising depending on an individual’s health status (φ1), which captures
the effect of advertising on risk selection. A potential concern in identifyingφ1 is that
there may be insurer characteristics, not included in xjct but correlated with adjmt,
that have different effects on the demand of individuals having different health status.
Given the available data, it is impossible to allow for insurer-county fixed effects ξjc
that depend on an individual’s health status and to control for them.31 In order to alleviate this concern, we interact many different variables in xjct with health status,
including not only usual characteristics such as drug coverage and copayments but
also the quality measures from report cards on MA plans and dummy variables for
each of the seven largest insurers. The latter variables are highly correlated with
adjmt, and their interactions with health status will limit the role of omitted insurer
characteristics that can have differential effects on individuals having different health
statuses. The quality measures will control for important aspects of insurers, with
potential heterogeneous effect, that cannot be described by usual coverage
character-istics. Moreover, an interaction between a dummy variable for a large insurer and
health status will capture an aspect of the insurer that may have differential effects
on individuals having different health statuses.
In order to construct micro-moments for an individual’s insurer choice and combine
them with aggregate moments (7), we use the score of the log-likelihood function for
a choice by an individual observed in the MCBS, as in Imbens and Lancaster (1994).
The likelihood function for an individual’s choice is:
L= Y
i,j,c,t
qjct(zi)dijct
31If there is information on an insurer’s aggregate market share by different health statuses, it is
where zi is a vector of characteristics of individual iin the individual-level data; and
dijct is an indicator variable that equals one when individualichooses planjct. Then
our micro-moments are
∂log(L) ∂θd
2
= 0. (8)
5.2
Supply
Cost of Providing Insurance Estimation of parameters of the supply side
re-lies on the optimality conditions for pricing and advertising, presented in (4) and
(13). The first order condition for optimal pricing (4) is equivalent to the following
condition:
Qjct+
´
z(pjct+capct(z)) ∂qjct(z)
∂pjct dFct(z) ∂Qjct
∂pjct
=
´
zcjct(h) ∂qjct(z)
∂pjct dFct(z) ∂Qjct
∂pjct
= xjctγ1+wctγ2+H(qjct, Fct)γ3 (9)
+ψj +ηjct (10)
where qjct(z) and Qjct are demand of an individual with characteristic z (which
in-cludes h) and aggregate demand for insurer j in county c in year t, respectively;
and
H(qjct, Fct)≡
´
zh ∂qjct(z)
∂pjct dFct(z) ∂Qjct
∂pjct
.
An examination of (9) reveals that its left-hand side is a function of demand side
parameters and data. Because demand side parameters can be identified with only
the demand model and data, the left-hand side of (9) can be treated as known.
Then optimality condition (9) leads to a linear estimating equation. Because we
characteristics wct are exogenous, we have the following moment conditions:
E[ηjct|xjct] = 0 and E[ηjct|wct] = 0. (11)
These assumptions will identify parameters γ1 and γ2.
However, we cannot have a similar condition for parameterγ3 becauseH(qjct, Fct)
is potentially endogenous to ηjct. Because an insurer’s choice of pjct will be directly
dependent on ηjct in the model, and because pjct will determine qjct(z), variable
H(qjct, Fct) may be correlated with ηjct. This endogeneity problem necessitates an
instrument that is correlated with H(qjct, Fct), but not with ηjct. In order to find
an instrument forH(qjct, Fct), it is important to understand what H(qjct, Fct) means.
By definition, H(qjct, Fct) measures the average health status of consumers
switch-ing from insurers jct to other insurers due to an increase in a premium of insurer
jct. Because an individual’s health status h is measured as expected claims cost for
Medicare Parts A and B, an important determinant of H(qjct, Fct) is overall health
care cost in county c in year t. As a result, H(qjct, Fct) must be highly correlated
with county-level average Medicare claims cost F F Sct, which exhibits large variation
across counties. Since we control for market characteristics wct that may influence an
insurer’s marginal cost, it is likely that F F Sct is uncorrelated with ηjct, which leads
to the identifying assumption for γ3 such that
E[ηjct|F F Sct] = 0. (12)
Advertising Cost The optimality condition for an advertising quantity (5)