Length of Stay and Cost of
Pediatric Readmissions
Jessica L. Markham, MD, MSc, a Matt Hall, PhD, a, b James C. Gay, MD, MMHC, c Jessica L. Bettenhausen, MD, a Jay G. Berry, MD, MPHdBACKGROUND AND OBJECTIVES: Readmissions burden the health care system. Despite increasing
attention to readmission rates, little is known about the duration and cost of readmissions. The objective of this study was to assess, nationally, the length of stay (LOS) and costs for 30-day readmissions in children.
METHODS: We performed a retrospective analysis of 30-day readmissions by using the 2013
Nationwide Readmissions Database. We used generalized linear mixed effects models adjusted for important clinical and demographic factors to assess LOS and cost for index admissions, readmissions, and the episode of care (index admission plus readmission).
RESULTS: A total of 125183 (4.5%) children had a 30-day readmission; 87.1% of readmissions
were to the same hospital. Readmitted children had an adjusted episode LOS that was 2 times longer (5.8 vs 2.9 days) and total costs that were 2.3 times higher ($12250 vs $5340) than those who were not readmitted. Associations of readmissions with episode LOS and costs varied significantly by condition (P < .001). Children readmitted to a different versus the same hospital had an episode LOS that was the same (5.8 days; P = .279) but higher episode of care costs ($15876 vs $11661; P < .001).
CONCLUSIONS: Readmitted children spend twice as many days in the hospital compared
with children who are not readmitted and have higher hospital costs, especially when readmitted to a different hospital. In addition to readmission rate, readmission metrics may benefit from measurement of total LOS and costs for both the index admission and its associated readmission.
abstract
aDivision of Pediatric Hospital Medicine, Children’s Mercy Kansas City and Department of Pediatrics, University
of Missouri-Kansas City School of Medicine, Kansas City, Missouri; bChildren’s Hospital Association, Lenexa,
Kansas; cDivision of General Pediatrics, Monroe Carell Jr. Children's Hospital at Vanderbilt and Department of
Pediatrics, Vanderbilt University Medical Center, Vanderbilt University, Nashville, Tennessee; and dComplex Care
Service, Division of General Pediatrics, Department of Medicine, Boston Children's Hospital, Harvard Medical School, Boston, Massachusetts
Dr Markham conceptualized and designed the study, analyzed and interpreted the data, and drafted the initial manuscript; Dr Hall was involved in the study design, supervised the data analysis and interpretation, and reviewed and revised the manuscript; Drs Gay and Bettenhausen were involved in the study design, participated in the interpretation of data, and reviewed and revised the manuscript; Dr Berry supervised the conceptualization and design of the study, participated in the interpretation of data, and reviewed and revised the manuscript; and all authors approved the final manuscript as submitted and agree to be accountable for all aspects of the work.
DOI: https:// doi. org/ 10. 1542/ peds. 2017- 2934 Accepted for publication Jan 19, 2018
Address correspondence to Jessica L. Markham, MD, MSc, Division of Pediatric Hospital Medicine, Department of Pediatrics, Children’s Mercy Kansas City, 2401 Gillham Rd, Kansas City, MO 64108. E-mail: jlmarkham@cmh.edu
WHAT’S KNOWN ON THIS SUBJECT: Despite the low rate of readmissions in children, readmission metrics are being adopted to adjust reimbursement payments. Although attention has been given to readmission rates in children, little is known about the length of stay (LOS) and cost of readmissions. WHAT THIS STUDY ADDS: Readmissions are associated with episode LOS and costs that are approximately double those of index admissions without readmission. Readmission metrics that incorporate episode LOS may provide a better estimate of resource use than readmission rate alone.
Readmissions burden the health care system with increased resource use and health care costs.1, 2 Although
readmission rates are as high as 20% for adult Medicare beneficiaries, 1
among children, readmission rates are low, with ∼6.5% of hospitalized children experiencing an unplanned readmission at an acute care children’s hospital within 30 days.3
Despite the relatively low rate of pediatric readmissions, efforts are underway to adopt readmission metrics that penalize hospitals financially for excess pediatric readmissions, with the aim of advancing hospital quality and controlling costs.4–7 Beyond their
financial impact, readmissions may extend a patient’s total inpatient days for a given episode of care (ie, the number of days a patient spends in the hospital for their combined index admission and readmission). Consequently, readmissions may further increase the psychosocial burdens, financial distress, and overall life disruption for pediatric patients and their families.8–11
Current readmission metrics do not account for the impact of the total number of days spent in the hospital but rather focus on measuring readmissions rates.4–7 Although
the authors of many studies have examined the relationship between index admission length of stay (LOS) and readmission rates, 12 few authors
have examined the LOS and costs of readmissions.13–15 In a study of adults
hospitalized with heart failure, no correlation was found between index LOS or readmission rate and 30-day survival; however, total hospital days during a 30-day episode of care was associated with improved survival.14
Despite a possible benefit for use of this metric in adults, little is known about the total number of hospital days and hospital costs for children with a readmission.
Among children, ∼14% of readmissions occur at a hospital different from that of the index
admission.16 For adult patients, when
readmissions are fragmented across multiple hospitals, the readmission LOS increases, whereas efficient, cost-effective care decreases.15, 17
Likewise, data from health systems reveal that fragmentation of care for adults with chronic conditions results in increased health care costs, worsened outcomes (eg, increases in mortality), and longer intervals between health maintenance visits.17, 18
Although readmissions to different hospitals are associated with longer total LOS among adults, relatively little is known about the effect of fragmentation of care on overall LOS for hospitalized children.15, 16
Therefore, our objectives in this study were (1) to assess, nationally, the LOS and cost for 30-day readmissions in children; (2) to compare the LOS and cost between index admissions, readmissions, and for the episode of care (ie, combined index admission and readmission); and (3) to describe the impact on LOS and cost when a readmission occurs to the same versus a different hospital from that of the index admission.
METHODS
Study Design and Data Source
We performed a retrospective cohort analysis by using the 2013 Agency for Healthcare Research and Quality (AHRQ) Nationwide Readmissions Database (NRD). The NRD is an administrative database that contains information on inpatient stays from January 1, 2013, to December 31, 2013, for all payers and allows for weighted national estimates of readmissions for all US individuals. Data within the NRD are aggregated from 21 geographically diverse states representing 49% of the US population. The NRD contains deidentified patient-level data with unique verified patient identifiers to track individuals within and across hospitals in a state.
Study Population
Children 0 to 18 years of age with an index admission between January 1, 2013, and November 30, 2013, were included. We chose an end date of November 30, 2013, to allow for a full 30-day readmission window for all index admissions. We excluded index admissions for normal newborns on the basis of the Medicare Severity Diagnosis Related Group, transfers to another acute care hospital, mortalities, and patients who left the hospital against medical advice.
Index Admissions
All-condition (ie, admission for any reason) and condition-specific (ie, admission for a specific disease) index admissions were assessed across patient age groups (infant from birth to <1, 1–4, 5–9, 10–14, and 15–18 years). Condition-specific index admissions were identified on the basis of All Patient–Refined Diagnosis Related Groups (3M Health Information System, Wallingford, CT). The most prevalent condition-specific index admissions were assessed for each age group.
Hospital Readmissions
as a readmission to a hospital different from the 1 from which the patient was discharged during the index hospitalization. Readmission prevalence (eg, number) and rates were measured on the discharge level.
Main Outcome Measure
The main outcome measures were LOS and cost for index admissions, for readmissions, and for the episode of care (ie, combined index admission and readmission). Costs in the NRD are estimated from hospital-level charges by using hospital-specific and year-specific cost-to-charge ratios that are available through AHRQ.
Patient and Hospital Characteristics
Patient Demographic Characteristics
Patient demographic characteristics included age, sex, and payer (government, private, or other); the location of the patient’s home residence defined by using the Urban-Rural Classification Scheme for Counties (National Center for Health Statistics, 2013)19 and
categorized into large metropolitan, small metropolitan, micropolitan, or other (not metropolitan or micropolitan); and the discharge disposition (home, post–acute care, home with home nursing services, or unknown).
Patient Clinical Characteristics
Patient clinical characteristics included the type and number of chronic conditions as well as the severity of the illness. Chronic conditions were identified in the NRD by using the AHRQ’s Chronic Condition Indicator (CCI), 20 and the
number of chronic conditions per patient were counted (0, 1, 2–3, or
≥4). CCIs define a chronic condition as any condition expected to last 12 months or longer and meeting 1 or both of the following criteria: (1) the condition places limitations on self-care, independent living, and social interactions, and (2) it results
in the need for ongoing intervention with medical products, services, and special equipment.20 The number
and type of chronic conditions (ie, complex versus not) were distinguished in the NRD by using Feudtner’s et al21 complex chronic
conditions (CCCs). CCCs are defined as medical conditions expected to last for at least 12 months that are severe enough to warrant involvement of multiple subspecialists and/or have a high probability of hospitalization. Severity of illness was defined by using the 3M Health System’s All Patient–Refined Diagnosis Related Group weights.22 In addition to CCIs
and CCCs, we chose to examine severity of illness because of its association with LOS and cost.23
Hospital Characteristics
Hospital characteristics were defined by using NRD data elements and included hospital ownership (government, private not-for-profit, and private-investor owned); hospital location and teaching status (nonmetropolitan nonteaching, small metropolitan teaching, small-metropolitan nonteaching, large metropolitan teaching, or large metropolitan nonteaching), and bed size (small, medium, and large).
Statistical Analysis
Using weights to achieve national estimates of index admissions and readmissions, we summarized continuous variables with medians and interquartile ranges (IQRs) and categorical variables with frequencies and percentages. We used generalized linear mixed effects models with exponential distributions to assess the
relationship between the outcomes and patients’ demographic, clinical, and hospital characteristics. Each model was adjusted for the following fixed effects: age, sex, payer, number of CCCs, patient complexity (ie, presence of a CCC), index hospital, and severity of illness. All statistical analyses were performed by using
SAS version 9.4 (SAS Institute, Inc, Cary, NC), and P values <.001 were considered statistically significant because of the large sample size. The Office of Research Integrity at Children’s Mercy Hospital deemed this study exempt from institutional board review.
RESULTS
Study Population
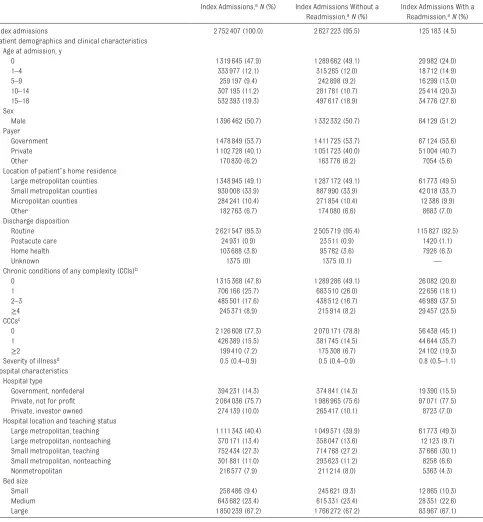
The study included 2752407 index admissions and 125183 thirty-day, all-condition readmissions, for an overall readmission rate of 4.5% (Table 1). Eighty-seven percent (n = 108997) of readmissions were to the same hospital (Supplemental Table 2). The median age at index admission was 1 year (IQR: 0–12 years); 50.7% of index admissions were for male patients; 53.7% were associated with public insurance; and 83.0% were for patients residing in a metropolitan area. Nearly 53% of children overall had a chronic condition (of any complexity); 22.7% of children had at least 1 CCC. Approximately 76% of index admissions were at private, not-for-profit hospitals, with 67.7% of index admissions occurring at teaching hospitals located in metropolitan areas. Index admissions associated with a hospital readmission had a longer unadjusted LOS (median: 3 [IQR: 2–5] vs 2 [IQR: 2–4] days; P < .001) and higher cost (median: $5248 [IQR: $2558–$10996] vs $3426 [IQR: $1637–$7743]; P < .001) than those without a readmission.
Patient and Hospital Characteristics Associated With 30-Day Hospital Readmission
adolescents versus infants (eg, 6.5% for children age 15–18 years versus 2.3% of infants <1 year; P < .001).
Most readmissions were for children with 1 or more chronic conditions (of any complexity) (79.2%) or children
with 1 or more CCCs (54.9%). We observed statistically significant, but modest, differences in readmission
TABLE 1 Characteristics of the Study Population
Index Admissions, aN (%) Index Admissions Without a Readmission, aN (%)
Index Admissions With a Readmission, aN (%)
Index admissions 2752407 (100.0) 2627223 (95.5) 125183 (4.5)
Patient demographics and clinical characteristics Age at admission, y
0 1319645 (47.9) 1289662 (49.1) 29982 (24.0)
1–4 333977 (12.1) 315265 (12.0) 18712 (14.9)
5–9 259197 (9.4) 242898 (9.2) 16299 (13.0)
10–14 307195 (11.2) 281781 (10.7) 25414 (20.3)
15–18 532393 (19.3) 497617 (18.9) 34776 (27.8)
Sex
Male 1396462 (50.7) 1332332 (50.7) 64129 (51.2)
Payer
Government 1478849 (53.7) 1411725 (53.7) 67124 (53.6)
Private 1102728 (40.1) 1051723 (40.0) 51004 (40.7)
Other 170830 (6.2) 163776 (6.2) 7054 (5.6)
Location of patient’s home residence
Large metropolitan counties 1348945 (49.1) 1287172 (49.1) 61773 (49.5)
Small metropolitan counties 930008 (33.9) 887990 (33.9) 42018 (33.7)
Micropolitan counties 284241 (10.4) 271854 (10.4) 12386 (9.9)
Other 182763 (6.7) 174080 (6.6) 8683 (7.0)
Discharge disposition
Routine 2621547 (95.3) 2505719 (95.4) 115827 (92.5)
Postacute care 24931 (0.9) 23511 (0.9) 1420 (1.1)
Home health 103688 (3.8) 95762 (3.6) 7926 (6.3)
Unknown 1375 (0) 1375 (0.1) —
Chronic conditions of any complexity (CCIs)b
0 1315368 (47.8) 1289286 (49.1) 26082 (20.8)
1 706166 (25.7) 683510 (26.0) 22656 (18.1)
2–3 485501 (17.6) 438512 (16.7) 46989 (37.5)
≥4 245371 (8.9) 215914 (8.2) 29457 (23.5)
CCCsc
0 2126608 (77.3) 2070171 (78.8) 56438 (45.1)
1 426389 (15.5) 381745 (14.5) 44644 (35.7)
≥2 199410 (7.2) 175308 (6.7) 24102 (19.3)
Severity of illnessd 0.5 (0.4–0.9) 0.5 (0.4–0.9) 0.8 (0.5–1.1)
Hospital characteristics Hospital type
Government, nonfederal 394231 (14.3) 374841 (14.3) 19390 (15.5)
Private, not for profit 2084036 (75.7) 1986965 (75.6) 97071 (77.5)
Private, investor owned 274139 (10.0) 265417 (10.1) 8723 (7.0)
Hospital location and teaching status
Large metropolitan, teaching 1111343 (40.4) 1049571 (39.9) 61773 (49.3)
Large metropolitan, nonteaching 370171 (13.4) 358047 (13.6) 12123 (9.7)
Small metropolitan, teaching 752434 (27.3) 714768 (27.2) 37666 (30.1)
Small metropolitan, nonteaching 301881 (11.0) 293623 (11.2) 8258 (6.6)
Nonmetropolitan 216577 (7.9) 211214 (8.0) 5363 (4.3)
Bed size
Small 258486 (9.4) 245621 (9.3) 12865 (10.3)
Medium 643682 (23.4) 615331 (23.4) 28351 (22.6)
Large 1850239 (67.2) 1766272 (67.2) 83967 (67.1)
P < .001 is for all comparisons of index admissions with and without a readmission. —, not applicable.
a Individual categories of data may not add to the total number of index admissions because of the presence of missing or incomplete data.
b Chronic conditions were identified by using the AHRQ’s CCI. CCIs define a chronic condition as any condition expected to last 12 mo or longer and meeting 1 or both of the following criteria: (1) the condition places limitations on self-care, independent living, and social interactions; and/or (2) it results in the need for ongoing intervention with medical products, services, and special equipment.
c CCCs were identified by using the classification scheme described by Feudtner et al21 and are defined as medical conditions expected to last for at least 12 mo that are severe enough to warrant the involvement of multiple subspecialists and/or have a high probability of hospitalization.
rates by subcategories of sex, payer, location of patient’s home residence, discharge disposition, and severity of illness. Patient characteristics that were significantly associated (all
P < .001) with increased readmission rates to a different hospital included age (ie, infants <1 year old),
government insurance, absence of CCIs or CCCs, and a lower severity of illness (Supplemental Table 2). Nearly 80% of index admissions with readmissions occurred at private, not-for-profit hospitals and metropolitan teaching hospitals (Table 1). Hospital characteristics that were associated with increased rates of return to a different hospital included the index admission occurring at a private, investor-owned hospital, a nonmetropolitan and/or nonteaching hospital, or a hospital with a small bed size (Supplemental Table 2).
Adjusted Hospital Resource Use of All-Condition Index Admissions With Versus Without Readmissions
In adjusted analyses, index admissions with versus without hospital readmission had similar LOS but lower mean costs ($5170 [95% confidence interval (CI): $4578–$5837] vs $5340 [95% CI: $4729–$6029]; P < .001; Fig 1). The adjusted mean LOS and cost for a readmission were 3.6 (95% CI: 3.5–
3.6) days and $6328 (95% CI: $6184–
$6475), respectively. The adjusted mean LOS and cost for the combined episode of care (including the index admission and readmission) were 5.8 (95% CI: 5.7–5.9) days and $12250 (95% CI: $12096–$12407). When a readmission occurred, the adjusted mean LOS and cost for the combined episode of care were, respectively, 2.0 times longer and 2.3 times higher than the LOS and cost of index admissions without a readmission. When children were readmitted to a different versus the same hospital, the adjusted mean LOS and costs for the index admission
were similar. However, they were significantly greater for a different hospital versus the same hospital during the readmission (LOS 4.1 [95% CI: 4.0–4.3] vs 3.4 [95% CI: 3.3–3.4] days; P < .001; and cost ($8172 [95% CI: $7950–$8401] vs $5622 [95% CI: $5490–$5758];
P < .001). The adjusted mean LOS for the combined episode of care were the same, but costs were 36.1% higher (cost: $15876 [95% CI: $14048–$17942] vs $11661 [95% CI: $10318–$13178]; P < .001) when a readmission occurred to a different versus the same hospital.
Adjusted Hospital Resource Use of Condition-Specific Index Admissions With Versus Without Readmissions
The degree to which readmissions impacted episode LOS and cost varied significantly (P < .001) on the basis of the condition (Fig 2; Supplemental Tables 3 and 4).
The largest differences in episode LOS for index admissions with versus without a readmission were observed for fever (rate ratio: 2.7 [95% CI: 2.3–3.2] for infants <1 year old), nonbacterial gastroenteritis (3.0 [95% CI: 2.7–3.3] for 1- to 9-year-old children), seizures (2.8 [95% CI: 2.7–
3.0] for 1- to 9-year-old children), and appendectomy (2.9 [95% CI: 2.7–
3.2] for 10- to 18-year-old children). Similar findings were observed for hospital cost.
DISCUSSION
Within this large, national cohort of pediatric hospitalizations, we found that readmissions nearly doubled the hospital cost as well as the number of days that children spent in the hospital for a given episode of care. Readmissions to a different versus the same hospital as the index admission were FIGURE 1
associated with higher episode costs but similar episode LOS. The total episode LOS and cost also varied substantially according to the reason for admission. For instance, among infants admitted for fever, those who experienced a readmission had a particularly long episode LOS. These findings may help contextualize pediatric hospital resource use associated with readmissions, beyond reporting the readmission rate alone.
Our finding that readmissions double the amount of time that children spend in the hospital across all conditions is congruent with those of previous studies of readmissions after condition-specific index admissions. For example, readmissions after index admissions for congestive heart failure and appendectomy doubled
the total number of days that patients spent in the hospital.13, 14
With a median of nearly 1 week spent in the hospital, pediatric index admissions and readmissions combined could potentially lead to significant life interruptions and may compound the stressors that patients and families experience with unplanned hospitalizations. Because readmission LOS was, on average, comparable with the index admission LOS, our findings may help providers to estimate the readmission LOS at the time of a return, thus permitting patients and families to make plans (eg, regarding work, school, and child care) to address their life situation.
The readmission duration in the current study may also help interpret the population-based impact of readmission rates on hospital resource use for children. We found
that LOS was similar for pediatric index admissions and readmissions. With a 30-day readmission rate of 4.5% and an average index LOS of 3.0 days, the overall impact of combining index admission and readmission bed days (ie, episode LOS) would result in a population-based increase in LOS of 0.14 bed days (ie, a population-based average episode LOS of 3.14 days). The magnitude of this increase in LOS might help inform perceptions of how much or how little pediatric readmissions influence total hospital days at the population level.
Our findings of increased health care costs among children readmitted to a different hospital are similar to those of previous studies of same and different hospital readmissions among adults.17, 24 Within our study,
∼12.9% of readmissions occurred at a different hospital. In an effort to reduce fragmentation of hospital care, if readmissions to a different hospital could be discouraged and reduced by 50% (eg, by increasing the number of children who present to the same hospital), this would represent a potential cost savings of nearly $28.4 million annually. Although a proportion of readmissions to a different hospital may be unavoidable, with these findings, we underscore how efforts aimed at incentivizing return to the discharging hospital may improve care coordination and lead to significant cost reductions in health care spending for readmissions over time. Notably, the current practice of penalizing individual hospitals for excess readmissions likely does the opposite.
Hospital location and teaching status were associated with differences in readmission rates in our study. These differences may in part be explained by the regionalization of pediatric subspecialist care (including intensive care services) predominantly within metropolitan areas as well as by a higher
complexity and/or severity of illness FIGURE 2
among those receiving care at metropolitan teaching hospitals.25
Although difficult to achieve, improving access to pediatric subspecialist care through changes in the recruitment, training, and distribution of pediatric subspecialist providers across health systems may further incentivize patients to return to the discharging hospital.
We found that readmission duration for certain index admissions (including fever in infants, seizures and nonbacterial gastroenteritis in 1- to 9-year-old children, and appendectomy for acute appendicitis in 10- to 18-year-old children) was much greater than the duration of the index admission itself. Although the authors of previous studies have not observed a statistically significant association between shorter index admission LOS and risk of readmission, 12 perhaps further
investigation of these acute illness–
related index admissions may help determine if premature discharge related to misdiagnosis, inaccurate assessment of illness severity, or
other modifiable factors contributed to the need for the readmission. These findings should be interpreted in the context of several limitations. The findings are national estimates derived from state-level data within the NRD. The NRD cannot be used to measure readmissions to hospitals in a different state, which may lead to an underestimation of readmissions. The NRD is also not equipped to enable distinguishing patient deaths occurring after discharge, which would inherently eliminate the risk for readmission. Finally, the NRD does not contain information on patients’ physiologic and functional status, race and/or ethnicity, family and/or social attributes, or postdischarge follow-up health services, which are known to influence the need for readmission.
CONCLUSIONS
Hospital readmissions in children nearly doubled the index
hospitalization cost as well as the number of days that children spent
in the hospital. Readmissions to a different versus the same hospital were associated with higher hospital costs. The total episode LOS and cost for the index hospitalization and readmission varied substantially by the reason for admission. These findings may help contextualize pediatric hospital resource use associated with readmissions beyond reporting the readmission rate alone.
ACKNOWLEDGMENT
We thank the Medical Writing Center at Children’s Mercy Kansas City.
ABBREVIATIONS
AHRQ: Agency for Healthcare Research and Quality CCC: complex chronic condition CCI: Chronic Condition Indicator CI: confidence interval
IQR: interquartile range LOS: length of stay
MDC: major diagnostic category NRD: Nationwide Readmissions
Database
PEDIATRICS (ISSN Numbers: Print, 0031-4005; Online, 1098-4275). Copyright © 2018 by the American Academy of Pediatrics
FINANCIAL DISCLOSURE: The authors have indicated they have no financial relationships relevant to this article to disclose. FUNDING: No external funding.
POTENTIAL CONFLICT OF INTEREST: The authors have indicated they have no potential conflicts of interest to disclose. COMPANION PAPER: A companion to this article can be found online at www. pediatrics. org/ cgi/ doi/ 10. 1542/ peds. 2018- 0243.
REFERENCES
1. Jencks SF, Williams MV, Coleman EA. Rehospitalizations among patients in the Medicare fee-for-service program.
N Engl J Med. 2009;360(14):1418–1428 2. Anderson GF, Steinberg EP.
Hospital readmissions in the Medicare population. N Engl J Med. 1984;311(21):1349–1353
3. Berry JG, Toomey SL, Zaslavsky AM, et al. Pediatric readmission prevalence and variability across hospitals [published correction appears in
JAMA. 2013;309(10):986]. JAMA. 2013;309(4):372–380
4. Illinois Department of Healthcare and Family Services. Hospital inpatient potentially preventable readmissions information and reports. Available at: https:// www. illinois. gov/ hfs/ MedicalProviders/ hospitals/ PPRReports/ Pages/ default. aspx. Accessed November 6, 2016
5. Texas Health and Human Services. Potentially preventable readmissions in Texas Medicaid and CHIP programs - fiscal year 2013. Available at: https:// hhs. texas. gov/ reports/ 2016/ 08/ potentially- preventable- readmissions- texas-
medicaid- and- chip- programs- fiscal- year- 2013. Accessed November 6, 2016 6. New York State Department of Health.
Statistical reports and briefs – Division of Information and Statistics. Available at: www. health. ny. gov/ statistics/ sparcs/ sb/ . Accessed November 6, 2016
7. Washington State Hospital Association. HCA implements potentially
ppr- adjustments/ . Accessed November 8, 2016
8. Commodari E. Children staying in hospital: a research on psychological stress of caregivers. Ital J Pediatr. 2010;36:40
9. Coyne I. Children’s experiences of hospitalization. J Child Health Care. 2006;10(4):326–336
10. Schuster MA, Chung PJ, Vestal KD. Children with health issues. Future Child. 2011;21(2):91–116
11. Leader S, Jacobson P, Marcin J, Vardis R, Sorrentino M, Murray D. A method for identifying the financial burden of hospitalized infants on families. Value Health. 2002;5(1):55–59
12. Morse RB, Hall M, Fieldston ES, et al. Children’s hospitals with shorter lengths of stay do not have higher readmission rates. J Pediatr. 2013;163(4):1034–1038.e1
13. Rice-Townsend S, Gawande A, Lipsitz S, Rangel SJ. Relationship between unplanned readmission and total treatment-related hospital days following management of complicated appendicitis at 31 children’s hospitals.
J Pediatr Surg. 2013;48(6):1389–1394 14. Kociol RD, Liang L, Hernandez AF, et al.
Are we targeting the right metric for
heart failure? Comparison of hospital 30-day readmission rates and total episode of care inpatient days. Am Heart J. 2013;165(6):987–994.e1 15. Flaks-Manov N, Shadmi E, Hoshen
M, Balicer RD. Health information exchange systems and length of stay in readmissions to a different hospital.
J Hosp Med. 2016;11(6):401–406 16. Khan A, Nakamura MM, Zaslavsky
AM, et al. Same-hospital readmission rates as a measure of pediatric quality of care. JAMA Pediatr. 2015;169(10):905–912
17. Kim H, Hung WW, Paik MC, et al. Predictors and outcomes of unplanned readmission to a different hospital. Int J Qual Health Care. 2015;27(6):513–519 18. Staples JA, Thiruchelvam D,
Redelmeier DA. Site of hospital readmission and mortality: a population-based retrospective cohort study. CMAJ Open. 2014;2(2):E77–E85 19. Centers for Disease Control and
Prevention. Urban rural classification scheme for counties. Available at: www. cdc. gov/ nchs/ data_ access/ urban_ rural. htm. Accessed December 9, 2016
20. Healthcare Cost and Utilization Project. Chronic Condition Indicator (CCI) for
ICD-9-CM. Available at: https:// www. hcup- us. ahrq. gov/ toolssoftware/ chronic/ chronic. jsp. Accessed November 6, 2016
21. Feudtner C, Feinstein JA, Zhong W, Hall M, Dai D. Pediatric complex chronic conditions classification system version 2: updated for ICD-10 and complex medical technology dependence and transplantation. BMC Pediatr. 2014;14:199
22. New York State Department of Health. APR-DRG weights and ALOS for acute services. Available at: https:// www. health. ny. gov/ facilities/ hospital/ reimbursement/ apr- drg/ weights/ . Accessed January 6, 2018
23. Berry JG, Hall M, Hall DE, et al. Inpatient growth and resource use in 28 children’s hospitals: a longitudinal, multi-institutional study. JAMA Pediatr. 2013;167(2):170–177
24. Kind AJ, Bartels C, Mell MW, Mullahy J, Smith M. For-profit hospital status and rehospitalizations at different hospitals: an analysis of Medicare data. Ann Intern Med. 2010;153(11):718–727
DOI: 10.1542/peds.2017-2934 originally published online March 9, 2018;
2018;141;
Pediatrics
Berry
Jessica L. Markham, Matt Hall, James C. Gay, Jessica L. Bettenhausen and Jay G.
Length of Stay and Cost of Pediatric Readmissions
Services
Updated Information &
http://pediatrics.aappublications.org/content/141/4/e20172934
including high resolution figures, can be found at:
References
http://pediatrics.aappublications.org/content/141/4/e20172934#BIBL
This article cites 18 articles, 1 of which you can access for free at:
Subspecialty Collections
http://www.aappublications.org/cgi/collection/public_health_sub
Public Health
http://www.aappublications.org/cgi/collection/legislation_sub
Legislation
http://www.aappublications.org/cgi/collection/advocacy_sub
Advocacy
following collection(s):
This article, along with others on similar topics, appears in the
Permissions & Licensing
http://www.aappublications.org/site/misc/Permissions.xhtml
in its entirety can be found online at:
Information about reproducing this article in parts (figures, tables) or
Reprints
http://www.aappublications.org/site/misc/reprints.xhtml
DOI: 10.1542/peds.2017-2934 originally published online March 9, 2018;
2018;141;
Pediatrics
Berry
Jessica L. Markham, Matt Hall, James C. Gay, Jessica L. Bettenhausen and Jay G.
Length of Stay and Cost of Pediatric Readmissions
http://pediatrics.aappublications.org/content/141/4/e20172934
located on the World Wide Web at:
The online version of this article, along with updated information and services, is
http://pediatrics.aappublications.org/content/suppl/2018/03/07/peds.2017-2934.DCSupplemental
Data Supplement at:
by the American Academy of Pediatrics. All rights reserved. Print ISSN: 1073-0397.