Mental and Physical Health of
Children in Foster Care
Kristin Turney, PhD, a Christopher Wildeman, PhDb
abstract
BACKGROUND AND OBJECTIVES: Each year, nearly 1% of US children spend time in foster care, with 6% of US children placed in foster care at least once between their birth and 18th birthday. Although a large literature considers the consequences of foster care placement for children’s wellbeing, no study has used a nationally representative sample of US children to compare the mental and physical health of children placed in foster care to the health of children not placed in foster care.
METHODS: We used data from the 2011–2012 National Survey of Children’s Health, a nationally representative sample of noninstitutionalized children in the United States, and logistic regression models to compare parent-reported mental and physical health outcomes of children placed in foster care to outcomes of children not placed in foster care, children adopted from foster care, children across specific family types (eg, single-mother households), and children in economically disadvantaged families.
RESULTS: We find that children in foster care are in poor mental and physical health relative to children in the general population, children across specific family types, and children in economically disadvantaged families. Some differences are explained by adjusting for children’s demographic characteristics, and nearly all differences are explained by also adjusting for the current home environment. Additionally, children adopted from foster care, compared with children in foster care, have significantly higher odds of having some health problems.
CONCLUSIONS: Children in foster care are a vulnerable population in poor health, partially as a result of their early life circumstances.
aDepartment of Sociology, University of California, Irvine, Irvine, California; and bDepartment of Policy Analysis
and Management, Cornell University, Ithaca, New York
Dr Turney conceptualized and designed the study, secured access to the restricted-use data, conducted all analyses, and drafted and revised the manuscript; Dr Wildeman conceptualized and designed the study and drafted and revised the manuscript; and both authors approved the fi nal manuscript as submitted.
DOI: 10.1542/peds.2016-1118
Accepted for publication Aug 16, 2016
Address correspondence to Kristin Turney, PhD, Department of Sociology, University of California, Irvine, 3151 Social Science Plaza, Irvine, CA 92697. E-mail: kristin.turney@uci.edu
PEDIATRICS (ISSN Numbers: Print, 0031-4005; Online, 1098-4275). Copyright © 2016 by the American Academy of Pediatrics
FINANCIAL DISCLOSURE: The authors have indicated they have no fi nancial relationships relevant to this article to disclose.
FUNDING: No external funding.
POTENTIAL CONFLICT OF INTEREST: The authors have indicated they have no potential confl icts of interest to disclose.
To cite: Turney K and Wildeman C. Mental and Physical Health of Children in Foster Care. Pediatrics. 2016;138(5): e20161118
WHAT’S KNOWN ON THIS SUBJECT: Data limitations to date have made it impossible to compare the mental and physical health of children placed in foster care to the mental and physical health of the general population of US children.
Each year, nearly 1% of US children spend time in foster care. 1 Yet only
considering children placed in care annually dramatically understates the number of children ever experiencing this event. Recent estimates show that between 5% and 6% of US children will ever be placed in foster care, with roughly 10% of African-American children and 15% of Native American children ever experiencing this event. 2
Children placed in foster care endure a number of disadvantages, both because of the maltreatment they have endured and other risk factors associated with their placement, including poverty, parental drug and alcohol abuse, neighborhood disadvantage, and epigenetics. 3 –15
Therefore, it is perhaps unsurprising that children in foster care
experience more depression/anxiety, attention-deficit/hyperactivity disorder (ADHD), and behavioral/ conduct problems than children living with 2 biological parents and children living with never-married biological single mothers. 16 Children
ever placed in foster care, compared with their counterparts, also
disproportionately struggle in school, have trouble finding employment, and abuse drugs and alcohol in adolescence and early adulthood.17 –23
Data limitations to date have made it impossible to compare the mental and physical health of children placed in foster care to the general population of US children. Data limitations have also made it impossible to compare the mental and physical health of children placed in foster care to children across most specific family types or to children in economically disadvantaged families. 16 Therefore, in this article,
we use data from the 2011–2012 National Survey of Children’s Health (NSCH), a nationally representative sample of noninstitutionalized children in the United States, to provide a descriptive portrait of the health outcomes of children
placed in foster care relative to children not placed in foster care, children adopted from foster care, children across specific family types (eg, single-mother households), and children in economically disadvantaged families.
METHODS Participants
We estimated the association between foster care placement and children’s health with the cross-sectional 2011–2012 NSCH, a nationally representative survey of 95 677 noninstitutionalized children ages 0 to 17 years in the United States. 24 During the survey,
interviewers first selected a focal child and then interviewed the household adult with the most information about the focal child (the child’s mother or father in 93% of observations, hereafter referred to as the parent respondent). The survey completion rate was 41% and 54% for the cell phone and landline samples, respectively, and sampling weights adjust for nonresponse. The large sample size of the NSCH allows for an examination of children placed in foster care, a typically difficult-to-reach population. The analytic sample excludes the 2443 observations missing data on household living arrangements.
Measures
Outcome Variables
The outcome variables include 13 binary indicators of children’s mental and physical health, all reported by the parent respondent. These include 2 general indicators of health: (1) fair or poor health (compared with excellent, very good, or good health), and (2) activity limitations (1 = child is limited or prevented in ability to do things because of medical, behavioral, or other health condition). These also include 11 specific indicators of health conditions, measured affirmatively if the parent respondent
reports the child has been diagnosed with the condition by a doctor or other health care provider and if the parent respondent reports the child has the condition at the time of the interview. These indicators include the following: (1) learning disability; (2) attention deficit disorder (ADD) or ADHD; (3) depression; (4) anxiety; (5) behavioral or conduct problems; (6) developmental delay; (7) asthma; (8) obesity (95th percentile or higher, only ascertained for children ages 10–17 years); (9) speech or other language problems (including stuttering or stammering); (10) hearing problems; and (11) vision problems that cannot be corrected with standard glasses or contact lenses.
Explanatory Variables
from foster care) supersede the measures of household living arrangements. For example, a child placed in foster care with a single mother is coded as being placed in foster care.
Covariates
The multivariate analyses adjusted for variables commonly used when estimating children’s health. 16, 25–27
Child characteristics include the following: age (a continuous measure ranging from 0–17 years), sex (1 = girl), birth weight (1 = born <2500 g), race/ethnicity (non-Hispanic white, non-(non-Hispanic black, Hispanic, non-Hispanic other race), and nativity status (1 = first- or second-generation immigrant). Household characteristics include the following: mother’s age (age 20–29 years, age 30–39 years, age 40–49 years, ≥50 years), parent’s educational attainment (less than high school, high school diploma, postsecondary education), parent’s unemployment status (1 = unemployed), economic hardship (1 = family often has difficulty getting by on its income), welfare receipt (1 = household member receives welfare), Supplemental Nutrition Program for Women, Infants, and Children (WIC) receipt (1 = household member receives WIC), poverty (1 = household income below the poverty line), home ownership (1 = parent owns home), child’s health insurance (private insurance, public insurance, no insurance), child’s health care access (1 = saw doctor in past year), parent’s health (1 = fair or poor health), child’s exposure to smoking (1 = household member smokes inside home), and neighborhood safety (1 = not always safe for child). Importantly, for children placed in foster care, these household characteristics represent the characteristics of the foster family and not the family of origin.
Statistical Analyses
Table 1 presents descriptive statistics of all variables. Table 2 presents frequencies of outcome variables by foster care placement. In Table 3, logistic regression models estimate children’s health as a function of foster care placement (temporarily excluding children adopted from foster care). Model 1 estimates the unadjusted association, Model 2 adjusts for child characteristics, and Model 3 adjusts for both child and household characteristics. Because children placed in foster care experienced difficulties in their families of origin, 3, 22 which are not
captured due to data limitations, Model 3 provides a conservative test of the association between foster care placement and children’s health. In Table 4, logistic regression models estimate children’s health as a function of foster care placement, comparing children placed in foster care to children adopted from foster care and children across a variety of household living arrangements (eg, single-mother households). Providing these family-level
comparisons is essential for showing pediatricians how the health and wellbeing of children in foster care compares to children in other sorts of family arrangements. Finally, in Table 5, logistic regression models estimate children’s health, comparing children placed in foster care to children in the following groups: (1) children in households with income below the poverty line; (2) children in households receiving welfare; (3) children with public health insurance; (4) children with no health insurance; (5) children of parents who have less than a high school diploma; (6) children with unemployed parents; (7) children living in not always safe neighborhoods; and (8) children with ≥3 of these indicators of socioeconomic status (SES) disadvantage. In Tables 4 and 5, we present models that adjust for both
child and household characteristics (the equivalent of Model 3 in Table 3).
All analyses were conducted in Stata version 14.1 (Stata Corp, College Station, TX). 28 The median
control variable was missing 2% of observations, and we imputed missing values with multiple imputation. All analyses account for the complex sampling design (including sampling weights, stratum, and primary sampling units). This study was deemed exempt from human subjects research by the institutional review boards at the University of California, Irvine and Cornell University.
RESULTS
Table 1 presents weighted
descriptive statistics of all dependent, independent, and control variables included in the analyses. In the full sample, 3.2% of parents reported their child was in fair or poor health, and 4.9% of parents reported their child had an activity limitation. In terms of specific health conditions, obesity was most commonly reported (15.8% of children), followed by asthma (8.8%), learning disability (7.9%), ADD/ADHD (7.7%), and speech problems (4.8%). A total of 0.5% of children were placed in foster care (and an additional 0.8% were legally adopted from foster care).
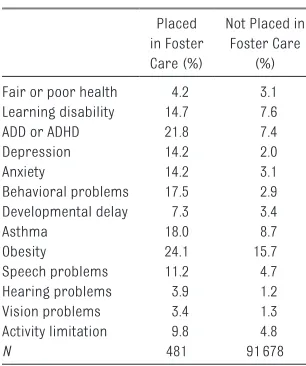
4.7%). They were 3 times as likely to have ADD/ADHD (21.8% vs 7.4%), hearing problems (3.9% vs 1.2%), and vision problems (3.4% vs 1.3%); 5 times as likely to have anxiety (14.2% vs 3.1%); 6 times as likely to have behavioral problems (17.5% vs 2.9%); and 7 times as likely to have depression (14.2% vs 2.0%).
Table 3 presents results from logistic regression models. Model 1, the unadjusted model, shows that children placed in foster care, compared with their counterparts not placed in foster care, have higher odds of experiencing 9 of the 13 outcome variables. These statistically significant associations remain in Model 2, which adjusts for child characteristics. Finally, in Model 3, which adjusts for household characteristics, children placed in foster care have a greater likelihood of ADD/ADHD (odds ratio [OR] = 3.00; 95% confidence interval [CI] = 1.91–4.71), depression (OR = 4.92; 95% CI = 2.63–9.18), anxiety (OR = 3.94; 95% CI = 2.36–6.60), behavioral or conduct problems (OR = 4.22; 95% CI = 2.59–6.88), and speech or other language problems (OR = 1.91; 95% CI = 1.01–3.61) than their counterparts. Therefore, in these conservative models, the differences between children placed and not placed in foster care are most apparent for mental health outcomes.
Table 4 presents results from the logistic regression models
that compare children placed in foster care to other children across a variety of household living arrangements, adjusting for an array of child and household characteristics (see Supplemental Table 6 for frequencies). These analyses show that children placed in foster care, compared with children in nearly all other types of household living arrangements, have a greater likelihood of having mental health problems, including ADD/ADHD, depression, anxiety, and behavioral or conduct problems. For example, compared with children placed in foster care, children have a lower likelihood of ADHD when they are in households with married biological parents (OR = 0.21; 95% CI = 0.13– 0.33), cohabiting biological parents (OR = 0.21; 95% CI = 0.12–0.38), married step-parents (OR = 0.39; 95% CI = 0.23–0.67), cohabiting step-parents (OR = 0.40; 95% CI = 0.23–0.71), single mothers (OR = 0.29; 95% CI = 0.18–0.48), single fathers (OR = 0.20; 95% CI = 0.11– 0.35), grandparents and parents (OR = 0.29; 95% CI = 0.17–0.48), relatives and parents (OR = 0.26; 95% CI = 0.15–0.45), nonrelatives (OR = 0.28; 95% CI = 0.15–0.51), and other complex families (OR = 0.39; 95% CI = 0.21–0.72). There are few differences in fair or poor health, learning disability, developmental delay, asthma, obesity, speech problems, hearing problems, vision problems, and activity limitations between children placed in foster care and children in most other household living arrangements.
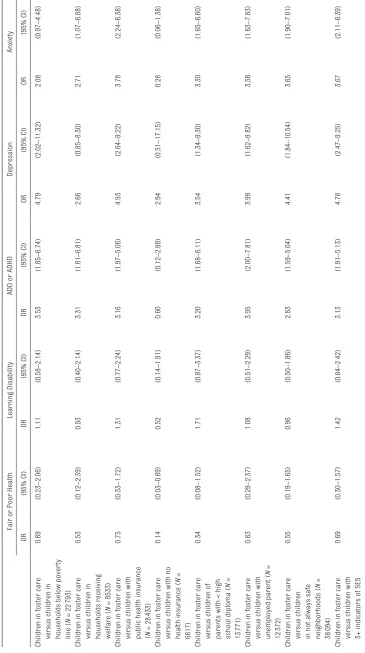
Table 5 presents results from the logistic regression models that compare children placed in foster care to children who experience 8 types of socioeconomic disadvantages, again adjusting for an array of child and household characteristics (see Supplemental Table 7 for frequencies). These analyses show that children placed in foster care, compared with children
TABLE 1 Weighted Means or Frequencies of All Variables Included in Analyses, for All Children, Children Placed in Foster Care, and Children Not Placed in Foster Care: 2011–2012 NSCH
% or Mean Outcome variables
Fair or poor health (ages 0–17 y) 3.2 Learning disability (ages 3–17 y) 7.9 ADD or ADHD (ages 2–17 y) 7.7 Depression (ages 2–17 y) 2.1
Anxiety (ages 2–17 y) 3.3
Behavioral problems (ages 2–17 y) 3.1 Developmental delay (ages 2–17 y) 3.5
Asthma (ages 0–17 y) 8.8
Obesity (ages 10–17 y) 15.8 Speech problems (ages 2–17 y) 4.8 Hearing problems (ages 0–17 y) 1.2 Vision problems (ages 0–17 y) 1.3 Activity limitation (ages 0–17 y) 4.9 Independent variables
Foster care placement 0.5
Adopted from foster care 0.8 Married biological parents 52.7 Cohabiting biological parents 5.2
Married step-parents 5.6
Cohabiting step-parents 2.2
Single mother 13.0
Single father 2.5
Only grandparents 1.9
Grandparents and parents 8.9
Only relatives 0.5
Relatives and parents 3.6
Nonrelatives 1.4
Other complex family type 1.3 Control variables
Child age (y; range: 0–17) 8.6
Child sex (girl) 48.8
Child born low birth weight 9.5 Child race/ethnicity
Non–Hispanic white 45.6
Non–Hispanic black 16.0
Hispanic 25.9
Non–Hispanic other 12.5
Child fi rst– or second–generation immigrant
26.2
Mother age, y
20–29 18.9
30–39 41.8
40–49 32.0
50–59 7.3
Parent educational attainment
Less than high school 11.3
High school diploma 37.6
Postsecondary education 51.1
Parent unemployed 15.9
Family often has diffi culty getting by on its in com
9.1
Household member receives welfare 10.3 Household member receives WIC 16.8 Household income below poverty line 29.5 Child health insurance
Private insurance 54.8
% or Mean
Public insurance 38.2
No insurance 7.0
Child saw doctor in past year 88.1
Parent owns home 61.7
Parent fair or poor health 16.1 Household member smokes inside
home
6.0
Neighborhood not always safe for child
43.6
N 93 234
who experience socioeconomic disadvantages, have a greater likelihood of having mental health problems. For example, compared with children who experience ≥3 indicators of socioeconomic disadvantage, children placed in foster care have a greater likelihood of ADD/ADHD (OR = 3.13; 95% CI = 1.91–5.13), depression (OR = 4.78; 95% CI = 2.47–9.25), anxiety
(OR = 3.67; 95% CI = 2.11–6.39), and behavioral or conduct problems (OR = 4.14; 95% CI = 2.44–7.03).
DISCUSSION
Foster care placement is a common event for US children, 2 yet no
previous research had considered how the mental and physical health of children in foster care compared with children in the general population not in foster care. 22 In
a similar vein, research that had compared children in foster care to other children in the population had focused initially only on a small number of types of households and did not consider comparisons with children in economically disadvantaged families. 16 The goal
of this article was to document the differences in mental and physical health outcomes of children placed in foster care to outcomes of children not placed in foster care, children adopted from foster care, children across specific family types, and children in economically disadvantaged families by using the 2011–2012 NSCH.
The results support 3 key
conclusions. First, children placed in foster care had more mental and physical health conditions than children not placed in foster care. For instance, these children were about twice as likely to have a learning disability and 3 times as likely to have ADD or ADHD. They were also roughly twice as likely to have asthma and speech problems and 3 times as likely to have hearing problems and vision problems. Differences were even more substantial for other mental health conditions; they were 5 times as likely to have anxiety, 6 times as likely to have behavioral problems, and 7 times as likely to have depression.
Second, although some of the mental and physical health differences of children in foster care compared with other children were explained by characteristics of these children and their households, many of the differences in mental health persisted after adjusting for these child and household characteristics, suggesting possible effects of foster care placement on mental health. However, unlike much other research in this area, our primary goal was
TABLE 2 Frequencies of Children's Health, for Children Placed in Foster Care and Children Not Placed in Foster Care: 2011–2012 NSCH
Placed in Foster Care (%)
Not Placed in Foster Care
(%) Fair or poor health 4.2 3.1 Learning disability 14.7 7.6
ADD or ADHD 21.8 7.4
Depression 14.2 2.0
Anxiety 14.2 3.1
Behavioral problems 17.5 2.9 Developmental delay 7.3 3.4
Asthma 18.0 8.7
Obesity 24.1 15.7
Speech problems 11.2 4.7
Hearing problems 3.9 1.2
Vision problems 3.4 1.3
Activity limitation 9.8 4.8
N 481 91 678
Ns vary across outcome variables because not all outcome variables were ascertained for children at all ages. Children adopted from foster care (N = 1075) excluded from this table.
TABLE 3 Logistic Regression Models Estimating Children's Health as a Function of Foster Care Placement: 2011–2012 NSCH
Model 1 (Unadjusted) Model 2 (+ Basic Controls) Model 3 (+ Extended Controls)
OR (95% CI) OR (95% CI) OR (95% CI)
Fair or poor health 1.35 (0.65–2.80) 0.97 (0.45–2.11) 0.75 (0.34–1.68)
Learning disability 2.09 (1.29–3.38) 1.90 (1.13–3.21) 1.18 (0.71–1.95)
ADD or ADHD 3.51 (2.22–5.56) 4.29 (2.68–6.88) 3.00 (1.91–4.71)
Depression 8.15 (4.89–13.60) 8.88 (4.84–16.27) 4.92 (2.63–9.18)
Anxiety 5.10 (3.16–8.25) 6.20 (3.73–10.30) 3.94 (2.36–6.60)
Behavioral problems 7.17 (4.37–11.77) 7.53 (4.45–12.74) 4.22 (2.59–6.88)
Developmental delay 2.25 (1.36–3.72) 2.03 (1.21–3.41) 1.21 (0.71–2.05)
Asthma 2.32 (1.39–3.87) 2.10 (1.19–3.70) 1.55 (0.90–2.67)
Obesity 1.70 (0.95–3.06) 1.53 (0.85–2.78) 1.12 (0.61–2.08)
Speech problems 2.56 (1.40–4.68) 2.68 (1.41–5.08) 1.91 (1.01–3.61)
Hearing problems 3.27 (0.86–12.38) 2.87 (0.75–11.00) 2.00 (0.47–8.53)
Vision problems 2.74 (0.96–7.85) 2.10 (0.72–6.11) 1.33 (0.40–4.45)
Activity limitation 2.15 (1.34–3.44) 1.85 (1.12–3.06) 1.25 (0.76–2.08)
TABLE 4
Logistic Regression Models Estimating Children's Health as a Function of Family Type: 2011–2012 NSCH
Fair or Poor Health
Learning Disability
ADD or ADHD
Depression Anxiety OR (95% CI) OR (95% CI) OR (95% CI) OR (95% CI) OR (95% CI)
Adopted from foster care
2.63 (0.96–7.22) 2.83 (1.57–5.11) 1.77 (1.03–3.02) 0.72 (0.35–1.48) 1.02 (0.57–1.84)
Married biological parents
1.60 (0.67–3.82) 0.86 (0.50–1.46) a 0.21 (0.13–0.33) a 0.09 (0.04–0.17) a 0.20 (0.11–0.34) a
Cohabiting biological parents
1.56 (0.62–3.97) 0.86 (0.46–1.59) a 0.21 (0.12–0.38) a 0.25 (0.11–0.61) a 0.18 (0.09–0.36) a Married step-parents 1.45 (0.52–4.03) 0.82 (0.46–1.47) a 0.39 (0.23–0.) a 0.32 (0.15–0.71) a 0.30 (0.16–0.55) a Cohabiting step-parents 2.04 (0.78–5.35) 1.14 (0.59–2.22) a 0.40 (0.23–0.71) a 0.38 (0.17–0.86) 0.45 (0.22–0.92) a Single mother 1.95 (0.80–4.77) 0.97 (0.57–1.66) a 0.29 (0.18–0.48) a 0.28 (0.14–0.56) a 0.32 (0.18–0.57) a Single father 1.57 (0.59–4.22) 0.57 (0.29–1.11) a 0.20 (0.11–0.35) a 0.12 (0.04–0.42) a 0.08 (0.04–0.17) a Only grandparents 0.78 (0.33–1.85) a 1.10 (0.62–1.97) a 0.77 (0.45–1.30) a 0.32 (0.15–0.68) a 0.38 (0.20–0.71) a
Grandparents and parents
1.89 (0.78–4.57) 0.77 (0.45–1.34) a 0.29 (0.17–0.48) a 0.21 (0.10–0.44) a 0.35 (0.19–0.63) a Only relatives 1.10 (0.35–3.44) 0.97 (0.46–1.34) a 0.88 (0.43–1.80) a 0.68 (0.21–2.22) 0.44 (0.17–1.12)
Relatives and parents
1.70 (0.69–4.22) 0.70 (0.39–1.26) a 0.26 (0.15–0.45) a 0.14 (0.06–0.31) a 0.30 (0.14–0.62) a Nonrelatives 2.64 (0.93–7.48) 0.69 (0.35–1.36) a 0.28 (0.15–0.51) a 0.17 (0.07–0.39) a 0.29 (0.14–0.62) a
Other complex family type
1.03 (0.39–2.74) a 0.83 (0.39–1.78) a 0.39 (0.21–0.72) a 0.08 (0.03–0.23) a 0.16 (0.07–0.37) a Behavioral Problems Developmental Delay Asthma Obesity Speech Problems OR (95% CI) OR (95% CI) OR (95% CI) OR (95% CI) OR (95% CI)
Adopted from foster care
1.45 (0.81–2.60) 2.51 (1.33–4.73) 0.65 (0.35–1.21) 0.80 (0.40–1.63) 0.87 (0.41–1.84)
Married biological parents
0.13 (0.07–0.22) a 0.87 (0.47–1.60) a 0.49 (0.28–0.86) 0.84 (0.44–1.61) 0.64 (0.32–1.25)
Cohabiting biological parents
0.20 (0.09–0.42) a 0.83 (0.39–1.78) a 0.49 (0.27–0.91) 1.40 (0.66–2.96) a 0.70 (0.33–1.48) Married step-parents 0.37 (0.19–0.71) a 0.78 (0.40–1.52) a 0.62 (0.34–1.12) 0.86 (0.43–1.71) 0.50 (0.23–1.10) Cohabiting step-parents 0.42 (0.19–0.91) a 0.99 (0.47–2.11) a 0.67 (0.36–1.25) 0.95 (0.45–1.98) 0.61 (0.27–1.38) Single mother 0.28 (0.16–0.49) a 0.91 (0.49–1.68) a 0.63 (0.36–1.11) 1.06 (0.55–2.05) 0.61 (0.31–1.21) Single father 0.17 (0.08–0.40) a 0.73 (0.34–1.60) a 0.36 (0.18–0.71) a 0.76 (0.37–1.58) 0.43 (0.18–1.05) Only grandparents 0.42 (0.23–0.76) a 0.99 (0.53–1.83) a 1.11 (0.60–2.05) a 0.92 (0.47–1.83) 0.50 (0.24–1.02)
Grandparents and parents
0.21 (0.12–0.36) a 0.71 (0.38–1.31) a 0.63 (0.36–1.13) 1.18 (0.60–2.32) 0.52 (0.26–1.03) a Only relatives 0.58 (0.26–1.29) a 1.04 (0.44–2.46) a 0.78 (0.31–1.95) 0.72 (0.24–2.13) 0.64 (0.24–1.08)
Relatives and parents
0.18 (0.09–0.34) a 0.73 (0.35–1.49) a 0.58 (0.32–1.05) 1.33 (0.64–2.75) 0.51 (0.24–1.08) Nonrelatives 0.16 (0.08–0.32) a 0.81 (0.37–1.77) a 0.58 (0.26–1.28) 1.11 (0.49–2.50) 0.42 (0.18–0.96) a
Other complex family type
0.10 (0.05–0.23) a 0.52 (0.23–1.15) a 0.84 (0.41–1.72) 0.55 (0.25–1.19) 0.33 (0.14–0.76) a Hearing Problems Vision Problems Activity Limitation OR (95% CI) OR (95% CI) OR (95% CI)
Adopted from foster care
0.46 (0.10–2.18) 1.87 (0.51–6.92) 1.81 (0.98–3.32)
Married biological parents
0.39 (0.08–1.92) 0.75 (0.19–3.00) a 0.74 (0.43–1.29) a
Cohabiting biological parents
0.44 (0.08–2.38) 0.58 (0.13–2.55) a 0.73 (0.38–1.37) a Married step-parents 0.53 (0.10–2.73) 0.74 (0.18–3.12) a 0.88 (0.45–1.70) a Cohabiting step-parents 0.51 (0.10–2.72) 1.17 (0.23–6.04) 1.01 (0.47–2.14) Single mother 0.43 (0.08–2.16) 1.18 (0.29–4.86) 1.00 (0.57–1.75) a Single father 0.45 (0.11–1.93) 0.44 (0.12–1.63) a 0.49 (0.22–1.10) a Only grandparents 0.99 (0.25–3.98) 0.87 (0.25–3.02) 0.85 (0.46–1.56) a
Grandparents and parents
0.42 (0.08–2.22) 0.72 (0.19–2.80) a 0.85 (0.48–1.51) a Only relatives 0.58 (0.13–2.50) 0.91 (0.16–5.22) 0.88 (0.34–2.29)
Relatives and parents
0.49 (0.10–2.52) 0.94 (0.22–3.92) 0.81 (0.43–1.52) a Nonrelatives 0.21 (0.04–1.12) 0.60 (0.14–2.66) a 1.08 (0.46–2.56)
Other complex family type
0.26 (0.05–1.46) 0.31 (0.08–1.22) a 1.04 (0.45–2.39)
Across each outcome variable, the reference category is children who were neither placed in foster care nor adopted from foster
care. All models adjust for the following: child age, child is a girl, child born low bir
th weight, child race/ethnicity,
child fi
rst- or second-generation immigrant, mother age, parent highest educational attainment, parent married to child's biolo
gical father
, parent unemployed, family often has diffi
culty getting by on its income, household member receives welfare,
household member receives WIC, household income below the pover
ty line, parent owns home, child health insurance, child saw doc
tor in past year
, parent in fair or poor health, household member smokes inside home, and neighborhood not
always safe for child. All analyses account for the sampling design. a Coeffi
cient is statistically different from “adopted from foster care” coeffi
cient (
P
TABLE 5
Logistic Regression Models Estimating Children's Health as a Function of Foster Care Placement, With Comparisons to Economica
lly Disadvantaged Children: 2011–2012 NSCH
Fair or Poor Health
Learning Disability
ADD or ADHD
Depression
Anxiety
OR
(95% CI)
OR
(95% CI)
OR
(95% CI)
OR
(95% CI)
OR
(95% CI)
Children in foster care versus children in households below pover
ty
line (
N
= 22
793)
0.69
(0.23–2.06)
1.11
(0.58–2.14)
3.53
(1.85–6.74)
4.79
(2.02–11.32)
2.08
(0.97–4.48)
Children in foster care versus children in households receiving welfare (
N
= 8533)
0.53
(0.12–2.39)
0.93
(0.40–2.14)
3.31
(1.61–6.81)
2.66
(0.85–8.30)
2.71
(1.07–6.88)
Children in foster care versus children with public health insurance (
N
= 28
433)
0.75
(0.33–1.72)
1.31
(0.77–2.24)
3.16
(1.97–5.06)
4.93
(2.64–9.22)
3.78
(2.24–6.38)
Children in foster care versus children with no health insurance (
N
=
6617)
0.14
(0.03–0.69)
0.52
(0.14–1.91)
0.60
(0.12–2.98)
2.94
(0.51–17.15)
0.28
(0.06–1.38)
Children in foster care versus children of parents with < high school diploma (
N
=
13 771)
0.34
(0.08–1.52)
1.71
(0.87–3.37)
3.20
(1.68–6.11)
3.54
(1.34–9.30)
3.30
(1.65–6.60)
Children in foster care versus children with unemployed parent (
N
=
12 372)
0.83
(0.29–2.37)
1.08
(0.51–2.29)
3.95
(2.00–7.81)
3.99
(1.62–9.82)
3.58
(1.63–7.83)
Children in foster care versus children in not always safe neighborhoods (
N
=
38 094)
0.55
(0.19–1.65)
0.96
(0.50–1.86)
2.83
(1.59–5.04)
4.41
(1.84–10.54)
3.65
(1.90–7.01)
Children in foster care versus children with 3+ indicators of SES disadvantage (
N
= 21
077)
0.69
(0.30–1.57)
1.42
(0.84–2.42)
3.13
(1.91–5.13)
4.78
(2.47–9.25)
3.67
Behavioral Problems
Developmental Delay
Asthma
Obesity
Speech Problems
OR
(95% CI)
OR
(95% CI)
OR
(95% CI)
OR
(95% CI)
OR
(95% CI)
Children in foster care versus children in households below pover
ty
line (
N
= 22
793)
3.41
(1.64–7.09)
0.96
(0.40–2.30)
2.04
(1.03–4.04)
1.50
(0.72–3.15)
0.96
(0.44–2.09)
Children in foster care versus children in households receiving welfare (
N
= 8533)
3.13
(1.47–6.65)
0.72
(0.25–2.10)
1.30
(0.53–3.18)
1.61
(0.65–4.01)
1.05
(0.46–2.41)
Children in foster care versus children with public health insurance (
N
= 28
433)
4.24
(2.57–7.02)
1.30
(0.75–2.24)
1.39
(0.79–2.44)
0.97
(0.53–1.77)
2.06
(1.07–3.99)
Children in foster care versus children with no health insurance (
N
=
6617)
1.76
(0.50–6.23)
1.05
(0.20–5.50)
1.59
(0.50–5.03)
1.84
(0.48–7.10)
0.99
(0.14–6.89)
Children in foster care versus children of parents with < high school diploma (
N
=
13 771)
3.74
(1.99–7.04)
0.78
(0.33–1.88)
0.72
(0.36–1.44)
0.81
(0.33–1.99)
0.96
(0.35–2.61)
Children in foster care versus children with unemployed parent (
N
=
12 372)
3.17
(1.44–7.01)
1.23
(0.49–3.08)
1.24
(0.52–2.95)
0.73
(0.31–1.68)
2.06
(0.86–4.95)
Children in foster care versus children in not always safe neighborhoods (
N
=
38 094)
3.48
(1.87–6.47)
1.22
(0.59–2.50)
1.31
(0.69–2.49)
0.94
(0.49–1.81)
2.04
(0.90–4.66)
Children in foster care versus children with 3+ indicators of SES disadvantage (
N
= 21
077)
4.14
(2.44–7.03)
1.28
(0.71–2.32)
1.63
(0.93–2.85)
0.96
(0.51–1.81)
1.88
(0.96–3.71)
TABLE 5
Hearing Problems
Vision Problems
Activity Limitation
OR
(95% CI)
OR
(95% CI)
OR
(95% CI)
Children in foster care versus children in households below pover
ty
line (
N
= 22
793)
0.80
(0.26–2.51)
2.09
(0.43–10.22)
0.72
(0.32–1.62)
Children in foster care versus children in households receiving welfare (
N
= 8533)
0.88
(0.14–5.67)
4.23
(1.27–14.08)
0.87
(0.31–2.39)
Children in foster care versus children with public health insurance (
N
= 28
433)
1.66
(0.36–7.54)
0.99
(0.35–2.81)
1.25
(0.74–2.12)
Children in foster care versus children with no health insurance (
N
= 6617)
0.67
(0.07–6.68)
5.60
(0.39–80.60)
0.97
(0.23–4.06)
Children in foster care versus children of parents with < high school diploma (
N
= 13
771)
1.37
(0.35–5.34)
1.06
(0.25–4.40)
0.71
(0.29–1.74)
Children in foster care versus children with unemployed parent (
N
= 12
372)
1.50
(0.12–19.34)
0.84
(0.21–3.30)
1.24
(0.56–2.76)
Children in foster care versus children in not always safe neighborhoods (
N
= 38
094)
4.43
(0.48–40.74)
1.39
(0.22–8.67)
0.90
(0.40–2.01)
Children in foster care versus children with 3+ indicators of SES disadvantage (
N
= 21
077)
1.43
(0.30–6.71)
1.40
(0.36–5.50)
1.33
(0.76–2.34)
Across each outcome variable, the reference category is children who were neither placed in foster care nor adopted from foster
care. All models adjust for the following: child age, child is a girl, child born low bir
th weight, child race/ethnicity,
child fi
rst- or second-generation immigrant, mother age, parent highest educational attainment, parent married to child's biolo
gical father
, parent unemployed, family often has diffi
culty getting by on its income, household member receives welfare,
household member receives WIC, household income below the pover
ty line, parent owns home, child health insurance, child saw doc
tor in past year
, parent in fair or poor health, household member smokes inside home, and neighborhood not
always safe for child. All analyses account for the sampling design.
TABLE 5
not to ascertain whether foster care placement has an effect on children. 29 –33 Rather, our goal was to
use these large and representative cross-sectional data to provide a descriptive portrait of the health of children in foster care relative to other children.
Third, children placed in foster care were in poor mental and physical health relative to children in virtually every other type of family situation and in children in economically disadvantaged families. The differences in mental health outcomes (ADD/ADHD, depression, anxiety, behavioral or conduct problems) were statistically significant. The differences in physical health outcomes, although sometimes substantial, were not statistically significant. Additionally, the results show that children adopted from foster care had worse health than their counterparts placed in foster care. These differences could be driven partially by the fact that children in foster care only become available for adoption after parental rights have been terminated (and therefore these children have likely experienced more maltreatment than children who remain in the system) or because adoption subsidies offered in some states encourage adoption of children with health conditions.
Although this article significantly expands our understanding of the mental and physical health conditions of children in foster care, it has some key limitations. First, the data are cross-sectional, meaning we are unable to assess whether the associations shown are causal. We consider this to be only a small limitation because the core goal of this article was to paint a descriptive portrait of the mental and physical health of children in foster care. Second, some children in foster care, including those in group homes or those institutionalized (eg, juvenile justice system, hospital), are not included in the sampling frame.
Because there are strong reasons to expect these children are in
significantly worse mental and physical health than other foster children, the differences we show between children in foster care and other children are likely conservative. Third, measures of children’s health are reported by children’s caregivers. Although an ideal survey design would measure physician-reported health and/or anthropometric measures of health, parent-reported children’s health is correlated with physician-reported children’s health and is often used when physician-reported measures are not available. 34 –38 Finally, and relatedly,
reports of specific health conditions are based on caregiver reports of physician diagnoses, suggesting that children’s health conditions are underreported. If children placed in foster care are less likely than other children to have physician visits, which is likely given their relatively low socioeconomic status, the differences in children’s health by foster care placement are underestimated.
These limitations notwithstanding, this article makes an important contribution to knowledge in the field by showing, for the first time, that children who are in foster care are in significantly worse mental and physical health than children in the general population. As such, they are indeed a highly vulnerable population of children, something that both previous research and their histories of maltreatment implied, but that has never been demonstrated before. This is important information for the research community. Yet the implications for pediatricians are also important because they suggest that foster care placement is a risk factor for health problems in childhood.
ACKNOWLEDGMENTS
We thank the Data Resource Center for Child and Adolescent Health, Child and Adolescent Health
Measurement Initiative for providing
the 2011–2012 National Survey of Children’s Health. We also thank Centers for Disease Control and Prevention Research Data Center staff, Karon Lewis, MPH, and Ajay Yesupriya, MPH, for their expertise and support on data availability and security.
ABBREVIATIONS
ADD: attention deficit disorder ADHD: attention-deficit/
hyperactivity disorder CI: confidence interval NSCH: National Survey of
Children’s Health OR: odds ratio
SES: socioeconomic status WIC: Supplemental Nutrition
Program for Women, Infants, and Children
REFERENCES
1. US Department of Health and Human Services. The AFCARS report. Available at: www. acf. hhs. gov/ sites/ default/ fi les/ cb/ afcarsreport21. pdf. Accessed September 7, 2016
2. Wildeman C, Emanuel N. Cumulative risks of foster care placement by age 18 for U.S. children, 2000-2011. PLoS One. 2014;9(3):e92785
3. Gilbert R, Widom CS, Browne K, Fergusson D, Webb E, Janson S. Burden and consequences of child maltreatment in high-income countries. Lancet. 2009;373(9657):68–81
4. Andersen SH. A good place to live? On municipality characteristics and children’s placement risk. Soc Serv Rev. 2010;84(2):201–224
5. Berger LM, Paxson C, Waldfogel J. Mothers, men, and child protective services involvement. Child Maltreat. 2009;14(3):263–276
7. Cancian M, Slack KS, Yang MY. The Effect of Family Income on Risk of Child Maltreatment. Madison, WI: Institute for Research on Poverty, University of Wisconsin-Madison; 2010.
8. Coulton CJ, Korbin JE, Su M. Neighborhoods and child
maltreatment: a multi-level study. Child Abuse Negl. 1999;23(11):1019–1040 9. Drake B, Pandey S. Understanding the
relationship between neighborhood poverty and specifi c types of child maltreatment. Child Abuse Negl. 1996;20(11):1003–1018
10. Freisthler B. A spatial analysis of social disorganization, alcohol access, and rates of child maltreatment in neighborhoods. Child Youth Serv Rev. 2004;26(9):803–819
11. Garbarino J. The human ecology of child maltreatment: A conceptual model for research. J Marriage Fam. 1977;39(4):721–735
12. Kruttschnitt C, McLeod JD, Dornfeld M. The economic environment of child abuse. Soc Probl. 1994;41(2):299–315
13. Sullivan PM, Knutson JF. Maltreatment and disabilities: a population-based epidemiological study. Child Abuse Negl. 2000;24(10):1257–1273
14. Shonkoff JP, Garner AS, Siegel BS, et al; Committee on Psychosocial Aspects of Child and Family Health; Committee on Early Childhood, Adoption, and Dependent Care; Section on Developmental and Behavioral Pediatrics. The lifelong effects of early childhood adversity and toxic stress. Pediatrics. 2012;129(1). Available at: http:// pediatrics. aappublications. org/ content/ 129/ 1/ e232
15. Taylor CA, Guterman NB, Lee SJ, Rathouz PJ. Intimate partner violence, maternal stress, nativity, and risk for maternal maltreatment of young children. Am J Public Health. 2009;99(1):175–183
16. Zill N, Bramlett MD. Health and well-being of children adopted from foster care. Child Youth Serv Rev. 2014;40:29–40
17. Ahrens KR, Katon W, McCarty C, Richardson LP, Courtney ME. Association between childhood sexual abuse and transactional sex in youth aging out of foster care. Child Abuse Negl. 2012;36(1):75–80
18. Chisholm K. A three year follow-up of attachment and indiscriminate friendliness in children adopted from Romanian orphanages. Child Dev. 1998;69(4):1092–1106
19. Jonson-Reid M, Barth RP. From placement to prison: The path to adolescent incarceration from child welfare supervised foster or group care. Child Youth Serv Rev. 2000;22(7):493–516
20. Park JM, Metraux S, Broadbar G, Culhane DP. Child welfare involvement among children in homeless families. Child Welfare. 2004;83(5):423–436
21. Pecora PJ, Kessler RC, O’Brien K, et al. Educational and employment outcomes of adults formerly placed in foster care: Results from the Northwest Foster Care Alumni Study. Child Youth Serv Rev. 2006;28(12):1459–1481
22. Wildeman C, Waldfogel J. Somebody’s children or nobody’s children? How the sociological perspective could enliven research on foster care. Annu Rev Sociol. 2014;40:599–618
23. Zlotnick C, Tam TW, Soman LA. Life course outcomes on mental and physical health: the impact of foster care on adulthood. Am J Public Health. 2012;102(3):534–540
24. Centers for Disease Control and Prevention, National Center for Health Statistics. Frequently Asked Questions: 2011–2012 National Survey of Children’s Health. Available at: ftp:// ftp. cdc. gov/ pub/ Health_ Statistics/ NCHS/ slaits/ nsch_ 2011_ 2012/ 01_ Frequently_ asked_ questions/ NSCH_ 2011_ 2012_ FAQs. pdf. Accessed September 7, 2016
25. Blanchard LT, Gurka MJ, Blackman JA. Emotional, developmental, and behavioral health of American children and their families: a report from the 2003 National Survey of Children’s Health. Pediatrics. 2006;117(6). Available at: http:// pediatrics. aappublications. org/ content/ 117/ 6/ e1202
26. Mehta NK, Lee H, Ylitalo KR. Child health in the United States: recent trends in racial/ethnic disparities. Soc Sci Med. 2013;95:6–15
27. Turney K. Stress proliferation across generations? Examining the relationship between parental
incarceration and childhood health. J Health Soc Behav. 2014;55(3):302–319
28. Stata Statistical Software: Release 14 [computer program]. College Station, TX: Stata Corp; 2015
29. Berger LM, Bruch SK, Johnson EI, James S, Rubin D. Estimating the “impact” of out-of-home placement on child well-being: approaching the problem of selection bias. Child Dev. 2009;80(6):1856–1876
30. Berger LM, Cancian M, Han E, Noyes J, Rios-Salas V. Children’s academic achievement and foster care. Pediatrics. 2015;135(1). Available at: http:// pediatrics. aappublications. org/ content/ 135/ 1/ e109
31. Doyle JJ Jr. Child protection and child outcomes: Measuring the effects of foster care. Am Econ Rev. 2007;97(5):1583–1610
32. Doyle JJ Jr. Child protection and adult crime: Using investigator assignment to estimate causal effects of foster care. J Polit Econ. 2008;116(4):746–770
33. Wald MS, Carlsmith JM, Leiderman PH. Protecting Abused and Neglected Children. Palo Alto, CA: Stanford University Press; 1988
34. Bloom B, Cohen RA, Freeman G. Summary health statistics for U.S. children: National Health Interview Survey, 2008. Vital Health Stat 10. 2009;244:1–81
35. Case A, Lubotsky D, Paxson C. Economic status and health in childhood: The origins of the gradient. Am Econ Rev. 2002;92(5):1308–1334
36. Case A, Paxson C. Causes and consequences of early-life health. Demography. 2010;47(1 Suppl):S65–S85
37. Larson K, Russ SA, Kahn RS, Halfon N. Patterns of comorbidity, functioning, and service use for US children with ADHD, 2007. Pediatrics. 2011;127(3):462–470
DOI: 10.1542/peds.2016-1118 originally published online October 17, 2016;
2016;138;
Pediatrics
Kristin Turney and Christopher Wildeman
Mental and Physical Health of Children in Foster Care
Services
Updated Information &
http://pediatrics.aappublications.org/content/138/5/e20161118 including high resolution figures, can be found at:
References
http://pediatrics.aappublications.org/content/138/5/e20161118#BIBL This article cites 32 articles, 4 of which you can access for free at:
Subspecialty Collections
e_sub
http://www.aappublications.org/cgi/collection/adoption_-_foster_car
Adoption & Foster Care
following collection(s):
This article, along with others on similar topics, appears in the
Permissions & Licensing
http://www.aappublications.org/site/misc/Permissions.xhtml in its entirety can be found online at:
Information about reproducing this article in parts (figures, tables) or
Reprints
DOI: 10.1542/peds.2016-1118 originally published online October 17, 2016;
2016;138;
Pediatrics
Kristin Turney and Christopher Wildeman
Mental and Physical Health of Children in Foster Care
http://pediatrics.aappublications.org/content/138/5/e20161118
located on the World Wide Web at:
The online version of this article, along with updated information and services, is
http://pediatrics.aappublications.org/content/suppl/2016/10/14/peds.2016-1118.DCSupplemental Data Supplement at:
by the American Academy of Pediatrics. All rights reserved. Print ISSN: 1073-0397.