University of New Hampshire Scholars' Repository
Affiliate Scholarship
Center for Coastal and Ocean Mapping
1995
Paleoceanography of the eastern equatorial Pacific
during the Neogene: Synthesis of Leg 138 drilling
results
Nicklas G. Pisias
Oregon State University
Larry A. Mayer
University of New Hampshire
, [email protected]
Alan C. Mix
University of New Brunswick
Follow this and additional works at:
https://scholars.unh.edu/ccom_affil
Part of the
Geology Commons
, and the
Oceanography and Atmospheric Sciences and
Meteorology Commons
This Conference Proceeding is brought to you for free and open access by the Center for Coastal and Ocean Mapping at University of New Hampshire Scholars' Repository. It has been accepted for inclusion in Affiliate Scholarship by an authorized administrator of University of New Hampshire Scholars' Repository. For more information, please [email protected].
Recommended Citation
1. PALEOCEANOGRAPHY OF THE EASTERN EQUATORIAL PACIFIC DURING THE NEOGENE:
SYNTHESIS OF LEG 138 DRILLING RESULTS
1Nicklas G. Pisias,2 Larry A. Mayer,3 and Alan C. Mix2
ABSTRACT
The primary objective of Leg 138 was to provide detailed information about the ocean's response to global climate change during the Neogene. Two north-south transects were drilled (95° and 110°W) within the region of equatorial divergence-driven upwelling (and thus high accumulation rates and resolution) and spanning the major equatorial ocean current boundaries (and thus recording a high-amplitude signal of the response of the sediment to climatically and/or tectonically driven changes in ocean circulation). The Neogene is marked by a number of well-known climatic and tectonic events (the closing of the Isthmus of Panama, the onset of North Atlantic Deep Water (NADW), the rapid uplift of the Himalayas, the major intensification of Northern Hemisphere glaciation), and the response of the ocean before and after these events was a key focus of Leg 138 drilling.
To address these objectives at the highest resolution possible, the Leg 138 scientific staff developed a number of new shipboard strategies and analytical procedures. These included the real-time analysis of the near-continuous gamma ray attenuation porosity evaluator (GRAPE) and susceptibility profiles produced by the multisensor track (MST) on unsplit cores to monitor core recovery and, if necessary, to modify the drilling strategy to ensure proper offset of coring gaps; the collection of near-continuous color reflectance data on split cores; the logging of the first hole drilled at each site to optimize drilling and sampling strategies for subsequent holes; and the use of multiple continuous records to unambiguously construct complete composite sections for each site. The complete, continuous records provided by the GRAPE (with a temporal resolution of often yr), in conjunction with an excellent microfossil stratigraphy and often excellent magnetostratigraphy, allowed for astronomical tuning of the stratigraphic record and resulted in a set of internally consistent, high-resolution age models that provide a secure, absolute time scale for the past 6 m.y. For the period before 6 m.y., the absolute time calibration is less secure, but it is still better than any previously offered. The high-resolution stratigraphic framework of Leg 138 provided new insight into the previously ambiguous tectonic history of the region. By assuming that maximum sedimentation rates along the north-south transect would be expected at the equator, the Leg 138 stratigraphy supports the 1985 work of Cox and Engerbretson, which calls for two different poles of rotation of the Pacific Plate during the interval 0-20 Ma. The Leg 138 plate reconstructions also support several previously hypothesized ridge crest jumps and a slowing of the absolute motion of the Nazca Plate at about 5 Ma.
Although Leg 138 data that predates about 13 Ma is limited, the impression that one can gain from these data is that the eastern equatorial Pacific was characterized by relatively high carbonate concentrations and accumulation rates before about 11 Ma. This pattern was interrupted occasionally by rapid massive outpourings of near-monospecific laminated diatom oozes that probably represent the formation of massive mats along strong surface-water fronts. The laminated diatom oozes (LDO) continue to be present in the Leg 138 record (many of them being expressed as seismic reflections) until about 4.4 Ma. Carbonate accumulation rates begin to decline slowly between 11 and 9.8 Ma, when, at about 9.5 Ma, a near-complete loss of carbonate (the "carbonate crash") takes place everywhere in the Leg 138 region (and beyond), except at the westernmost sites close to the equator.
The "carbonate crash" was a time of fundamental change for the eastern equatorial Pacific, and perhaps for most of the ocean basins. Unlike many of the carbonate variations that precede and postdate it, this "crash" represents a major dissolution event whose effects can be traced seismically in the central and western Pacific. The changes in bottom-water chemistry associated with this event (or series of events) appear to be related to the early phases of the closing of the Panama Gateway. The role of NADW initiation and intensification for controlling carbonate accumulation in the eastern equatorial Pacific is still not resolved; however, ocean modeling demonstrates that the closing of the Panama Gateway may also have a direct influence on NADW production. Therefore, the effects of changes in the Panama Gateway sill depth and the production of NADW may be manifested in the history of eastern equatorial Pacific sedimentation.
The "carbonate crash" was followed by a recovery of the carbonate system (except in the Guatemala and Peru basins, which never recovered) that led up to the late Miocene/early Pliocene sedimentation rate maxima, during which equatorial sedimentation rates are as much as five times greater than those of the late Pliocene or Pleistocene. Examination of modern productivity/preser-vation relationships implies that the sedimentation rate maximum was the result of enhanced productivity. The distribution of eolian sediments and isotopic gradients, along with an analysis of the modes of variance in carbonate deposition over the last 6 m.y., suggest a more northerly position of the Intertropical Convergence Zone (ITCZ), a stronger north-south gradient across the equator, and a more zonal circulation focused along the equator during the time of maximum sedimentation. The mechanisms suggested for these changes in circulation patterns include the response of the eastern equatorial Pacific to the closing of the Isthmus of Panama, as well as a global increase in the flux of Ca and Si into the oceans, a possible response to evolution of the Himalayas and the Tibetan Plateau.
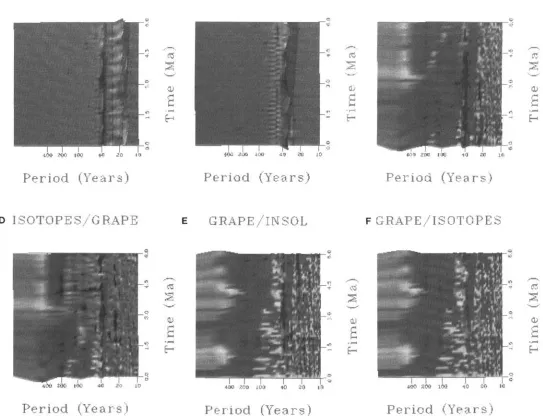
In an effort to understand the response of the climate system to external (orbital) forcing, 6-m.y.-long, continuous records of carbonate (derived from GRAPE), δ1 8θ and insolation were analyzed and compared. Evolutionary spectral calculations of the
variance and coherence among these records indicate that the insolation record is dominated by precessional frequencies, but that the relative importance of the two precessional frequencies has changed significantly over the last 6 m.y. In general, precessional forcing is not found in the carbonate or isotopic records. In the tilt band, however, a linear response is present between solar forcing
Pisias, N.G., Mayer, L.A., Janecek, T.R., Palmer-Julson, A., and van Andel, T.H. (Eds.), 1995. Proc. ODP, Sci. Results, 138: College Station, TX (Ocean Drilling Program).
College of Oceanic and Atmospheric Sciences, Oceanography Admininstration Building 104, Oregon State University, Corvallis, OR 97331-5503, U.S.A.
and the carbonate and isotope records over some intervals. The carbonate record appears to be tightly coupled to the tilt component of insolation before about 1.9 Ma; however, the isotope record does not begin to show sensitivity to orbital tilt until about 4.5 Ma, the time of significant changes in sedimentation patterns in the eastern equatorial Pacific. Only during the last 500,000 yr do all frequencies respond in a similar manner; we also see a marked increase in the response of the isotopic record to orbital forcing (including 100,000- and 400,000-yr periods).
INTRODUCTION
Because of the historic voyage of the original Challenger expedi-tion, the sediments of the equatorial Pacific Ocean have been known to be sensitive recorders of Oceanographic change. With the coming of the age of deep-sea drilling and the pioneering work of van Andel et al. (1975), we have come to understand that the sediments of the equatorial Pacific record a complex interplay of ocean chemistry, productivity, climate, and plate tectonics. As our technology im-proves and our understanding of the ocean/climate system grows, we have returned to the equatorial Pacific for an increasingly closer look at the workings of this complex system. Our most recent effort, Leg 138, brought a host of new tools and procedures to attack this prob-lem. In this chapter, we try to synthesize some of the strategies used and results gleaned from Leg 138. We must emphasize, however, that despite the more than 2 yr since the completion of Leg 138, we feel that we have only begun to scratch the surface of Leg 138's treasure-trove of data; our findings are thus preliminary and will certainly be modified and built upon in the years to come.
The primary objective of Leg 138 was to provide information on the ocean's response to global climate change during the Neogene. To address this objective, we chose to drill two north-south transects of sites: one along 110°W and another along 95°W. These transects are within the region of equatorial divergence and thus have high biogenic accumulation rates that will provide high resolution. They also span the major equatorial ocean current boundaries and thus record a high-amplitude signal as the accumulated sediment changes in response to climatically and/or tectonically driven changes in the ocean circulation.
The evolution of Earth's climate during the Neogene is marked by a number of global and local events. During the early Neogene, open circulation between the tropical Pacific and Atlantic oceans was possible through the Panamanian Seaway. How this inter-ocean ex-change affected oceanic circulation in the eastern Pacific is not well known. Recent numerical modeling results show little oceanic re-sponse in the Pacific to this tectonic event (Maier-Reimer et al., 1990), but the model does not include coupled atmospheric circula-tion. Previous studies of regional sedimentation rates of the equatorial Pacific demonstrated significant redistribution of sediment accumu-lation rates during the latest Miocene and early Pliocene, which suggests a marked change in oceanic production in response to this tectonic event (van Andel et al., 1975; Pisias and Prell, 1985). How-ever, how this change in sedimentation is related to changing ocean circulation is poorly understood. The drilling transects of Leg 138 provide the necessary paleoceanographic observations that, com-bined with more sophisticated modeling efforts, should produce sig-nificant new insights into this paleoceanographic question. By under-standing the relationship between changes in circulation and changes in sediment accumulation, we can also hope to gain insight into the general workings of the ocean/climate system.
During the Pliocene, significant increases in Northern Hemisphere glaciations occurred. Isotopic evidence shows that intensification of Northern Hemisphere glaciation started at about 3 Ma, culminating in the first major Northern Hemisphere glaciation at 2.5 Ma (Shackleton et al., 1984, and this volume). This event in the Northern Hemisphere should have had a profound effect on the symmetry of the earth's thermal gradient, which would be reflected in atmospheric circulation patterns (Flöhn, 1978). The Leg 138 transects were also designed to provide a high-resolution look at the response of the equatorial Pacific to these events.
Atmospheric circulation is an important aspect of global climate. Yet, because direct evidence for changes in zonal wind strength is
rarely preserved in sedimentary deposits, past variations in zonal wind intensity are poorly understood. Temporal changes in the inten-sity of atmospheric circulation are reflected in the size distribution of small eolian particles transported in equilibrium with the winds. Eolian particles isolated from pelagic sediments recovered during Leg 138 drilling provide an opportunity to investigate the nature and variability of late Neogene atmospheric circulation intensity in both the Northern and Southern hemispheres. Comparing these records will enable a better understanding of the response and development of the hemispheric asymmetry in atmospheric circulation intensity as the Earth evolved from unipolar to bipolar glaciation.
Specific paleoceanographic questions addressed by Leg 138 drill-ing include:
1. How did Pacific equatorial circulation evolve through the late Cenozoic as a response to increased global glaciation?
2. Are Oceanographic changes hemispherically symmetrical or asymmetrical?
3. What was the nature of the circulation system during the late Miocene when open communication with the Atlantic occurred through the Panamanian Seaway?
4. What was the nature of Oceanographic variability during the late Miocene and Pliocene and how does this compare to the Pleisto-cene (i.e., do the changing boundary conditions modify the sensitivity of the system)?
5. What was the nature of circulation during the Pliocene after the closure of Panama but before the onset of Pleistocene glaciation in the northern hemisphere?
6. How do Oceanographic changes affect productivity in the equa-torial Pacific surface waters?
7. How are paleoceanographic changes expressed in the physical, acoustic, and color properties of the sediment; can the high-resolution seismic record be a useful paleoceanographic tool?
As we attempt to answer these questions, we hope to provide the important clues needed to understand the cause and nature of Oceano-graphic and climatic variability. The last million years of EartiYs history are characterized by large changes in Northern Hemisphere ice cover. These changes have been linked to changes in solar radia-tion—the Milankovitch hypothesis. The identification of the oceans' and atmosphere's responses is complicated by the presence of both large ice-volume changes and changing external (insolation) forcing. Examination of the ocean system at times before major Northern Hemisphere ice sheets (Question 5) provides the means of determin-ing the effects of external forcdetermin-ing and changes in boundary conditions caused by changes in ice volume. Comparison between the variability and nature of Oceanographic conditions during the late Miocene and Pliocene (Question 4) provides information about the sensitivity of the climate system to changes in major oceanic boundary conditions. Leg 138 has provided a legacy of material that will be analyzed for many years to come; this volume represents only the initial phases of these efforts. In this chapter, we highlight some of the important paleoceanographic results obtained to date but more importantly, we identify some important questions and problems yet to be answered.
REGIONAL SETTING
Oceanographic Setting
20°N J
20c
160°W 140c 120 1OOC
Figure 1. General circulation of the equatorial Pacific showing major surface and subsurface currents. NEC = North Equatorial Current, NECC = North Equatorial Countercurrent, EUC = Equatorial Undercurrent, SEC = South Equatorial Current, CAC = California Current, PC = Peru Current, and CHC = Chile Current.
fundamental feature of this circulation pattern is the asymmetry of surface currents north and south of the equator. This asymmetry reflects the general position of the ITCZ, which marks the conver-gence between the northeast and southeast trade winds. In the pres-ent-day climate system, the position of the ITCZ is essentially always north of the equator in the eastern equatorial Pacific. This northerly position, combined with the change in sign of the Coriolis force at the equator, results in the classical picture of surface convergence and divergence. Along the equator, divergence results in a depression in sea-surface topography and a pressure gradient that is balanced by geostrophic flow to the west, both north and south of the equator. This flow is the South Equatorial Current (SEC). Waters from the Peru Current, which carries colder waters from high latitudes into the equatorial current system, and from the eastward-flowing subsurface Equatorial Undercurrent all provide source waters for the SEC.
Seasonal variation in the equatorial current system reflects the seasonal movement of the ITCZ and the seasonal change in the strength of the trade-wind systems. The strength of the SEC reflects changes in the strength of the Southern Hemisphere trade-winds. Wyrtki (1967) describes three patterns of circulation that reflect the movement of the ITCZ.
During August to December, the ITCZ is in its northerly most position at about 10°N, and the southeast trades are at their strongest. The SEC is at its strongest and the NECC is fully developed. As the NECC flows eastward, it turns in a cyclonic cell around the feature known as the Costa Rica Dome and is a major contributor of water flowing into the NEC south of 20°N. The California Current turns away from the American coast at about 25 °N and only contributes
water to the NEC north of about 20°N (Wyrtki, 1965). This circula-tion pattern seems to be the most stable pattern associated with a northerly position of the ITCZ (Wyrtki, 1965).
During February to April, the ITCZ is at its most southerly posi-tion, the southeast trades are weakened, and the northeast trades are strongest. During this period, the NECC does not develop because of the increased intensity and southerly position of the ITCZ. The SEC is much weakened as a result of the decrease in the southeast trades. The California Current is strengthened during this interval and pene-trates to about 3°N. The California Current is the major contributor of waters in the NEC. Within the Panama Basin and the Gulf of Tehuan-tepec, two large gyres form. A cyclonic gyre flows around the region of the Costa Rica Dome (at about 8°N, 86°W), and an anticyclonic gyre in the Panama Basin is centered at about 5°N and 88°W.
During May to July, the ITCZ returns to its northerly position. During this interval, however, the California Current is strong and the NECC begins to develop and strengthen. Unlike the period from August to December, the NECC turns northward and contributes waters to the Costa Rica Coastal Current, which flows along the Central American coast. This pattern, according to Wyrtki (1965), is less stable that the first pattern discussed.
(Wyrtki, 1974). Empirical orthogonal function analysis of sea-level records from the central and eastern equatorial Pacific further con-firms the asymmetry of the equatorial circulation (Baumgartner and Christensen, 1985). Baumgartner and Christensen (1985) suggested that the equatorial circulation can be viewed as two closed cells, the circulation made up of the South Pacific gyre, including the SEC and the Peru Current, and the cell that includes the NEC and NECC sys-tems. The change in the strength of divergence along the equator and between the NEC and NECC is seen in the out-of-phase response of organic carbon production and flux to the deep sea as observed in sedi-ment trap experisedi-ments (Pisias et al., 1986; Dymond and Collier, 1988). The Equatorial Undercurrent (EUC) plays a critical role in defin-ing the characteristics of the water associated with "equatorial up-welling." Through an analysis of Δ14C combined with ocean
circu-lation models, Toggweiler et al. (1991) helped to clarify the complex nature of circulation processes of the EUC. Toggweiler et al. noted that "Water forming the core of the Equatorial Undercurrent in the central Pacific does not reach South America." These waters become entrained into the surface layer west of the Galapagos between 110° and 95°W. Bryden and Brady (1985) suggested that the cold-water tongue along the equator results from the entrainment of 20°-21 °C waters from the EUC. Toggweiler et al. (1991) argued that the water that upwelled along the Peru coast comes from the lower layers of the EUC. These waters have T-S properties of 11° to 14°C and 34.8‰> to 35.0‰. This water is cooler and saltier; it also contains higher nutri-ents than water upwelled along the equator in the equatorial diver-gence (Toggweiler et al., 1991).
An important implication of the Toggweiler et al. (1991) study is the connection between sub-Antarctic processes and the equatorial Pacific. The proposed source of the waters in the lower layers of the EUC is in the southwest Pacific, where sub-Antarctic Mode Water is formed. This water has the correct physical characteristics, especially in terms of the Δ14C levels. Thus, the inference that the waters that
upwell within the Peru Current are derived, in large part, in the sub-Antarctic, is basically correct. However, the impression that in the present-day ocean this water comes from the sub-Antarctic by ways of the eastern boundary current of the South Pacific gyre is probably, in part, not correct.
This new picture of the source waters for the EUC, combined with the conceptual view of the circulation of the equatorial Pacific, leaves us with a complex interaction of a number of processes that would affect the characteristics of surface waters at Leg 138 sites. Nutrient fluxes to sites within the equatorial band, for example, will reflect the intensity of equatorial upwelling, the strength of advection of waters upwelled along the Peru margin (processes controlled mostly by local wind-stress), as well as the physical and chemical characteristics of these waters, which reflect Oceanographic processes, processes that occur nearly a quarter of EarüYs circumference away, at much higher latitudes. The chemical characteristics of this water reflect both the chemical composition at its source and also the mixing and chemical alteration that occurs as it flows from the southwest Pacific to the equator and, finally, eastward to the Peru region. Finally, if we call upon links between equatorial Pacific circulation and sub-Antarctic Mode Water, we cannot escape the potential influence of tectonic events and other processes that can result in circulation changes in any of the ocean basins.
Tectonic Setting
Placing the paleoceanographic records from Leg 138 into a correct geographic framework requires an understanding of the tectonic set-ting of Leg 138 sites. Sites drilled during Leg 138 are located on three lithospheric plates of the eastern Pacific: the Cocos, Nazca, and Pacific plates. The sites of the western transect (Sites 848-854) are presently on the Pacific Plate. Sites 848,849,850,851,853, and 854 are thought to have formed at the present East Pacific Rise, whereas Site 852 is near a proposed fossil spreading center that became inactive from 10 to 11
Ma, very close to the basement age of Site 852 (van Andel et al., 1977; Mammerickx and Klitgord, 1982). Backtracking of all sites in the western transect (Fig. 2) is constrained for at least the last 10-11 m.y. by the hotspot reference frame for the Pacific Plate.
A number of possible solutions exist for the absolute rotation of the Pacific Plate. However, the high-resolution chronostratigraphy developed using the method of orbital tuning (Shackleton et al., this volume) provides an important test of proposed rotation parameters for the Pacific Plate. In Figure 3, we plot the sedimentation rates estimated for the sites along the 110°W transect vs. latitude. Each frame in Figure 3 represents the interval between the GRAPE events defined by Shackleton et al. (1992). In Figure 3, the paleolatitudes for these sites were calculated using the rotation pole of van Andel et al. (1975). Because of the change in sign of the Coriolis force at the true geographic equator, we assume that the highest sedimentation rate along a north-south transect should be located at the equator where equatorial divergence would always be present.
The rotation parameters of van Andel et al. (1975) result in an over-rotation of the sites. The maxima in sedimentation rates are found south of the equator, especially during the interval of very high sedimentation rates between 7.5 and 4 Ma (Fig. 3). If we use the pole of rotation of van Andel et al. (1975), we need to reduce the rotation rate by nearly 50% to have the maximum sedimentation rates cen-tered at the equator. The discrepancy illustrated in Figure 3 most likely reflects the fact that the rotation parameters, though defined by van Andel et al. (1975) using sedimentation rate patterns, were based on data spanning most of the Cenozoic. The data of van Andel et al. (1975) were of much lower resolution, so that the interval of time of the Leg 138 sites is represented by only one datum.
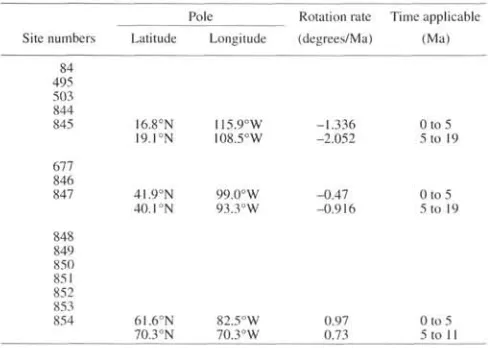
In Figure 4, the same data as shown in Figure 3 are plotted, but here the rotation parameters of Cox and Engebretson (1985) are used. This rotation scheme is based on dates for hotspot traces that span the late Neogene and, thus, this scheme is much more comparable to the Leg 138 data than the van Andel et al. (1975) study. Using the rotation of Cox and Engebretson (1985), the maxima in sedimentation rates along this north-south transect are now centered at the equator. There are two important differences between the rotation parameters of Cox and Engebretson (1985) and those of van Andel et al. (1975). For the period of the late Cenozoic sampled at Sites 848-854, van Andel et al. defined only one set of parameters (pole = 67°N, 59°W, W = 0.83°/m.y.), whereas Cox and Engebretson provide two poles for this interval (for the 0-5 Ma pole = 61.6°N, 82.5°W, W = 0.977m.y.; and for the 5-20 Ma pole = 70.3°N, 74.4°W, W = 0.737m.y.). Although the rotation rates for these reconstructions are comparable (average for Cox and Engebretson is 0.797m.y. vs. 0.837m.y. for van Andel et al.), the pole of rotation for the Pacific Plate differs significantly, especially in terms of the longitude of the pole. Again, these differ-ences most likely reflect the differing temporal resolution of the data used to define these rotation schemes. Based on these results, we use the Cox and Engebretson poles to constrain the absolute rotation of all sites in the eastern equatorial Pacific.
10°N ~
0°
I I I I I
-_
-• -•
I I I I I
I 1 1 1 I I
854.
852^ 8 5 ^ #
851. ^
8 5 0 . ,
• * t
849
Φ
848 *
i i i i I i
i i i i i i i i 1
* * * * * * * * * -4*
> *
1 1 1 1 1 1 1 1 I
1 1 1 1 1 1
845.
+
t
f*• t
» * * • *• *
••***• **J47
1 1^1 | 1 1 1 1 1
49% ^ • v
• X
4. OΛΛ4 t * 4 * •t
•t *
^ 4 6
1 1 1 1 1 1 1 1 1 1 I 1 1
/ (
V \
^ 4 *
• *
<
(
1 1 1 1
1 • •
** \
1
/
/
/
f
s
/
\
1 l\l
-/ —
_
-1
-1 -1 -1 -1 -1 -1
120°W 110°W 100°W 90°W 80°W 70°W
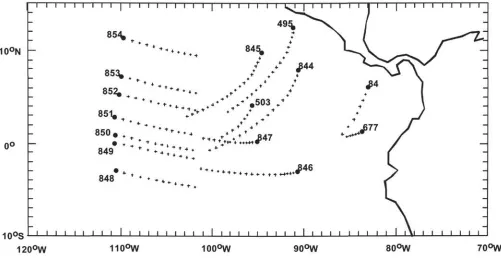
Figure 2. Backtracked paths for Leg 138 sites and other selected sites drilled during earlier ODP and DSDP legs.
The sites on the Cocos Plate (844 and 845) have the least con-strained backtrack paths (see van Andel et al, 1975). The position of Site 844 suggests that it was formed on the East Pacific Rise and its basement age is consistent with the tectonic reconstruction of Hey et al. (1977). Site 845 is located in a region where magnetic anomalies can be mapped (showing a lineated pattern trending northwest/south-east) but cannot be correlated to the marine magnetic anomaly se-quence (Klitgord and Mammerickx, 1982). The trend of these anom-alies is more westward than anomaly trends produced at the East Pacific Rise. The site is located just east of the Berlanga Rise, which has been interpreted as a fossil spreading center. The unknown history of this feature increases the uncertainty of the backtrack history of this site. For the reconstruction shown in Figure 2, we have used the relative rotation poles for the Cocos/Pacific plate from DeMets et al. (1990), that is, 36.823°N, 108.629°W and W = 2.097m.y. Again, the calculated absolute pole based on the Pacific pole of rotation is given in Table 1.
In Figure 2, we show the backtrack paths for all Leg 138 sites, as well as a number of other eastern equatorial Pacific drill sites. For each site, we show the backtrack paths at 1-m.y. increments, with the last point in the path indicating the location of the site when the basement formed. For all sites shown, basement was sampled except for Site 847. We used an estimated basement age of 12 Ma for this site. The rotation scheme used here, for the most part, produces a consistent picture for backtracking of these sites. A number of impor-tant implications are relevant for this reconstruction, as follows:
1. The crossing of the rotation path of Site 845 with the path for Site 852 suggests that the East Pacific Rise was farther west at about 3°N (location of Site 845) than at 2°S (location of Site 846) at 18 Ma. Shown in Figure 2 is the position of Site 845 when Site 852 was at the ridge crest. At 10 Ma, the EPR is at about 101 °W, but at 18 Ma the EPR was farther west at about 103°W, suggesting a ridge jump between these two ages. This is consistent with the hypothesized fossil spreading center discussed by van Andel et al. (1975, fig. 7).
2. The crossing of rotation paths for Sites 844 and 847 would also suggest a ridge jump between the time of formation of Sites 847 (-12 Ma) and 844 (-19 Ma).
3. Sites 846 and 677/504B have differing basement ages, but they were formed at about the same location.
4. Constant rotation between the Pacific and Nazca plates, com-bined with the two pole rotation schemes for absolute motion of the Pacific Plate, suggests that the absolute motion of the Nazca Plate significantly slowed at 5 Ma.
STRATEGY
Sβd Rote 110W (Van And l .83/my) Sβd Rαt 110W (Cox and Eπg brβt on) ^ βθ
5 40
0 i ^ i •— i i
80 o ><= 4 0
0
5 40 0
40
0 - 4
80 od 40
0
_ 80
S 40
0
• " • •
8 12
8 12
8 12
12
- 4 0 4 8 12
Latitude (deg)
Figure 3. Sedimentation rates at Leg 138 sites along 110°W. Sedimentation rates were determined between GRAPE events identified by Shackleton et al. (1992). The latitude for each site is calculated according to the rotation scheme of van Andel et al. (1975).
34O o
ö 4O 0
^ 40
O
80
O
80
S 40
0
_ 80
2 40
0
a
8 02 40
0
I
- 4
- 4
- 4
r u_—i —4
0
0
, • *
-0
0 4
4
4
Zfc=C
4 8
8
fc i . — . 8
K — j 1
8 12
J
12J
12J
128 12
1 2
0 4 8 12
Latitude (deg)
Figure 4. Sedimentation rates as shown in Figure 3, but with paleolatitudes estimated according to the rotation scheme of Cox and Engebretson (1985).
between cores offset. Unfortunately, until the procedures instituted during Leg 138, it was impossible to monitor, while drilling, the success at achieving the proper offset and, thus, the success at recov-ering a complete sedimentary section.
To monitor the coring process while drilling, we used three types of continuously measured sedimentary properties: (1) the density of the sediment as determined by the gamma-ray attenuation porosity evaluator (GRAPE), (2) sediment magnetic susceptibility acquired with a pass-through Bartington susceptibility ring, and (3) multispec-tral sediment color reflectance. The GRAPE and susceptibility data were measured at sampling intervals of 2 and 5 cm, respectively, on unsplit cores as soon as the cores reached the shipboard laboratory, using the ODP multisensor track system (MST; see Mayer, Pisias, Janecek, et al., 1992 for details of procedures, and Schultheiss and McPhail, 1989, for a description of the MST). In conjunction with ODP, standard shipboard software was modified to permit the imme-diate transfer of MST data from the shipboard computer system to the Shipboard Scientific Party. Color reflectance was measured at 3-cm intervals on split sediment cores with an automated tracking system developed at Oregon State University (Mix et al., 1992). The system measures the reflectance of light in 511 wavelength bands that range from the visible to the near-infrared. These data were made available to the Shipboard Scientific Party before the initial description of the split core was completed.
Another strategy aimed at recovering complete sections was our decision to log the first hole drilled at each site (rather than the more conventional practice of leaving logging until the completion of all drilling at a site). This provided the opportunity for the shipboard scientists to obtain an initial stratigraphy for the site and allowed us to compare the GRAPE, susceptibility, and color reflectance data with the downhole logs before drilling the second hole. With an initial stra-tigraphy and a reasonable idea of what the complete section looked like, we were able to optimize our drilling and sampling strategy in the subsequent holes to assure complete recovery.
By comparing the GRAPE, susceptibility, and color reflectance data from each hole moments after core recovery, we were also able to monitor core recovery in near-real time and, if necessary, to mod-ify the drilling strategy to ensure the proper offset of coring gaps. Through independent comparisons of GRAPE, susceptibility and color reflectance data, we were able to use the data from multiple holes to fill the gaps unambiguously and to construct a complete composite section at a given site (see Hagelberg et al., 1992). During initial shipboard correlation procedures, core data were shifted in their relative position, and not stretched or squeezed; during sub-sequent post-cruise analyses, more detailed correlations were made among holes, and between the drilling and logging results, using the inverse correlation techniques of Martinson et al. (1982). Once the detailed interhole correlations were made, the records from adjacent holes were "stacked" to produce continuous, 6-m.y.-long time series with temporal resolutions of less than 1000 yr and a common depth scale for all sites (Hagelberg, this volume).
The high-resolution objectives of Leg 138 required not only the collection of continuous sections, but also the development of a strati-graphic framework that would allow us to explore the nature of Ocean-ographic and climatic variability on time scales of a few thousand years. Our initial shipboard stratigraphy was based on the excellent microfossil records preserved in the sediments of the eastern equatorial Pacific (in general, all microfossil groups were present), combined with less consistent, but often excellent, sections of magnetic polarity reversals (see Schnieder and Meynardier et al., both in this volume). The age model used for shipboard work was a modified version of that of Berggren et al. (1985) with a small number of datum levels redated according to the magnetostratigraphy obtained from Sites 844 and 845 (see "Explanatory Notes" chapter in Mayer, Pisias, Janecek, et al., 1992). The result was a fairly self-consistent set of datum levels that provided the age models presented in Shackleton et al. (1992).
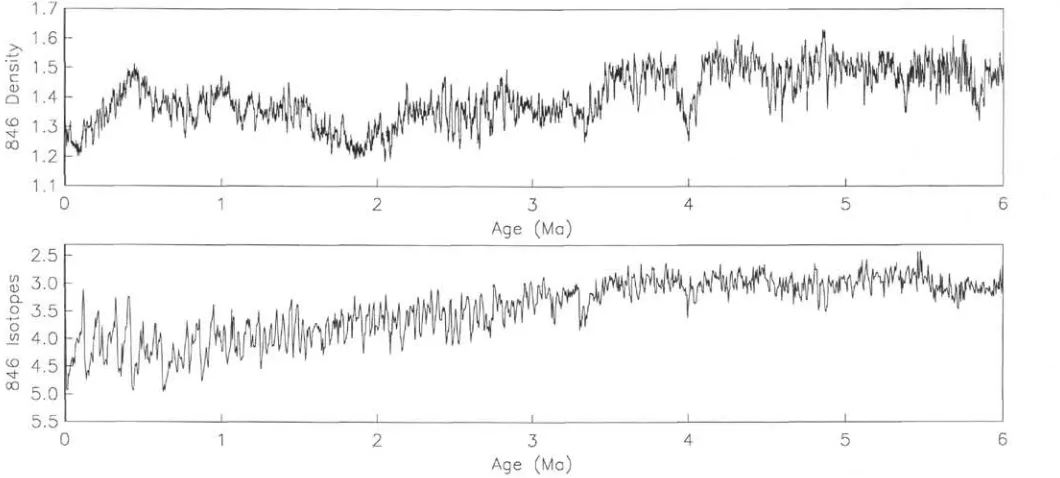
The focus of Leg 138 drilling on regions of high sedimentation rate known to have pervasive lithologic cyclicity, however, offered the possibility of reliably detecting orbital signals in the sediments and, thus, refining the stratigraphies through astronomical tuning. The continuous records of changes in saturated bulk density that are measured with the GRAPE have been shown, in the central equatorial Pacific, to be representative of cyclic variations in the percentages of the climatically sensitive biogenic opal and calcium carbonate and, thus, to contain a strong imprint of variations in EartiYs orbital ge-ometry (Mayer, 1991). Shackleton et al. (this volume) have taken the stacked composite GRAPE records of Hagelberg et al. (this volume) and compared the cyclicity contained in these records with the time scale generated by Berger and Loutre (1991) based on variations in the geometry of the Earth-sun orbital system. The resulting astro-nomically tuned time scale for the GRAPE record was used to recali-brate a section of the magnetic polarity time scale and was then applied to the extensive series of biostratigraphic datums determined during Leg 138 to refine the Neogene biostratigraphic time scale (see both chapters by Shackleton et al. in this volume). The result of this effort has been a set of internally consistent, high-resolution age models that provide an orbitally tuned absolute time scale for the past 6 m.y. For the period before 6 m.y., the absolute time calibration is less secure, but it is better constrained than any previously offered.
Given the ability to examine the Leg 138 sites in the context of a robust high-resolution stratigraphy, we can begin to explore, with increased confidence, the nature of Oceanographic and climatic changes in the eastern equatorial Pacific. As a starting point in our effort to synthesize the initial results of Leg 138, we use the remark-able stratigraphic framework produced by the Leg 138 scientists to explore the history of sedimentation in the region. First, we will present an overview of the spatial variability of the system, and then we will focus on several specific time intervals that exemplify the type of analyses that can be conducted with Leg 138 data.
OVERVIEW OF TEMPORAL AND
SPATIAL VARIABILITY OF THE
EASTERN EQUATORIAL PACIFIC
Farrell et al. (this volume) and Kemp (this volume) explore the spatial and temporal variability of a number of sedimentary compo-nents (composition, flux, and nannofossil preservation) of the Leg 138 region and put together a generalized evolution of sedimentation in the eastern equatorial Pacific. They have divided the temporal record into six intervals of distinctive sedimentary character:
1. 13-11.2 Ma: An interval characterized by moderately high carbonate concentrations and mass accumulation rates. The longer records at Sites 844-846 indicate that these levels probably were present as far back as 18 Ma. Carbonate concentrations and fluxes were much higher than opal concentrations and fluxes during this interval, despite the fact that near-monospecific laminated diatom ooze (LDO) beds (see Kemp et al., this volume, and below) occur occasionally throughout this time period.
2. 11.2-9.8 Ma: Carbonate concentrations and fluxes decline at all sites, but opal concentrations and fluxes increase. LDO beds are prevalent during this time. Spatial gradients are dominated by the equator, though Sites 844 and 845 show relatively high carbonate accumulation rates.
3. 9.8-9 Ma: During this period, the eastern sites (844, 845, and 846) had an almost complete loss of carbonate, whereas the western sites show a more subtle decline in carbonate. A relatively steep spatial gradient of carbonate accumulation is apparent, as equatorial sites maintain carbonate, but off-equatorial sites drop to near-zero accumulation rates. Diatoms appear to have been replaced by radio-larians as the major siliceous component at this time, and there is evidence for the accumulation of oxide-rich sediments. Nannofossil
Table 1. Parameters used to backtrack Leg 138 sites to paleopositions. Site numbers 84 495 503 844 845 677 846 847 848 849 850 8 5 ! 852 853 854 Latitude 16.8°N 19.TN 41.9°N 40.1 °N 61.6°N 70.3 °N Pole Longitude 115.9°W 108.5°W 99.0°W 93.3°W 82.5°W 70.3°W Rotation rate (degrees/Ma) -1.336 -2.052 -0.47 -0.916 0.97 0.73 Time applicable (Ma) Oto 5 5 to 19
Oto 5 5 to 19
Oto 5 5 to 11
preservation is extremely poor during this interval, implying dissolu-tion as the key agent in the loss of carbonate (see discussion below). 4. 9-6.6 Ma: A recovery in carbonate sedimentation occurs throughout the region, although it is more prevalent in the west than in the east. A less dramatic decrease in carbonate is noted at about 7.8 Ma, followed by a rapid increase in carbonate sedimentation at all sites except the two northeasternmost sites (844 and 845), which have moved out of the equatorial divergence zone and remain relatively free of carbonate to the present day. Biogenic accumulation is con-centrated around the equator, with some evidence of steepening spa-tial gradients in carbonate accumulation in both the east-west and north-south directions.
5. 6.6-4.5 Ma: During this period, all sites (with the exception of the northeastern Sites 844 and 845) experienced an extremely large increase in biogenic accumulation rates. Spatially, the pattern of sedi-mentation is somewhat similar to earlier patterns, but a clear expan-sion of the equatorial high-productivity zone is evident from the large increase in carbonate accumulation at the off-equator sites relative to the equatorial sites. Although accumulation rates were extremely high during this interval, they also were highly variable. This large in-crease in biogenic accumulation appears to be global in extent (see discussion below).
6. 4.5-0 Ma: Sedimentation rates along the western transect be-came moderate and remained relatively stable to the present (relative to the earlier Neogene), with a spatial concentration of carbonate accumulation around the equator. There is, however, a noticeable reduction in carbonate off the equator during the Cahiti-Mammoth interval (3.88-3.18 Ma) and a major shift in the locus of opal sedi-mentation from the western sites to the Galapagos region at about 3 Ma. The diatom content of the sediment increased during the early Pleistocene, with a dominance of Thalassiothrix longissima but with-out the preservation of diatom mats. Terrigenous sediments are con-centrated nearest the continental margin.
LAMINATED DIATOM OOZES
An intriguing result of Leg 138 was the recognition, within the preserved record, of intervals of near-monospecific assemblages of the pennate diatom, T. longissima, which are interpreted to be the depositional product of diatom mats (Kemp and Baldauf, 1993). In some time intervals, these very rapidly deposited, surface-derived laminated diatom oozes (LDO) are the primary source of carbonate-silica variability. Although exceptions do exist, almost all of the LDO intervals were deposited between 0° and 2°S. Temporally, the depos-its are found intermittently between 15 and 4.4 Ma, with concentra-tions at about 15, 13-12, 11, 10-9.5, 6.3-6.1, and 4.4 Ma; no
lami-nated diatom oozes were observed in sediments younger than 4.4 Ma (Kemp et al., this volume). The cessation of the preservation of LDO beds in the sediments of the eastern equatorial Pacific appears coin-cident with the final stages of the closing of the Isthmus of Panama (Keigwin, 1982a, 1982b) and with a shift in the locus of biogenous silica accumulation from the western sites of Leg 138 to the eastern ones (Farrell et al., this volume). The coincidence of these events supports the suggestion that mat formation is related to the formation of sharp east-west fronts (see below) and that the emergence of the Isthmus of Panama had a direct impact on the distribution of Oceano-graphic gradients in the eastern equatorial Pacific (see Pisias and Moore, this volume).
By analogy to recent findings of Rhizosolenia mats in the eastern equatorial Pacific by JGOFS workers (Barber, 1992), Kemp et al. (this volume) propose that the LDO deposits represent the fallout of large "mat-forming events" that can occur when a strong east-west frontal zone is developed (e.g., in response to a La Nina event). This phenomenon can occur over periods of years (resulting in millimeter-to centimeter-scale laminations), whereas decimeter-scale interbed-ding between LDO and nannofossil ooze may represent larger scale changes in circulation on time scales of hundreds to thousands of years. No evidence of reduced oxygenation of bottom waters has been found to be associated with the deposition of the LDO intervals. Instead, Kemp et al. (this volume) call upon the rapid deposition and extremely high tensile strength of the mats (making them virtually impenetrable to burrowers) to account for their preservation as lami-nated deposits, a result that may have important implications for the origin of other laminated sequences.
In some cases, individual LDO intervals can be correlated among sites over great distances. In a number of instances (in particular, 6.7-6.5 Ma, 6.1-5.9 Ma, and 4.8-4.5 Ma), regionally traceable seis-mic reflectors were found to correlate with the LDO intervals, imply-ing the potential to map the lateral extent of these events seismically. Intriguingly, in several cases, the reflectors associated with distinct LDO intervals at some sites can be traced to sites where T. longissima is present in burrow fills but not as discrete mats. This implies that, despite the incomplete preservation of LDO mats, the sediment that accumulates over the entire region at that time is distinct enough from the material above and below it to generate a seismic reflection (Bloomer et al., this volume).
It is particularly intriguing to note that two of the seismic reflectors associated with the presence of T. longissima mats in the eastern equatorial Pacific (4.8-4.5 and 6.1-5.9 Ma) appear to be synchronous (to the best of our ability to reconcile differing stratigraphic bases), with regionally traceable seismic reflectors in the central equatorial Pacific that have been tentatively associated with decreases in carbon-ate content resulting from dissolution (Mayer et al., 1986; Bloomer et al., this volume). Although it is possible that the carbonate contrasts causing the central equatorial Pacific reflectors are also the result of increases in productivity, it is also possible this apparent contradiction results from the response of the CCD to the regionally restricted but intense productivity events that may be responsible for the T. longis-sima mats. An increased flux of organic matter that is localized in the eastern equatorial Pacific would result in the massive outpouring of opal beneath the locus of mat production (probably associated with the position of a front; see Kemp et al., this volume) and, thus, extremely low carbonate contents due to dilution by silica. This is clearly a mechanism to make a reflector. Outside the locus of en-hanced opal deposition, steep gradients in the CCD (see Farrell et al., this volume), combined with a reduced flux of carbonate, would lead to enhanced dissolution of carbonate, which would also create a mechanism for reflector formation. Thus, we may have synchronous reflectors that are everywhere associated with low-carbonate content in the eastern equatorial Pacific. This low-carbonate content is a function of dilution, whereas in the deeper central equatorial Pacific (and off the equator), these low-carbonate intervals are associated with enhanced dissolution.
We now leap from the broad-based approach more typical of past ocean drilling legs to focus on several intervals and approaches that exemplify the potential of Leg 138 data. As we do so, we move forward in time, calling upon the increasingly high- resolution record to present an increasingly more detailed picture of the temporal and spatial variability of the eastern equatorial Pacific.
MIDDLE/LATE MIOCENE
CARBONATE TRANSITION
A major change in the nature of carbonate deposition in the eastern equatorial Pacific is recorded in the Leg 138 sedimentary records. Lyle et al. (this volume) and Farrell et al. (this volume) refer to this change as "the carbonate crash." As they demonstrate in their recon-structions of carbonate concentrations and mass accumulation rates (MAR), it is manifested by a very large decline in %CaCO3 and a
large decrease in carbonate mass accumulation rate, which is centered near the middle/late Miocene boundary (9.5 Ma). Spatially, carbonate sedimentation switched rapidly from a regime in which carbonate accumulation was evenly distributed throughout the eastern equato-rial Pacific to one in which carbonate deposition virtually ceased at all of the Leg 138 sites except two equatorial sites (850 and 851) in the westernmost of the Leg 138 transects (Lyle et al., this volume, fig. 9; Farrell et al., this volume, figs. 16-23).
Farrell et al. (this volume) present a detailed chronology of the "carbonate crash," demonstrating that it appears to have begun in the Guatemala Basin between 12.5 and 12 Ma. By 11.2 Ma, all Leg 138 sites show the effects of reduced carbonate sedimentation (though it is still most pronounced in the Guatemala Basin), followed by fluc-tuations between times of enhanced opal productivity and enhanced dissolution (as indicated by poor nannofossil preservations) that cul-minated in the most intense reduction in carbonate accumulation at 9.5 Ma. At the peak of the "crash," the CCD shoaled by almost 1000 m in much of the eastern equatorial Pacific (Lyle et al., this volume); and, as mentioned above, the deposition of carbonate virtually ceased at all Leg 138 sites with the exception of the equatorial Sites 850 and 851, which maintained carbonate MARs above 0.2 g/cm2.
Between about 9.4 and 7.5 Ma, a general resumption of carbonate sedimentation occurred in the region, with the exception of the Gua-temala and Peru basins, where the CCD remained between about 3400 and 3600 (and has remained there ever since), and where car-bonate is accumulating today only on shallow ridge flanks (Lyle et al., this volume). Superimposed on this trend of increasing carbonate accumulation are several brief intervals of reduced carbonate deposi-tion, much like the period leading up to the carbonate "crash." This transitional period led into the productivity-dominated late Miocene early Pliocene sedimentation rate maxima discussed below.
The decline in carbonate accumulation that dominates the eastern equatorial Pacific sedimentary record near the middle/late Miocene boundary is also seen in regions far beyond the eastern equatorial Pacific including the Atlantic (Berger, 1972). Theyer et al. (1985) and Mayer et al. (1985, 1986) correlated a middle/late Miocene carbonate low in the central equatorial with the "Mid-Epoch-10" carbonate event described by Vincent (1981) in both the Panama Basin and Hess Rise and with a Pacific-wide hiatus (or a time of reduced sedimenta-tion, such as during NH4) described by Barron et al. (1985). This carbonate low is expressed as a seismic reflector that can be traced over thousands of kilometers across the central equatorial Pacific (Mayer et al., 1985, 1986). Mosher et al. (1993) identified a reflector in the western equatorial Pacific that was tentatively correlated with this central equatorial reflector, and Bloomer et al. (this volume) were able to link this central equatorial Pacific reflector with a similar reflector in the eastern equatorial Pacific, which they correlated with the 9.5-Ma "carbonate crash."
Farrell et al. (this volume) further explore the regional extent of the "carbonate crash" by rationalizing the age models and correlating the carbonate records (converted to mass accumulation rate) from a
num-ber of central equatorial Pacific sites (RC12-65, RC12-66, DSDP Site 574) with those from Leg 138. During the period of the "carbonate crash," they found a close correspondence between the behaviors of carbonate accumulation in the central and eastern equatorial Pacific.
Not only was the middle/late Miocene carbonate decline far rang-ing in its effects, it also represents a major change in the nature of carbonate sedimentation in the eastern equatorial Pacific. Before the onset of this event, most equatorial Pacific sites show relatively con-sistent (high) values of both %CaCO3 and carbonate MAR (Mayer,
Theyer, et al., 1985; Farrell et al., this volume). In the eastern equato-rial Pacific, the major changes in carbonate content before the "crash" appear to be related to the outpouring of silica in the form of laminated diatom mats. After the "crash," both carbonate content and MAR in the eastern equatorial Pacific show large-amplitude variations that are the result of a complex interaction between surface- and deep-water processes, but which appear to be dominated by the surface-water processes (Hagelberg et al., this volume; Pisias and Moore, this vol-ume). As discussed below, the "carbonate crash" appears to be one of the few periods of time when eastern equatorial sedimentation was unequivocally dominated by deep-water processes.
Understanding variations in the carbonate record in terms of the relative contributions of dissolution and productivity is one of the more difficult challenges facing the student of equatorial paleo-ceanography. Nonetheless, Lyle et al. (this volume) and Farrell et al. (this volume) present cogent arguments for attributing the "carbonate crash" to enhanced dissolution associated with changes in bottom-water characteristics, rather than with changes in productivity. Al-though dissolution is difficult to quantify, a rudimentary nannofossil preservation index was constructed for the Leg 138 sites by Raffi and Flores (this volume) and was analyzed with respect to the carbonate record by Farrell et al. (this volume). Despite the poor resolution of the preservation index, only two time intervals clearly demonstrate poor nannofossil preservation and low nannofossil abundance, with the most pronounced dissolution occurring during the period of the "carbonate crash."
The association of the "carbonate crash" with enhanced dissolution does not, on its own, distinguish between surface- and deep-water processes for, as Emerson and Bender (1981) and Archer (1991a, 1991b) have demonstrated, under the proper conditions, increases in productivity can lead to enhanced dissolution through acids produced by the degradation of organic carbon. As Lyle et al. (this volume) demonstrate, however, a productivity increase of a factor of 8 (and an increase in Corg of 1 to 2 orders of magnitude) would be required to
produce the measured change in the CCD (based on the modern relationship between the CCD and productivity). Leg 138 shipboard measurements of Corg do not exhibit such an increase, but rather a
decrease in organic carbon at all sites except Site 846 (Mayer, Pisias, Janecek, et al., 1992; Lyle et al., this volume) during the period of the "carbonate crash." As further evidence for the absence of enhanced productivity, Farrell et al. (this volume) point out the anomalous lack of covariance between carbonate and opal MARs during the "carbon-ate crash" and the general lack of change in opal MAR from the levels preceding the "crash."
Given the rapid and wide-ranging decrease in carbonate accumu-lation that appears to be related to enhanced dissolution and is not associated with a major productivity increase, Lyle et al. (this volume) and Farrell et al. (this volume) explore various mechanisms that might account for the "crash." Noting the apparent correlation of the mid-dle/late Miocene carbonate decrease and a global drop in sea level (Barron et al., 1985;Haqetal., 1987), Lyle et al. (this volume) dismiss sea-level change as a potential cause because Peterson et al. (1992) showed that globally, the middle/late Miocene sea-level drop is asso-ciated with a deepening of the CCD and enhanced carbonate preser-vation, a relationship supported by Berger's (1970) model of basin-shelf fractionation. Instead, they call upon a rapid change in the chemistry of the deep waters of the eastern Pacific (decrease in [CO3]"2) and suggest two possible mechanisms—(1) the constriction
of the Panama Gateway or (2) the onset of North Atlantic Deep Water (NADW)—as the ultimate causative mechanisms.
When evaluating these two mechanisms, Lyle et al. (this volume) tend to favor the Panama Gateway mechanism, citing that the initia-tion of NADW should make global bottom waters less corrosive to carbonates, as NADW, with its high [CO3]"2, replaces the more
cor-rosive Antarctic Bottom Water. Although this may indeed be the ramification of the onset of NADW, Berger (1970) and Mayer et al. (1985) suggested that the initiation and increase of NADW flow would tend to suppress the upwelling of AABW in the south Atlantic and increase the flow of more corrosive AABW into the Pacific (basin-basin fractionation). Berger et al. (1993) elaborated on these arguments but tried to explain the chemical history of the western equatorial Pacific, calling NADW "the master modulator." Farrell et al. (this volume), however, take a detailed look at the history of NADW (converted to the Leg 138 time scale) and fail to find syn-chroneity between NADW behavior (as outlined by Bohrmann et al., 1990, and Wright et al., 1991, 1992) and the history of sedimentation in the eastern equatorial Pacific, though the ability to make such detailed temporal comparisons must be questioned.
Lyle et al. (this volume) favor the closing of the Panama Gateway (and the resulting decrease in the flow of high CO3]~2 water from the
Atlantic to the Pacific) as the mechanism responsible for the middle/ late Miocene "carbonate crash." In supporting this mechanism, Lyle et al. (this volume) cite the spatial pattern of the crash. They note that the eastern basins of the equatorial Pacific were most strongly affected (where the CCD never again deepened) and that if the "crash" were the result of NADW-induced changes in deep-water circulation, other parts of the Pacific should have been the most strongly affected. They also estimate that a restriction of flow from the Atlantic to the Pacific of only about 2 Sv is needed to produce the changes in carbonate preservation measured in the eastern equatorial Pacific. Farrell et al. (this volume) add support to Lyle et al.'s (this volume) suggestion by pointing out the apparent synchroneity between the carbonate history of the eastern equatorial Pacific and changes in the sill depth of the nascent Isthmus of Panama and the results of ocean models (Meier-Reimer et al., 1990; Mikolajewicz et al., 1993) that predict that deep water should have flowed from the Caribbean to the Pacific before the uplift of the isthmus.
The arguments presented above clearly indicate that the time around the middle/late Miocene boundary was one of major change for the eastern equatorial Pacific and, perhaps, for most of the ocean basins. Unlike many of the carbonate variations that precede and postdate it, the middle/late Miocene "carbonate crash" of the equatorial Pacific represents a major dissolution event. The changes in bottom-water chemistry associated with this event (or series of events) appear to be related to the early phases of the closing of the Panama Gateway. The role of NADW initiation and intensification in controlling car-bonate accumulation in the eastern equatorial Pacific is still not re-solved; however, as pointed out by Farrell et al. (this volume), the ocean modeling of Maier-Reimer et al. (1990) and Mikolajewicz et al. (1993) demonstrates that the closing of the Panama Gateway may also have had a direct influence on NADW production and, thus, the effects of both changes in Panama Gateway sill depth and the produc-tion of NADW may be manifested in the history of eastern equatorial Pacific sedimentation.
LATE MIOCENE-EARLY PLIOCENE
SEDIMENTATION RATE MAXIMA
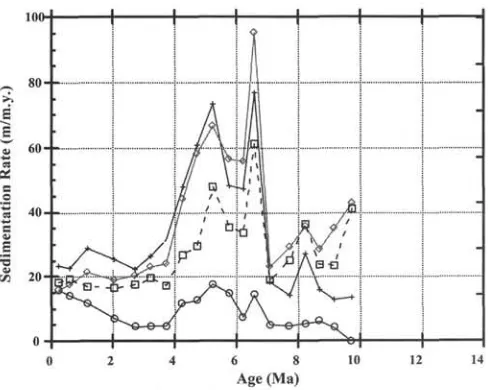
As discussed above, one of the most striking phenomenon of the late Miocene and early Pliocene is the extremely high biogenic sedi-ment accumulation rates at nearly all Leg 138 sites. In Figure 5, we show the sedimentation rates (in meters per million years) for all sites (except Guatemala Basin Sites 844 and 845) drilled during ODP Leg 115 and DSDP Leg 85. All sites, even sites from the western equato-rial Pacific and equatoequato-rial Indian Ocean, demonstrate high
accumula-tion rates between 3.5 and 6.5 Ma (Fig. 5). The sites from Leg 138, in which a high-resolution chronostratigraphy was based on the hypoth-esis of orbital tuning (Shackleton et al., this volume), show that this maximum starts at 6.5 Ma, with sedimentation rates returning to pre-6.5 Ma levels by 3.5 Ma (Fig. 5). During this maximum, sedimen-tation rates at the equator reach levels of nearly 100 m/m.y. and are nearly five times higher than sedimentation rates of the late Pliocene and Pleistocene. Integrated over the Leg 138 110°W transect is an approximately threefold increase in the total amount of sediment accumulation between the sedimentation rate maximum from 6.0 to 6.4 Ma, as compared to the 0- to 0.47-Ma intervals (Fig. 5). In the western Pacific, sedimentation rates change by a factor of 3 (Berger et al., 1993), indicating that this was at least an equatorial-wide change in sediment accumulation.
The high-resolution paleoceanographic studies from Leg 138 pro-vide some insights into how surface Oceanographic processes changed at the end of this sedimentation event. Eolian grain-size data from the late Miocene and early Pliocene suggest that the ITCZ was farther north than its present position and moved south of Site 853 (7°N) between 4 and 5 Ma (Hovan, this volume). The analysis of variation in carbonate deposition during the past 6 m.y. shows that the modes of variability within the equatorial Pacific were more zonal during the early Pliocene than in the later Pliocene and Pleistocene (Hagelberg et al., this volume).
Isotopic gradients, as determined by analyses of bulk carbonates, indicate a stronger north-south gradient across the equator before about 5 Ma. The gradient suggests a colder equatorial zone during the interval of high sedimentation consistent with what might be expected if equatorial circulation were intensified and more zonal (Shackleton et al., this volume). Thus, the available data suggest that during the maximum sedimentation rate intervals, equatorial circula-tion was more zonally aligned (i.e., contour patterns were much more parallel to the equator and the influence of the "Peru Current" is reduced) and more focused around the equator. This is further sup-ported by the north-south pattern in sedimentation rates during the time of maximum accumulation (Fig. 4). A similar conclusion was reached by Pisias and Prell (1985) on the basis of results from Leg 85 in the central equatorial Pacific combined with the synthesis of van Andel et al. (1975). Thus, we feel that it is reasonable to suggest that during the time of maximum accumulation, the circulation of the equatorial Pacific was much more symmetrical and focused at the equator that at present.
Was this change in surface circulation associated with increased productivity, or were the changes in calcium carbonate and biogenic silica accumulation a result of changing sediment preservation? To examine these questions, we first consider the present observed flux of calcium carbonate and biogenic silica in the equatorial Pacific. The maximum annual flux of calcium carbonate and opaline silica mea-sured by sediment traps from the equatorial Pacific range from 2.3 and 0.7 g/cm2/k.y. at traps deployed in 1991 at 140°W (JGOFS
tran-sect; Dymond, Collier, and Suess, written comm.) to an annual flux of 3.0 and 1.5 gm/cm2/k.y. measured at traps deployed during 1983
and 1984 at 139°W (Dymond and Collier, 1988). The JGOFS deploy-ment spanned the weak El Nino event of 1991, whereas the fluxes measured by Dymond and Collier (1988) are from a deployment the year after the major 1983 El Nino event. Based on the 2-yr deploy-ment of Dymond and Collier (1988), we assume that the 1984 data are a reasonable representation of non-El Nino sediment fluxes.
Unfortunately, we do not have sediment trap data from the area of the Leg 138 sites and, thus, we do not have a direct estimate of the gradients in particle fluxes along the equator. To evaluate possible primary fluxes at the Leg 138 transect, we took two approaches, one based on sediment accumulation gradients and the other based on gradients of primary productivity along the equator.
Sediment mass accumulation rates for calcium carbonate at equa-torial sites at 95°, 113°, 139°, and 140°W show few differences along the equator (Murray et al., this volume), whereas the accumulation of
biogenic opal increases by a factor of 2 between 140° and 110°W (Farrell et al. and Murray et al., both in this volume). If we take the observed pattern of opal accumulation to suggest an increase in the flux of both carbonate and opal between 140° and 110°W, then the lack of an accumulation rate gradient of calcium carbonate requires an east-west gradient in the preservation of calcium carbonate that exactly balances the increased flux of calcium carbonate. This would suggest better preservation of calcareous fossils to the west, which is not the general case. If we only allow opal flux to increase along the equator to account for the sediment accumulation patterns, then we require the rain ratio of carbonate and opal to decrease by a factor of 2 along this productivity gradient. Although possible, this inference is not consistent with changes in the ratio of carbonate and opal observed in sediment traps along a comparable productivity gradient. For the JGOFS 110°W transect, the ratio of carbonate to opal changes from about 2.5 to 3 over a fourfold change in total flux, with the highest ratios found at the highest flux equatorial site (Dymond, Collier, and Suess, written comm.). Finally, if there is little gradient in the particle flux of opal along the equator between the sediment trap sites and the Leg 138 transects, then this would require better opal preservation at 110°W vs. 140°W. Qualitatively, the radiolarian fauna tend to be better preserved in the eastern Pacific as compared to the central equatorial Pacific, which supports this inference.
The compilation of surface productivity estimates by Berger et al. (1987) shows that surface primary productivity changes between 110° and 140°W by a factor of 2 to 3. As summarized by Bishop (1989), several researchers (Suess, 1980; Betzer et al., 1984; Berger et al., 1987; Pace et al., 1987) have empirically related primary pro-ductivity to particle flux. With the exception of Betzer et al. (1984), these relationships show a linear change in particle flux with changes in primary productivity. Thus, based on the increase by a factor of 2 to 3 in primary productivity between 110° and 140°W, we assume a similar increase in particle fluxes. We must also assume that the relationship between carbon flux and opal and carbonate fluxes also is constant. This assumption is supported by the very high correlation between organic carbon flux and the sum of carbonate and biogenic fluxes in a wide range of sediment trap deployments (Fischer, 1984) and the relatively constant carbonate to opal ratios seen in equatorial Pacific traps. Thus, although these two lines of evidence (sedimenta-tion accumula(sedimenta-tion rate patterns and changes in surface primary pro-ductivity) are not conclusive, taken together we suggest that the factor of 2 increase in sediment flux at 110°W (as compared to 140°W) would not be unreasonable.
Based on these assumptions, we would estimate the modern-day particle flux of carbonate and opal at the equator and 110°W to be about 6 and 3 g/cm2/k.y., respectively. Compared with recent sedi-ment accumulation rates at Site 849, this would suggest that about 30% of the calcium carbonate rain and about 7% of the opal rain is preserved in the sediments. During the time of maximum sediment accumulation at Site 849, carbonate and opal fluxes were 4.5 and 0.8 g/cπr/k.y. (Farrell et al., this volume), which would require preserva-tion of 75% of the carbonate rain and more than 26% of the opal rain if surface production remained constant. Indicators of nannofossil dissolution do not support this inference. In general, dissolution was higher at Site 849 during the interval of high accumulation rates as compared to the lower sedimentation rate intervals before and after the event (Farrell et al., this volume). Thus, although our estimated modern particle flux could sustain the high sedimentation rates of the latest Miocene and early Pliocene, the evidence strongly suggests that the changes in Oceanographic circulation pattern inferred from the Leg 138 data also were accompanied by higher production in the eastern equatorial Pacific.
It is tempting to speculate that the transition from the interval of high sedimentation rates, with the proposed changes in surface circu-lation, is related to the closing of the oceanic connection between the tropical Pacific and Atlantic. Unfortunately, modeling results do not provide evidence that the closing of the Panamanian Isthmus would
100
6 8
Age (Ma)
Figure 5. Sedimentation rate curves for the eastern equatorial Pacific. Site 848 = open circles, Site 849 = plus signs, Site 850 = open diamonds, and Site 851 = open squares.
produce such a change in surface circulation (Maier-Reimer et al., 1990; Mikolajewicz et al, 1993). Indeed, the models predict little change in surface circulation associated with an open or closed isth-mus. However, one important weakness of these models is that pres-ent-day atmospheric forcing is imposed on the model ocean. Thus, the effect of a more northerly position of the ITCZ is not accounted for in these model results.
Although it is tempting to invoke a closing of the Panamanian Seaway as an explanation for the reduction in sediment accumulation during the early Pliocene and associated changes in patterns of sur-face ocean circulation, this does not help explain the onset of the sediment accumulation rate maximum at 6.5 Ma. Unfortunately, the high-resolution studies produced to date from Leg 138 drill sites do not provide insights as to the potential Oceanographic changes asso-ciated with the onset of the high sediment accumulation rate of the latest Miocene and early Pliocene.
To address the dilemma posed by the mid-Neogene accumulation rate maximum, we must also consider sediment accumulation on a more global basis. As shown in Figure 5, the accumulation rate maximum is not unique to the eastern equatorial Pacific. Maximum accumulation rates in carbonate sediments are seen in the western equatorial Pacific and in the equatorial Indian Ocean. Recent drilling results from Leg 145 show that, during the mid-Neogene, opal accu-mulation rates were much higher in the North Pacific than at present (Rea and Basov et al., 1991) and that maximum sedimentation rates are found in the South Atlantic. Clearly, this event is not unique to the eastern equatorial Pacific.
If this event is global and involves both increased biogenic silica and carbonate burial, then either the net flux of Ca and Si to the ocean must have increased during this time or an as yet-undefined oceanic sink must not have been active during the mid-Neogene. In the absence of evidence for another oceanic sink, we propose that during the mid-Neogene the chemical flux into the ocean was elevated above present-day levels. The evidence for enhanced oceanic productivity in the equatorial Pacific would be supported by increase fluxes of phosphorous (Filipelli and Delany, this volume) and other nutrients, along with the fluxes of Ca and Si.
A similar hypothesis of enhanced dissolved flux to the ocean during the Neogene comes from studies of the evolution of the Indian Ocean Monsoon and its relationship to the uplift of Tibet and the Himalayas. The onset of the Indian Monsoon, based on marine and continental records, took place during the latest Miocene at about 6-7