http://www.sciencepublishinggroup.com/j/aap doi: 10.11648/j.aap.20180301.13
ISSN: 2471-9692 (Print); ISSN: 2471-9714 (Online)
Specific Features of Perception of Semantically Equivalent
Stimuli in the Verbal and Visual Form
Valery Nikolaevich Kiroy, Yelena Vlasovna Aslanyan, Dmitry Mikhailovich Lazurenko,
Oleg Marksovich Bakhtin
The Center of Neurotechnologies, Southern Federal University, Rostov-on-Don, Russia
Email address:
To cite this article:
Valery Nikolaevich Kiroy, Yelena Vlasovna Aslanyan, Dmitry Mikhailovich Lazurenko, Oleg Marksovich Bakhtin. Specific Features of Perception of Semantically Equivalent Stimuli in the Verbal and Visual Form. Advances in Applied Physiology.
Vol. 3, No. 1, 2018, pp. 14-25. doi: 10.11648/j.aap.20180301.13
Received: May 21, 2018; Accepted: June 6, 2018; Published: July 6, 2018
Abstract:
Response time and evoked potentials were registered for visual images related to two categories fruit and tableware as well as their verbal representations. The stimuli were presented randomly. The subjects were to attribute them regardless of the form (a word or image) to one of the categories. 11 female and 10 male subjects (average age 21.9±2.9 years) participated in the tests. 6 components of the evoked potentials were singled out: Р1 (Р66), N1 (N124), Р2 (Р180), N2 (N248), Р3 (Р331) and N3 (N456). Analysis showed that both female and male subjects demonstrated reliably longer response time for words as compared to those for corresponding images. For words, evoked potentials were registered in more complex configurations and with a shorter latency period for the early components (P1, N1) and longer latency period for the late ones (P2, N2, P3, N3). The evoked potential amplitude in response to verbal stimuli was smaller than that for visual ones. Evoked potential components in response to target stimuli (both images and words) had, in general, shorter latency. The amplitude of N1, Р2 and N2 components was lower, while that of P3 and N3 was higher for target stimuli rather than a non-target. The obtained results allow us to assume that evaluation of the type of information (verbal or visual) can be performed on early stages of stimulus perception (up to 120-150 ms). Further analysis includes either more detailed description of spatial features of the visual stimuli in parietal and occipital lobes or estimation of the semantics of a word employing the frontal and temporal areas. Decision-making on formulating a response barely depends on the manner of information presentation (visual and verbal).Keywords:
Visual Stimuli, Verbal Stimuli, EP Components, Response Time, Gender-Related Differences1. Introduction
One of the key properties of thinking is the ability forming a concept of the environment in the form of mental representation. Over the lifetime, a human learns to manipulate both visual and verbal information with equal success and creates the mental representation using different types of external events. Theoretically, there exist at least 3 ways to form mental representations: (1) dependent on the type of external stimuli and the objectives (visual representations for visual information, verbal - for words,
etc.); (2) independent on external impact (visual
representations for visual information, verbal ones for words etc.); (3) with a universal code when all representations are
presented only in the verbal form.
Forming mental representations begins with the process of perception, which is being explored in a vast variety of experimental studies. As a rule, those involve the evoked and event-related potentials' method [1-5]. Alongside it, other methods are used, such as calculating the dipole source localization method [6, 7], FMRI [8-10] and others.
from them even applying various methods of averaging. The nature of this variation is still uncovered incompletely. One of the assumption is that the nervous system at different levels of its organization may be not in one but in two and more stable states (i.e. it is characterized by bi- and even multi-stability). The transitions between these states occur under the influence of various internal and external factors.
The presence of these states was demonstrated
experimentally at the level of single neurons and their local groups [11-13], the brain as a whole [14, 15] as well as on neural network models [16, 17]. There is a reason to believe that multi-stability is one of the fundamental properties of the nervous system and can come out on any level of its organization and during any perception and cognitive process. The limitations of understanding the concept of multi-stability today are the absence of a strict criteria of its identification, and the dependence of the activity variability on the number of factors on any level of CNS organization.
In this respect, the process of perception, particularly that of ambiguous visual images, is of great interest. Attempts to study mechanisms and to create mathematical models demonstrating multi-stability have taken place [18, 19]. However, information recognition and categorization in this context have barely been studied. In our opinion, one of the ways to investigate the multistability is the study of electrographic representations of perception features on semantically equivalent objects presented in the form of visual images and words. This approach would allow us to answer a number of questions: if the manner of information presentation affects the speed and quality of its recognition; if the activity patterns formed in the cortex during recognition of visual information are different from those formed during recognition of verbal information; what brain structures participate in this process; how it is reflected in the parameters of the brain's evoked activity; etc.
The objective of the current study was to explore the behavioral (response time) and electrographic (evoked brain activity parameters) phenomena lined to perceiving semantically equivalent objects presented in the visual and verbal form.
2. Research Method
2.1. Subjects
The research was conducted on 21 subjects (11 females and 10 males) – students of various higher educational institutions of Rostov-on-Don, Russia. The average age of the subjects was 21.9±2.9 years. All of them confirmed their voluntary commitment to participate in the study in writing, as prescribed by the sanding order issued by the SFedU Commission on Bioethics.
2.2. Stimulation
The tests were conducted in a light and a soundproof chamber during daytime (mostly before noon). During the testing, subjects were seated in an armchair in a comfortable
position. The stimuli were being shown on an LCD monitor located on the same level as the subject's eyes in the distance of 1 meter. To form a response, one of the buttons on the computer mouse was utilized. The hand, the button and the manner of pushing it were chosen by the subject based on their convenience.
The visual stimuli presented in the form of gray level images appeared in the center of the screen on white background. As stimuli, 6 images were used, each related to one of the two categories: fruit (an apple, a pear, a lemon) and tableware (a glass, a spoon, a plate), and 6 words used to denote these objects. The images were presented in the size of 4x10 arc degrees. All the images were brought into conformity in terms of size and color. They were presented in a random sequence, each exposed for 300 ms with a 2-sec interval between the stimuli. In order to fix the sight in the center of the screen, a 2x2 cm gray cross was presented between the stimuli.
2.3. Tasks
The study comprised 2 series with different target stimuli. In the first series, the subject was supposed to respond as quickly as possible to the image or the word related to the category 'fruit'; in the second one - to 'tableware'. Hence, each stimulus presented could be the target as well as indifferent (non-target). The response time (RT) was registered for the target stimuli. The duration of the study did not exceed 45 min during which 760 stimuli were presented. Each series was preceded by guidelines for the subjects in which they were informed of the random character of the presented stimuli, the actions to be taken once the stimuli appeared. They were also instructed to respond as quickly as possible.
2.4. Data Acquisition
EEG was registered with the use of multi-channel amplifier Neurobotics (Russia) on 14 electrodes (F3, F4, F7, F8, С3, С4, Т3, Т4, Т5, Т6, Р3, Р4, О1, О2), monopolar, according to the System 10x20 (linked ear reference). Amplifiers' passband was 0.5-100 Hz, sample rate - 1000 Hz, a notch filter of 50 Hz was used.
2.5. Signal Analysis
necessary considering the significant difference between the EP characteristics registered on different electrodes [1, 20] and others. The temporary mismatch of the EP
components in different electrodes was obtained (dark areas in Figure 1).
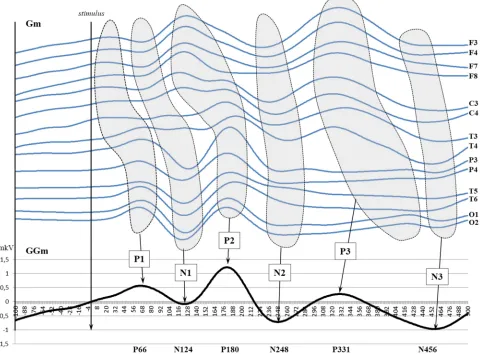
Figure 1. Schematic representation of EP components. GM - Great mean, GGM - General Great mean. Components: P1, N1, P2, N2, P3, N3. Number of EEG channels – 14.
Therefore, after the centering main components were singled out in GGM. These components were further identified on GM and in individual EP using original software developed in the laboratory (lead programmer - K. B. Kalinin). Time windows in which the components search was carried out were defined individually for each electrode.
During the preliminary GGM analysis, 6 main components were singled out, i.e. Р1 or Р66, N1 or N124, Р2 or Р180, N2 or N248, Р3 or Р331 and N3 or N456. The corresponding time windows estimated by GM were 18÷71 ms (for Р1), 33÷131 ms (N1), 103÷193 ms (Р2), 120÷263 ms (N2), 284÷422 ms (Р3) and 314÷492 ms (N3). Within each of the aforementioned time windows for EP in response to each type of stimuli with each subject on each electrode, one peak with max positive (P) or negative (N) amplitude was singled out. For each of those peaks, the latency period (LP) was detected. To estimate the wave structure of the evoked response, the overall quantity of extrema (QE) was counted, regardless of their polarity, amplitude and latency period.
Statistical evaluation of amplitude and LP for the EP
components was carried out via ANOVA/MANOVA (with repeated measures, RP). Individual EP were grouped together with the consideration of the following factors: TYPE of stimulus (levels: image (I) and word (W)); GROUP (levels: target (T) and non-target (NT) stimuli); COMPONENTS (R1, 84 dependent variables: 6 components × 14 electrodes). The values of amplitudes (modules), latency periods and components as well as the complexity of the EP were analyzed separately. The stimuli referring to the categories fruit and tableware would unite, that's why the influence of the factor CATEGORY was not analyzed in this article. The RT values were analyzed using the same method with the consideration of such factors as GENDER and TYPE of stimulus.
3. Results
The analysis has shown that EP for the verbal stimuli was
more reliable than that for the visual ones for both female and male subjects (Table 1). No gender differences in both visual and verbal stimuli were detected.
Table 1. The results of comparative analysis on EP values for visual and verbal stimuli registered in different gender groups (Only main effects listed).
Difference between the type of stimulus
Gender Df F p % Av. RT ± St. dev.
Image Word
Total 1. 334 150.42 0.00 27.45 357.0±4.1 432.5±5.5
Female 1. 174 86.10 0.00 29.24 352.0±5.3 430.9±6.6
Male 1. 158 64.49 0.00 25.55 362.5±5.6 434.1±7.0
Gender differences (F-M)
Type of stimulus Df F p % Av. RT ± St. dev.
Female Male
Image 1. 268 1.68 0.20 2.98 352.0±5.3 362.5±5.3
Word 1. 244 0.87 0.35 0.74 430.9±6.6 434.1±7.0
Designations: Df (effect, error) - degrees of freedom, F - F-test, p - significance level,% - difference between RT for words and that for images; in bold are reliable differences (р<0,05); Av. RT - average response time; St. dev. – Standard deviation.
The analysis of the LP and amplitude of EP components registered in the 2 series of experiments has shown that there are significant differences in all 3 factors: TYPE of stimulus (image and word), GROUP (target and non-target) and COMPONENTS (R1) (Table 2). The target stimulus was more substantial influence on the LP of the components of the EP (reliable Type×Group - Interaction) than on the amplitude of components.
Comparative analysis of EP components in response to visual and verbal stimuli (factor: TYPE) disclosed that reliable differences take place for LP of the following components: P1, N1, N2, P3; and amplitude of the components: P1, P2, P3, N3 (Table 2). If the amplitude values of all the listed EP components registered in response
to verbal stimuli were lower than those registered for images, the LP values were multidirectional. Amplitude detailed approach to the listed differences employing single factor analysis (breakdown & one-way ANOVA) proved (Table 2, I-W) that the LP for the early EP components (P1, N1) for verbal stimuli was shorter (especially, in the left hemisphere), and for the later ones (N2, P3) - shorter on the back and longer - on the frontal electrodes. The amplitude of the P1, Р2 and N2 EP components registered for verbal stimuli was lower mostly on the occipital electrodes, for N1 and P3 – on the frontal, and for N3 – on all electrodes. In the EP registered on the front (frontal, temporal and central) electrodes for verbal stimuli. The amplitude of the P1 and N2 components was, on the contrary, higher.
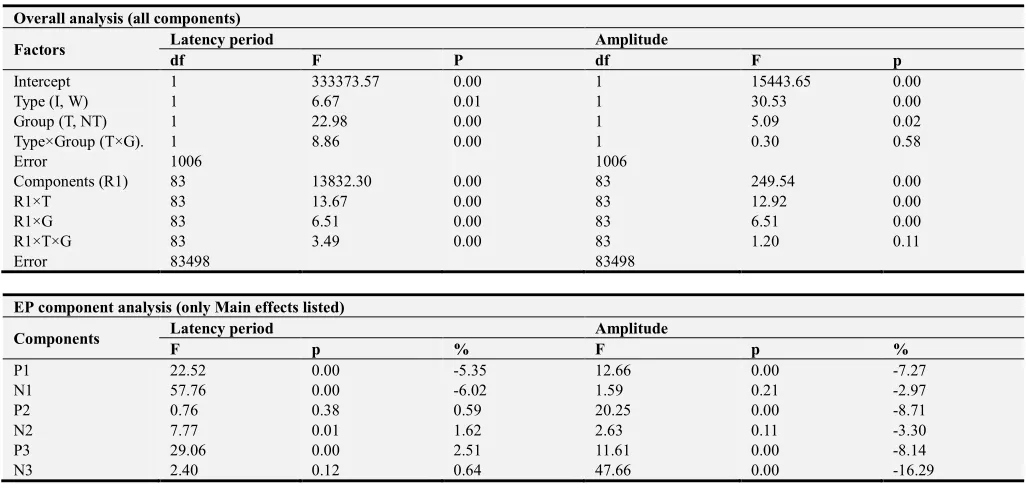
Table 2. The results of overall and component-based MANOVA on the EP parameters registered for visual and verbal stimuli (comparing I-W).
Overall analysis (all components)
Factors Latency period Amplitude
df F P df F p
Intercept 1 333373.57 0.00 1 15443.65 0.00
Type (I, W) 1 6.67 0.01 1 30.53 0.00
Group (T, NT) 1 22.98 0.00 1 5.09 0.02
Type×Group (T×G). 1 8.86 0.00 1 0.30 0.58
Error 1006 1006
Components (R1) 83 13832.30 0.00 83 249.54 0.00
R1×T 83 13.67 0.00 83 12.92 0.00
R1×G 83 6.51 0.00 83 6.51 0.00
R1×T×G 83 3.49 0.00 83 1.20 0.11
Error 83498 83498
EP component analysis (only Main effects listed)
Components Latency period Amplitude
F p % F p %
P1 22.52 0.00 -5.35 12.66 0.00 -7.27
N1 57.76 0.00 -6.02 1.59 0.21 -2.97
P2 0.76 0.38 0.59 20.25 0.00 -8.71
N2 7.77 0.01 1.62 2.63 0.11 -3.30
P3 29.06 0.00 2.51 11.61 0.00 -8.14
N3 2.40 0.12 0.64 47.66 0.00 -16.29
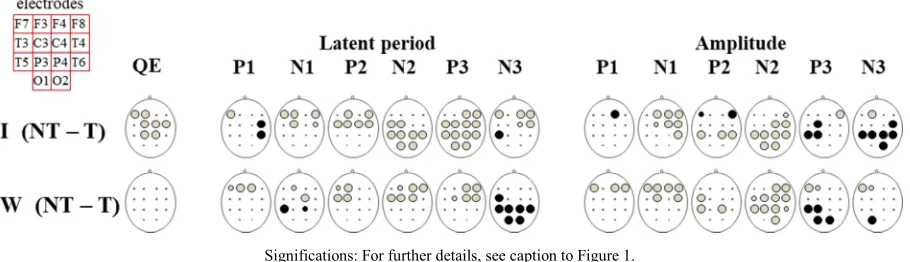
Significations: dark circles – LP (A) for I<W, light circles – LP (A) for I>W, large ones - reliable (p<0.05), small ones - trend (0.05<p<0.08).
Figure 2. The results of comparative analysis on the EP complexity (QE), latency and amplitude values of EP components registered in response to verbal stimuli as compared to those registered in response to visual stimuli for all (I-W), only non-target stimuli (NT) and only target stimuli (T).
EP in response to verbal stimuli had a substantially more complex wave structure than that in response to the semantically equivalent visual images. The quantity of extremes of EP in response to verbal stimuli was significantly higher than that for visual stimuli (FI-W (1;
1006)=33.64, p=0.000). This ratio was observed on all
electrodes, but it was most obvious in the occipital areas (Figure 2).
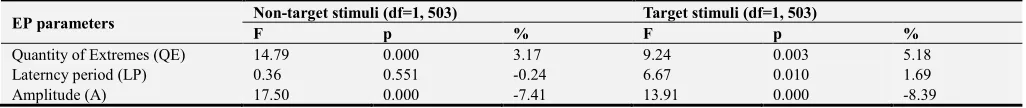
The comparative analysis on the EP characteristics of visual and verbal stimuli considering the factor GROUP has shown that reliable differences take place on the level of the main effects in almost all the factors (QE, LP, A) (Table 3).
Table 3. The results of MANOVA on EP parameters in response to target and non-target visual and verbal stimuli (comparing I-W, main effects only).
EP parameters Non-target stimuli (df=1, 503) Target stimuli (df=1, 503)
F p % F p %
Quantity of Extremes (QE) 14.79 0.000 3.17 9.24 0.003 5.18
Laterncy period (LP) 0.36 0.551 -0.24 6.67 0.010 1.69
Amplitude (А) 17.50 0.000 -7.41 13.91 0.000 -8.39
Significations: for further details, see caption to Table 1.
The single-factor analysis (One-way ANOVA) has shown (Figure 2, NT, T) that the differences in the EP parameters in response to words - as compared to those for images - largely coincided for target and indifferent stimuli. LP of the early (P1, N1) EP components in response to both target and non-target verbal stimuli were shorter than those for visual stimuli. LP of the EP components N2, P3 and N3 registered for target verbal stimuli were larger than those for visual stimuli. LP of the EP components N2 and P3 in response to indifferent verbal stimuli were also longer in the frontal areas, and in the rear, on the contrary, were shorter than those for visual stimuli. The weak differences between the LP values for the P2 components were shown.
The amplitudes of the EP components in response to verbal stimuli were, in general, lower than those for visual stimuli, regardless of their significance. Only the EP components P1 and N2 in response to verbal stimuli had the higher amplitude in the frontal areas.
EP in response to verbal stimuli would have a more complex wave structure than that in response to visual
stimuli in all cases, and to the target stimuli, the differences would be more substantial than for the indifferent ones.
Significations: For further details, see caption to Figure 1.
Figure 3. Graphic representation of the comparative analysis of the EP characteristics related to target visual stimuli (compared to non-target).
4. Discussion
In literature, there are data pointing out the presence [21, 22] as well as the absence [23-25] of gender differences in the efficiency of the activity linked to operating with words and images. We couldn't disclose any gender differences in the response time for visual and verbal stimuli while attributing them to different categories. On the base of this fact, all subjects were used for further analysis.
All the stimuli (both verbal and visual ones) were presented in the form of visual images having equivalent physical parameters (size, exposing time, color solution). Each of them was presented multiple times, which practically excluded the necessity to read the words or search for further detailed differences in order to identify the image. It is known that word identification can be carried out during 250 ms [26]. Words that come up frequently and are analyzed as images can be identified during 200-ms interval, presumably, due to the formation of more efficient neural networks [27, 28]. However, despite the fact that due to multiple presentations, verbal stimuli are being perceived as visual ones (gestalts), the responses registered upon their presentations would have reliably higher values of latency periods compared with those registered for semantically equivalent visual stimuli. This points to the fact that semantically equivalent constructions presented in visual and verbal forms are, apparently, perceived and processed by the nervous system in a different way, the analysis of verbal stimuli demanding more time.
A number of cognitive memory theories suggest that visual and verbal information are stored separately. They also suppose that the images are not stored as separate objects, but as prototypes [29, 30] representing the most characteristic features of all the objects within the class. The information received during image perception is formalized, but not transformed into a verbal construct. An experiment following the suggestion that images have a spatial status has shown [31, 32] that visual representations are demonstrative although in some cases their propositional representation typical for representing words is possible. Then, the concept of double-coding [33, 34] suggests the existence of two data processing systems interacting with each other. Within each system, there are three levels of processing visual (in the
terms of the author, images) or verbal (logogens) information, and the transition from the lower level to a higher one entails generalization of that information.
Thus, almost every case suggests two different processing mechanisms providing visual and verbal perception and information analysis.
Compared with visual stimuli, verbal ones contained a numberof elements. It was shown [35] that perception better structured visual stimuli comprised of multiple different elements were connected to the severity increasing in the EP of the later components (P180-230 and N230-260) and decreasing in the earlier ones. However, as shown in our research, the amplitude is lower for almost every EP component in response to verbal stimuli compared with that for visual ones. The only exceptions were P1 and N2 in the EP registered on the front electrodes while perceiving verbal stimuli (especially for the indifferent) with higher amplitude than that for visual stimuli. The LP of the early EP components for verbal stimuli was shorter and for the later components - longer than that for the corresponding images. All of these point to the fact that longer response time for verbal stimuli and the EP differences are more likely to be defined not by the complexity of the visual stimuli, but by the differences in the mechanisms of processing information presented in the verbal and visual form. Similar results were received while studying the visual EP registered for the letter-based (verbal) and symbol-based (pictograms, i.e. images) stimuli [4]. In this study, 7 subjects out of 9 showed higher amplitudes for the later components (P3 and N4) while being presented symbol matrices rather than the letter. LP for the EP components N1 and P3a registered for symbolic matrices was shorter than that for letter ones, while that for the components P3b and N4 was, on the contrary, longer.
According to the obtained results, under categorizing verbal stimuli, compared with the semantically equivalent visual stimuli, the EP was registered in which: (1) the earlier (P1, N1) components have shorter, and (2) middle and later (P2, N2, P3 and N3) components - longer LP; (3) amplitude for the RP components is lower and (4) their structure is more complex.
non-target) - enables us to suppose that sensory analysis of the stimulus involving type detection (visual/verbal) takes place as early as the first 120-150 ms after presented. The recognition of the known verbal stimuli happens quicker than that of the semantically equivalent visual stimuli. A number of researchers have also shown that the identification of the well-known words can be carried out within 100 and even 40 ms after they are presented [36, 37].
LP for later (especially N2 and P3) EP components registered on the front (frontal and temporal) cortex lobes for verbal stimuli would be longer than that for visual stimuli; those differences did not depend on the significance of the stimulus. The differences in EP registered for indifferent stimuli of different types (images and words) on the frontal areas were observed in the complex P2-N2-P3 (i.e. within the interval of 200-350 ms) while that for the significant one - N2-P3-N3 (300-500 ms) (Figure 2).
The N2 component registered in the frontal association cortex is being connected to the mechanisms of cognitive control, including suppression of inadequate reactions and choosing the correct decision out of the possible options [38, 39], monitoring the corresponding events to the objective of the cognitive task being carried out [40, 41]. The P3 component registered in the same areas is being associated with operations on comparing the incoming information to the inner model of the stimulus and decision whether they are identical or not [42, 43]. It is also supposed that the frontal areas of the cortex are connected with the operative memory mechanisms [44, 45] and are responsible for evaluating the significance of verbal and non-verbal stimuli depending on the context and past experience [46, 47]. The activation of those areas associated with verbal thinking (starting with analyzing letters and up to pronounce words mentally) was demonstrated, in particular, by fMRI [9, 48]. This allows us to suggest that unlike sensory, semantic word analysis with further attributing them to a corresponding category has a wider flow, hence, demands more time than the analysis of equivalent images. Longer LP of the later EP components is an evidence. These differences do not depend on the stimulus significance, and largely define the RT for the target verbal stimuli.
Unlike the frontal cortex, the difference in the LP of the later EP components in the temporal and occipital areas registered for stimuli of different types would depend on factor GROUP, which is explained by a significant Type×Group interaction. (see Figure 2). While perceiving indifferent stimuli the LPs of EPs registered in the TPO (temporal-parietal-occipital) areas of the cortex were shorter for the verbal stimuli than for the visual ones; while perceiving significant stimuli, the corresponding LPs were longer. In the former case (non-target stimuli) the differences in higher severity are observed for components N2 and P3, while in the latter case (target stimuli) – for P3 and N3. It should be noted that the component N3 would develop almost immediately after the response of pressing the button. The results are imagined to indicate that under categorization there are differences in the mechanisms of visual and verbal
information perception (both target and indifferent stimuli). Unlike the P3 component which is associated with the process of retrieving engrams out of the memory, comparing the current information in the memory and making a decision [1, 42, 43], the component N3 is associated with the final stages of semantic analysis, detecting the contextual connections of words within a sentence, letters within a word, parts within an image etc. [49]. The obtained results allow us to make the following conclusion: after the type identification (visual/verbal) stage performed within the first 120-150 ms, further analysis of the verbal stimuli goes as the analysis of semantic categories employing predominantly the front (association) areas of the cortex. This supposition goes along the predictive coding model [50, 51] according to which a wholesome concept of an image is formed at higher levels of analysis hierarchy, in the association and prediction areas of the cortex [52, 53]. During that time, the activity of the neural systems of lower (sensory) analysis levels decreases.
'Recognition' of the visual stimuli demands a more detailed description of the image's physical characteristics. Longer (compared with those for verbal stimuli) LP of the early EP components are indicative of that. Further semantic analysis and categorization would employ predominantly the
parietal-occipital lobes associated with evaluating spatial
characteristics of visual images [54, 55, 56]. These areas supposedly also participate in top-down control and organization of relevant object search in the memory [57, 58]. Semantic analysis of a visual stimulus is, apparently, over by that time, which explains the shorter LP for the components N2 and P3 in the EP registered on the front areas of the cortex. The analysis of verbal stimuli (unlike that of the visual ones), apparently, did not end in a response. That is indicated, in particular, by a severe component N3 for which the LP was longer than the average response time for verbal stimuli. In literature, it is pointed out that this component registered in the EEG of the temporal and parietal lobes of the cortex is linked to the checking of the decision correctness [59, 60]. During the word operations, the latter may have a wider flow, which could be extended after the decision of attributing the image to a certain category has been made.
conclusion. For example, the amplitude was lower for almost all the EP components in response to verbal stimuli
compared with semantic equivalent visual stimuli,
particularly for the target ones. This could indicate that words are more complex stimuli to detect than images. Only while perceiving non-target stimuli, the amplitude of the N2 EP component registered for verbal stimuli was higher than for visual ones. As it was already mentioned, the N2 component is associated with suppressing inadequate reactions and choosing the correct option [38, 67] as well as evaluating the correspondence of the current events to the cognitive task being carried out [40, 68]. The latter is most likely to explain that the listed processes have higher significance for categorizing images rather than words.
It is well known that an increase in the amplitude of the focal potentials reflects, first of all, activity synchronization in the population of neurons. There is a reason to suppose [62, 69, 70] that this synchronization may be regulated by various mechanisms and reflects various states of this population. On the one hand, increasing amplitude of the evoked responses, first of all, in the primary projection areas of the cortex alongside increasing intensity of the active stimulus may be connected to a stronger afferent flow and reflects the involving of more neurons in the activity, the neurons' synchronization being provided by the flow. On the other hand, non-specific systems could have a synchronizing effect by providing a transition from a more active wakefulness to a less active one, up to somnolence and sleep. Such effects can cause neuron populations to aggregate into larger units through activity synchronization, as a rule, in the lower frequency range. Besides that, synchronized activity in local neuron populations (neural ensembles) may be caused by an increase in specific informational processes in them that are reflected in forming high-frequency gamma-oscillations [71, 72].
Thus, synchronized neural activity and, consequently, increased amplitude of the focal potentials can, apparently, reflect both an increase and a decrease in their activity, both functional mobilization and immobilization. The frequency of the appearing oscillations is of major significance and is, as a rule, inversely proportional to the amplitude of the registered potentials.
The recognition of visual stimuli depends on their physical characteristics [73, 74], attention organization devoted to their sensory analysis [75, 76], sensory differentiation of visual objects [77, 78], interaction of attention and perception [79, 80] that are reflected in amplitude and LP of the early (P1 and N1, in particular) EP components. There is, however, an evidence proving that the parameters of the visual stimulus, in particular, its intensity, have a crucial influence on the EP configuration in general [81]. Our results indicate that categorizing the visual word stimuli is a more active process as compared with categorizing the semantically equivalent image stimuli. It employs more stages of information processing, and it runs alongside not just a decrease in amplitude compared to the analysis of semantically equivalent visual stimuli, but also an increase in
the configuration of the EP. The latter appears to prove that higher frequencies appear on the EP, and they reflect the functioning more local neuron populations that form asynchronous (successive) activity patterns.
Finally, the differences between the EP parameters registered for indifferent and target stimuli were barely
dependent on the type of information presented
(visual/verbal). For the significant stimuli, in both cases, an EP with shorter LP, the lower amplitude for the front area P1-N2 complex components were registered. On the contrary, the amplitude for the P3-N3 (especially those registered in the back areas) for the target stimuli was higher than for the indifferent, but they were registered after the response. (see Figure 3). It is reasonable to suppose that in the current experimental paradigm with the fastest possible reaction to a target stimulus in a multiple-choice situation, regardless of the type of presenting information, what is crucial for categorization is detecting key features in the stimuli. A quick detection of those is enough to make a decision on forming a response and 'reduction' the further analysis. This decreases the analysis time for the stimuli. Shorter LP for the most of EP components registered for significant stimuli of both types is indicative of that. The increase of amplitude for components P3 and N3 can be explained by more attention concentrated on carrying out the next task [82, 83, 84, 85], by 'turning off' the neural populations unemployed in this task by synchronization of their activity.
Thus, the results obtained in our work indicate that classifying the visual stimuli and detecting their type (verbal/visual) is carried out in the early stages of perception (up to 120-150 ms). Further on, either more detailed analysis of their spatial characteristics (for visual stimuli) employing predominantly the back (parietal-occipital) areas of the cortex, semantic analysis (for word stimuli) employing predominantly the front (frontal and temporal) areas is carried out. Detecting the group of the stimulus (target/non-target) and making a decision on forming a motor response is barely dependent on the information type (verbal/visual), and employs the front areas of the cortex. This all points to the existence of at least two mechanisms underlying visual recognition in which top-down and bottom-up influences are used in different proportions. This, in its turns, suggests at least two stable states in the functioning visual information semantic analysis system.
5. Conclusion
1. It was experimentally shown that categorizing speed of verbal and visual stimuli does not depend on gender. Under categorization, the response time for word stimuli in reliably longer than that for the semantically equivalent image stimuli.
3. Detecting the type of information (verbal/visual) under categorizing occurs in the early stages of their perception (up to 120-150 ms). Further analysis includes either a more detailed description of their spatial characteristics (for images) employing the back (parietal-occipital) areas, or detecting the semantic definition (for words) involving the front (frontal and temporal) areas of the cortex, predominantly in the left hemisphere.
4. For target stimuli (both images and words) under categorization the EP is registered with shorter latency periods and lower amplitudes of the components within the P1-N2 complex. These differences are the most pronounced in EP registered mainly on the front electrodes which indicate their participation in making the decision on the forming a response.
The current research is carried out in the framework of the basic part of the state task MES № 6.5961.2017/8.9
References
[1] Beteleva, T. G., & Sinitsyn, S. V. (2008). Event-related potentials at different stages of the operation of visual working memory. Human Physiology, 34 (3), 265. DOI: 10.1134/S0362119708030018.
[2] Mar'ina, I. V., & Strelets, V. B. (2010). Verbal stimuli semantics and relevance of ERPs. Zhurnal vysshei nervnoi deiatelnosti imeni IP Pavlova, 60 (1), 22-31.
[3] Ganin, I. P., & AIa, K. (2014). The P300-based brain-computer interface: presentation of the complex" flash+ movement" stimuli. Zhurnal vysshei nervnoi deiatelnosti imeni IP Pavlova, 64 (1), 32-40. DOI: 10.7868/S0044467714010067.
[4] Saltykov, K. A., Bark, E. D., & Koulikov, M. A. (2014). Characteristics of event-related potentials in response to symbolical and alphabetical stimulation matrices used in a P300-based brain-computer interface. Human Physiology, 40 (4), 367-374. DOI: 10.1134/S0362119714030141.
[5] Andrews, S., Burton, A. M., Schweinberger, S. R., & Wiese, H. (2017). Event-related potentials reveal the development of stable face representations from natural variability. Quarterly Journal of Experimental Psychology, 70 (8), 1620-1632. [6] Mikhailova, E. S., Gerasimenko, N. Y., Slavutskaya, A. V.,
Krylova, M. A., & Izyurov, I. V. (2017). Temporal and topographic characteristics of evoked potentials in the conflict of two consecutive visual stimuli in a working memory task. Human Physiology, 43 (3), 248-258. DOI: 10.1134/S0362119717030148.
[7] Nguyen, T., Potter, T., Grossman, R., & Zhang, Y. (2018). Characterization of dynamic changes of current source localization based on spatiotemporal fMRI constrained EEG source imaging. Journal of neural engineering, 15 (3), 036017. [8] Fokin, V. A., Shelepin, Y. E., Kharauzov, A. K., Trufanov, G. E., Sevost’yanov, A. V., Pronin, S. V., & Koskin, S. A. (2008). Localization of human cortical areas activated on perception of ordered and chaotic images. Neuroscience and behavioral physiology, 38 (7), 677-685. DOI: 10.1007/s11055-008-9033-2.
[9] Ivanitskii, A. M., Portnova, G. V., Martynova, O. V., Maiorova, L. A., Fedina, O. N., & Petrushevskii, A. G. (2015). Brain Mapping in Verbal and Spatial Thinking. Neuroscience and Behavioral Physiology, 45 (2), 146-153. DOI: 10.1007/s11055-015-0052-5.
[10] Lawrence, S. J., Formisano, E., Muckli, L., & de Lange, F. P. (2017). Laminar fMRI: applications for cognitive
neuroscience. Neuroimage. pp. 1-7.
https://doi.org/10.1016/j.neuroimage.2017.07.004.
[11] Podladchikova, L. N., Bondar, G. G., Ivlev, S. A., Tikidzhi-Khambur'ian, R. A., & Dunin-Barkovskiĭ, V. L. (2008). Dynamics of the activity of cerebellar Purkinje cells induced by changes in the duration of complex spikes. Biofizika, 53 (3), 488-494.
[12] Mazzucato, L., Fontanini, A., & La Camera, G. (2015). Dynamics of multistable states during ongoing and evoked cortical activity. Journal of Neuroscience, 35 (21), 8214-8231. DOI: 10.1523/JNEUROSCI.4819-14.2015.
[13] Schmidt, H., Avitabile, D., Montbrió, E., & Roxin, A. (2018). Network mechanisms underlying the role of oscillations in cognitive tasks. bioRxiv, 271973.
[14] Kiroi, V. N., & Aslanyan, E. V. (2006). General laws for the formation of the state of monotony. Neuroscience and behavioral physiology, 36 (9), 921-928. DOI: 10.1007/s11055-006-0108-7.
[15] Hramov, A. E., Pchelintseva, S. V., Runnova, A. E., Musatov, V. Y., Grubov, V. V., Zhuravlev, M. O., Pisarchik, A. N. (2017). Classifying the perceptual interpretations of a bistable image using EEG and artificial neural networks. Frontiers in neuroscience, 11, 674.
[16] Kazantsev, V. B., Gordleeva, S. Y., Stasenko, S. V., & Dityatev, A. E. (2013). Appearance of multistability in a neuron model with network feedback. JETP letters, 96 (11), 739-742. DOI: 10.1134/S0021364012230087.
[17] Testolin, A., De Filippo De Grazia, M., & Zorzi, M. (2017). The role of architectural and learning constraints in neural network models: a case study on visual space coding. Frontiers in computational neuroscience, 11, 13.
[18] Pisarchik, A. N., Bashkirtseva, I. A., & Ryashko, L. B. (2015). Controlling bistability in a stochastic perception model. The European Physical Journal Special Topics, 224 (8), 1477-1484. DOI: 10.1140/epjst/e2015-02473-0.
[19] Breakspear, M. (2017). Dynamic models of large-scale brain activity. Nature neuroscience, 20 (3), 340.
[20] Verkhliutov, V. M., Ushakov, V. L., & Strelets, V. B. (2009). Decrease in N170 evoked potential component latency during repeated presentation of face images. Zhurnal vysshei nervnoi deiatelnosti imeni IP Pavlova, 59 (3), 307-317.
[21] Pivik, R. T., Andres, A., Cleves, M. A., & Badger, T. M. (2016). Gamma EEG Activation During Picture-Word Semantic Processing in 3 Year Olds Varies As A Function of Gender And Infant Diet. The FASEB Journal, 30 (1 Supplement), 671-15.
[23] Razumnikova, O. M., Volf, N. V., & Tarasova, I. V. (2009). Strategy and results: Sex differences in electrographic correlates of verbal and figural creativity. Human physiology, 35 (3), 285-294. DOI: 10.1134/S0362119709030049.
[24] Slavutzkaya, A. V., Gerasimenko, N. Y., & Mikhailova, E. S. (2012). Recognition of spatially transformed objects in men and women: analysis of behavior and evoked potentials. Human Physiology, 38 (3), 238-248. DOI: 10.1134/S0362119712030139.
[25] Conejero, Á., Guerra, S., Abundis‐Gutiérrez, A., & Rueda, M. R. (2018). Frontal theta activation associated with error detection in toddlers: influence of familial socioeconomic status. Developmental science, 21 (1). https://doi.org/10.1111/desc.12494.
[26] Amenta, S., & Crepaldi, D. (2012). Morphological processing as we know it: an analytical review of morphological effects in visual word identification. Frontiers in psychology, 3, 232. DOI: 10.3389/fpsyg.2012.0023.
[27] Pammer, K., Hansen, P. C., Kringelbach, M. L., Holliday, I., Barnes, G., Hillebrand, A., Cornelissen, P. L. (2004). Visual word recognition: the first half second. Neuroimage, 22 (4), 1819-1825. DOI: 10.1016/j.neuroimage.2004.05.004.
[28] Gagl, B., Richlan, F., Ludersdorfer, P., Sassenhagen, J., & Fiebach, C. J. (2016). The lexical categorization model: A computational model of left ventral occipito-temporal cortex activation in visual word recognition. bioRxiv, 085332. [29] Rosch, E., Mervis, C. B., Gray, W. D., Johnson, D. M., &
Boyes-Braem, P. (1976). Basic objects in natural categories. Cognitive psychology, 8 (3), 382-439. DOI: 10.1016/0010-0285 (76) 90013-X.
[30] Wiegand, I., Lauritzen, M. J., Osler, M., Mortensen, E. L., Rostrup, E., Rask, L., & Petersen, A. (2018). EEG correlates of visual short-term memory in older age vary with adult lifespan cognitive development. Neurobiology of aging, 62, 210-220.
[31] Pearson, J., Naselaris, T., Holmes, E. A., & Kosslyn, S. M. (2015). Mental imagery: functional mechanisms and clinical applications. Trends in cognitive sciences, 19 (10), 590-602. DOI: 10.1016/j.tics.2015.08.003.
[32] Robinson, A. K., Venkatesh, P., Boring, M. J., Tarr, M. J., Grover, P., & Behrmann, M. (2017). Very high density EEG elucidates spatiotemporal aspects of early visual processing. Scientific reports, 7 (1), 16248.
[33] Paivio, A. (2014). Intelligence, dual coding theory, and the brain. Intelligence, 47, 141-158. DOI: 10.1016/j.intell.2014.09.002.
[34] Gutnisky, D. A., Beaman, C. B., Lew, S. E., & Dragoi, V. (2017). Spontaneous fluctuations in visual cortical responses influence population coding accuracy. Cerebral cortex, 27 (2), 1409-1427.
[35] Harter, M. R., & White, C. T. (1968). Effects of contour sharpness and check-size on visually evoked cortical potentials. Vision Research, 8 (6), 701-711.
[36] Il’yuchenok, I. R., Sysoeva, O. V., & Ivanitskii, A. M. (2008). Two semantic systems in the brain for rapid and slow differentiation of abstract and concrete words. Neuroscience and behavioral physiology, 38 (9), 963-970. DOI: 10.1007/s11055-008-9083-5.
[37] Shtyrov, Y., Kujala, T., & Pulvermüller, F. (2010). Interactions between language and attention systems: early automatic lexical processing?. Journal of Cognitive Neuroscience, 22 (7), 1465-1478. DOI: 10.1162/jocn.2009.21292.
[38] Han, S., Yund, E. W., & Woods, D. L. (2003). An ERP study of the global precedence effect: the role of spatial frequency. Clinical Neurophysiology, 114 (10), 1850-1865. DOI: 10.1016/S1388-2457 (03) 00196-2.
[39] Banich, M. T. (2018). Emerging themes in cognitive control: Commentary on the special issue of Psychophysiology entitled “Dynamics of Cognitive Control: A View Across Methodologies”. Psychophysiology, 55 (3), e13060.
[40] Folstein, J. R., & Van Petten, C. (2008). Influence of cognitive control and mismatch on the N2 component of the ERP: a review. Psychophysiology, 45 (1), 152-170. DOI: 10.1111/j.1469-8986.2007.00602.x.
[41] Moore, R. D., Pindus, D. M., Drolette, E. S., Scudder, M. R., Raine, L. B., & Hillman, C. H. (2015). The persistent influence of pediatric concussion on attention and cognitive control during flanker performance. Biological psychology, 109, 93-102.
[42] Polich, J. (2007). Updating P300: an integrative theory of P3a and P3b. Clinical neurophysiology, 118 (10), 2128-2148. DOI: 10.1016/j.clinph.2007.04.019.
[43] Perri, R. L., & Di Russo, F. (2017). Executive Functions and Performance Variability Measured by Event-Related Potentials to Understand the Neural Bases of Perceptual Decision-Making. Frontiers in human neuroscience, 11, 556. [44] Amin, H. U., Malik, A. S., Kamel, N., Chooi, W. T., &
Hussain, M. (2015). P300 correlates with learning & memory abilities and fluid intelligence. Journal of neuroengineering and rehabilitation, 12 (1), 87.
[45] Causse, M., Peysakhovich, V., & Fabre, E. F. (2016). High working memory load impairs language processing during a simulated piloting task: an ERP and pupillometry study. Frontiers in human neuroscience, 10, 240.
[46] Kostandov, E. A. (2007). Significance of the context of cognitive activity in the formation of unconscious visual sets. Neuroscience and behavioral physiology, 37 (4), 321-329. DOI: 10.1007/s11055-007-0017-4.
[47] Morioka, S., Osumi, M., Shiotani, M., Nobusako, S., Maeoka, H., Okada, Y., Matsuo, A. (2016). Incongruence between Verbal and Non-Verbal Information Enhances the Late Positive Potential. PloS one, 11 (10), e0164633.
[48] Grandchamp, R., Rapin, L., Lœvenbruck, H., Perrone-Bertolotti, M., Pichat, C., Lachaux, J. P., & Baciu, M. (2016). Inner Speech with your own or someone else’s voice: cerebral correlates assessed with fMRI. Nat. Rev. Neurosci, 13, 556-571.
[49] van Schie, H. T., Wijers, A. A., Kellenbach, M. L., & Stowe, L. A. (2003). An event-related potential investigation of the relationship between semantic and perceptual levels of representation. Brain and language, 86 (2), 300-325. DOI: 10.1016/S0093-934X (02) 00546-1.
[51] Talsma, D. (2015). Predictive coding and multisensory integration: an attentional account of the multisensory mind. Frontiers in integrative neuroscience, 9, 19.
[52] Bar M., Kassam K. S., Ghuman A. S., Boshyan J., Schmidt A. M., Dale A. M., Hämäläinen M. S., Marinkovic K., Schacter D. L., Rosen B. R., Halgren E. (2006). Top-down facilitation of visual recognition. Proceedings of the National Academy of Sciences of the United States of America, 103 (2), 449-454. DOI: 10.1073/pnas.0507062103.
[53] O’Callaghan, C., Kveraga, K., Shine, J. M., Adams Jr, R. B., & Bar, M. (2017). Predictions penetrate perception: Converging insights from brain, behaviour and disorder. Consciousness and cognition, 47, 63-74.
[54] Schendan, H. E., & Kutas, M. (2007). Neurophysiological evidence for the time course of activation of global shape, part, and local contour representations during visual object categorization and memory. Journal of Cognitive Neuroscience, 19 (5), 734-749. DOI: 10.1162/jocn.2007.19.5.734.
[55] Bar, M., Aminoff, E., & Ishai, A. (2007). Famous faces activate contextual associations in the parahippocampal cortex. Cerebral Cortex, 18 (6), 1233-1238. DOI: 10.1093/cercor/bhm170.
[56] Stothart, G., Quadflieg, S., & Milton, A. (2017). A fast and implicit measure of semantic categorisation using steady state visual evoked potentials. Neuropsychologia, 102, 11-18. [57] Cabeza, R. (2008). Role of parietal regions in episodic
memory retrieval: the dual attentional processes hypothesis. Neuropsychologia, 46 (7), 1813-1827. DOI: 10.1016/j.neuropsychologia.2008.03.019.
[58] Meijs, E. L., Slagter, H. A., de Lange, F. P., & van Gaal, S. (2018). Dynamic Interactions between Top–Down Expectations and Conscious Awareness. Journal of Neuroscience, 38 (9), 2318-2327.
[59] Kutas, M., & Federmeier, K. D. (2011). Thirty years and counting: finding meaning in the N400 component of the event-related brain potential (ERP). Annual review of psychology, 62, 621-647. DOI:
10.1146/annurev.psych.093008.131123.
[60] Nunez, M. D., Vandekerckhove, J., & Srinivasan, R. (2017). How attention influences perceptual decision making: Single-trial EEG correlates of drift-diffusion model parameters. Journal of mathematical psychology, 76, 117-130.
[61] Nicolae, I. E., Acqualagna, L., & Blankertz, B. (2017). Assessing the Depth of Cognitive Processing as the Basis for Potential User-State Adaptation. Frontiers in Neuroscience, 11, 548. DOI: 10.3389/fnins.2017.00548.
[62] Kiroĭ, V. N. (1987). Space-time organization of the electrical activity of the human brain in a state of calm wakefulness and during the solution of intellectual tasks. Zhurnal vysshei nervnoi deiatelnosti imeni IP Pavlova, 37 (6), 1025-1033. [63] Vartanov, A. V., & Pasechnik, I. V. (2005). Brain mechanisms
of the semantic analysis of words-homonyms. Zhurnal vysshei nervnoi deiatelnosti imeni IP Pavlova, 55 (2), 197-201. [64] Baranov-Krylov, I. N., & Astashchenko, A. P. (2007). Visual
search and event-related potentials in the extrastriate cortical areas in humans. Rossiiskii fiziologicheskii zhurnal imeni IM
Sechenova, 93 (9), 1001-1011.
[65] Medvedev L., Shoshina I., Fedorova E. (2011). Reflection of Processing of Visually Presented Poggendorff Figure in ERP. Zhurnal Vysshei Nervnoi Deyatelnosti Imeni I. P. Pavlova, 61 (1), 61-66.
[66] Huang, J., Hensch, T., Ulke, C., Sander, C., Spada, J., Jawinski, P., & Hegerl, U. (2017). Evoked potentials and behavioral performance during different states of brain arousal. BMC neuroscience, 18 (1), 21.
[67] Dippel, G., & Beste, C. (2015). A causal role of the right inferior frontal cortex in implementing strategies for multi-component behaviour. Nature communications, 6, 6587. [68] Clawson, A., Clayson, P. E., Keith, C. M., Catron, C., &
Larson, M. J. (2017). Conflict and performance monitoring throughout the lifespan: An event-related potential (ERP) and temporospatial component analysis. Biological psychology, 124, 87-99.
[69] Kiroy V. N., Belova E. I. (2000). Mechanisms of formation and role of the oscillatory activity of neeuronal populations in brain state and information processing // Zhurnal Vysshei Nervnoi Deyatelnosti Imeni I. P. Pavlova, 50 (2), 189-191. [70] Kiroĭ, V. N., & Choraian, O. G. (2000). The neuronal
ensembles of the brain. Uspekhi fiziologicheskikh nauk, 31 (3), 23-38.
[71] Dumenko, V. N. (2014). The functional role of neocortical gamma activity in the process of interrelations between different areas. Zhurnal vysshei nervnoi deiatelnosti imeni IP Pavlova, 64 (1), 3-20. DOI: 10.7868/S0044467714010055. [72] Marshall, T. R., den Boer, S., Cools, R., Jensen, O., Fallon, S.
J., & Zumer, J. M. (2018). Occipital Alpha and Gamma Oscillations Support Complementary Mechanisms for Processing Stimulus Value Associations. Journal of cognitive neuroscience, 30 (1), 119-129.
[73] Hillyard, S. A., Teder-Sälejärvi, W. A., & Münte, T. F. (1998). Temporal dynamics of early perceptual processing. Current opinion in neurobiology, 8 (2), 202-210. DOI: 10.1016/S0959-4388 (98) 80141-4.
[74] Keitel, C., Thut, G., & Gross, J. (2017). Visual cortex responses reflect temporal structure of continuous quasi-rhythmic sensory stimulation. NeuroImage, 146, 58-70. [75] Beteleva, T. G., & Petrenko, N. E. (2006). Mechanisms of
selective attention in adults and children as reflected by evoked potentials to warning stimuli. Human Physiology, 32 (5), 509-516. DOI: 10.1134/S0362119706050021.
[76] Baumgartner, H. M., Graulty, C. J., Hillyard, S. A., & Pitts, M. A. (2018). Does spatial attention modulate the earliest component of the visual evoked potential?. Cognitive neuroscience, 9 (1-2), 4-19.
[77] Rousselet, G. A., Husk, J. S., Bennett, P. J., & Sekuler, A. B. (2008). Time course and robustness of ERP object and face differences. Journal of Vision, 8 (12), 3-3. DOI: 10.1167/8.12.3.
[79] Fu, S., Zinni, M., Squire, P. N., Kumar, R., Caggiano, D. M., & Parasuraman, R. (2008). When and where perceptual load interacts with voluntary visuospatial attention: An event-related potential and dipole modeling study. Neuroimage, 39 (3), 1345-1355. DOI: 10.1016/j.neuroimage.2007.09.068. [80] Schneider, D., Barth, A., Getzmann, S., & Wascher, E. (2017).
On the neural mechanisms underlying the protective function of retroactive cuing against perceptual interference: Evidence by event-related potentials of the EEG. Biological psychology, 124, 47-56.
[81] Müller-Bardorff, M., Schulz, C., Peterburs, J., Bruchmann, M., Mothes-Lasch, M., Miltner, W., & Straube, T. (2016). Effects of emotional intensity under perceptual load: an event-related potentials (ERPs) study. Biological psychology, 117, 141-149.
[82] Krusienski, D. J., Sellers, E. W., McFarland, D. J., Vaughan, T. M., & Wolpaw, J. R. (2008). Toward enhanced P300 speller
performance. Journal of neuroscience methods, 167 (1), 15-21. DOI: 10.1016/j.jneumeth.2007.07.017.
[83] Baranov-Krylov, I. N., & Astashchenko, A. P. (2008). Characteristics of visual seeking and evoked potentials in the extrastriate areas of the cortex in humans. Neuroscience and behavioral physiology, 38 (7), 661-668. DOI: 10.1007/s11055-008-9030-5.
[84] Zhu, C., He, W., Qi, Z., Wang, L., Song, D., Zhan, L., Luo, W. (2015). The time course of emotional picture processing: an event-related potential study using a rapid serial visual presentation paradigm. Frontiers in psychology, 6, 954. [85] Brunia, C. H. M. (2016). Brain potentials related to