Using Quality-Improvement Techniques
abstract
BACKGROUND AND OBJECTIVES:Infants who live in households expe-riencing food insecurity are at risk for negative health and develop-mental outcomes. Despite large numbers of households within our population experiencing food insecurity, identification of household food insecurity during standard clinical care is rare. The objective of this study was to use quality-improvement methods to increase identification of household food insecurity by the second-year pediatric residents working in the Pediatric Primary Care Center from 1.9% to 15.0% within 6 months. A secondary aim was to increase the proportion of second-year pediatric residents identifying food insecurity.
METHODS: A team was formed to identify key drivers thought to be critical to the process of identifying food insecurity during well-child care. This project addressed 5 key drivers and tested interventions based on these drivers over a 6-month period at a hospital-based primary care site that serves ∼15 000 children from underserved neighborhoods. Tests included implementing an evidence-based electronic screen for food insecurity, educational interventions to improve understanding of food insecurity, empowerment exercises targeting clinicians and families, and gaining buy-in and support from ancillary personnel.
RESULTS:Implementation of these changes led to an increase in the identification rate of household food insecurity from 1.9% to 11.2% over the 6 months (P,.01). The proportion of residents identifying food insecurity increased from 37.5% to 91.9% (P,.01).
CONCLUSIONS: Application of quality-improvement methods in a primary care clinic increased ability to effectively screen and positively identify households with food insecurity in this population. Pediatrics
2012;129:e504–e510
AUTHORS:Mary Carol Burkhardt, MD, Andrew F. Beck, MD, Patrick H. Conway, MD, MSc, Robert S. Kahn, MD, MPH, and Melissa D. Klein, MD
Division of General and Community Pediatrics, Cincinnati Children’s Hospital Medical Center, Cincinnati, Ohio
KEY WORDS
food insecurity, quality improvement, primary care, pediatrics
ABBREVIATIONS
CCHMC—Cincinnati Children’s Hospital Medical Center EMR—electronic medical record
PL2—Pediatric Level 2 (second-year pediatric resident) PPCC—Pediatric Primary Care Center
PSDA—plan-do-study-act QI—quality improvement WCC—well-child care
www.pediatrics.org/cgi/doi/10.1542/peds.2011-1153
doi:10.1542/peds.2011-1153
Accepted for publication Oct 10, 2011
Address correspondence to Mary Carol Burkhardt, MD, Cincinnati Children’s Hospital Medical Center, ML 2008, 3333 Burnet Ave, Cincinnati, OH 45229. E-mail: [email protected]
PEDIATRICS (ISSN Numbers: Print, 0031-4005; Online, 1098-4275).
Copyright © 2012 by the American Academy of Pediatrics
Food insecurity is defined as the lack of access to enough food to fully meet basic nutritional needs because of in-sufficient resources.1–5 Data suggest that 16% to 22% of US households ex-perience food insecurity. Infants who live in food-insecure households are especially vulnerable to the negative effects of insufficient nutrition, which can lead to negative psychological, behavioral, and cognitive outcomes.6 Families experiencing hunger may ex-perience many social and financial strains, forcing difficult decisions be-tween nutrition and other essential needs.6–9 Most low-income families receiving care at urban pediatric clin-ics report at least 1 unmet basic need (eg, food, housing, employment), with many reporting several.7The American Academy of Pediatrics’ Task Force on the Family, 2003, suggests that pedia-tricians screen, assess, and appropri-ately refer based on families’ social needs, particularly food insecurity.5,10 Insufficient and inconsistent screen-ing for social risks can result from unreliable or absent standardized screening.11 Confounding this is the fact that many trainees have limited awareness and discomfort discussing basic needs, as most come from middle-to upper-income backgrounds.12,13 In addition, responding to identified risks remains a challenge because of time-constrained visits.7,12,14
In 2010, an institutional review board– approved anonymous survey was per-formed at the Pediatric Primary Care Center (PPCC) to assess background rates of household food insecurity among families with infants younger than 1 year of age. Food insecurity was defined as a positive screen to the US Department of Agriculture’s vali-dated 6-item indicator for determining household food insecurity.2 A total of 144 families were surveyed over a 4-week period in this unpublished study. Food insecurity was present in 30% of
the surveyed households. The social risk screening questions embedded in the electronic medical record (EMR) were reviewed for 800 infants seen for well-child care (WCC) between April and August 2010. Although second-year pediatrics residents (PL2s) documented screening 74% of families for food in-security, they identified only 1.9% as food insecure.
Without accurate screening and iden-tification of household food insecurity, we believed that we were failing to meet a basic need of the children and fam-ilies from our clinic. Because effective and reliable identification is necessary before implementing interventions, a quality-improvement (QI) project was initiated with the primary aim to in-crease the PPCC PL2s’identification of household food insecurity from 1.9% to 15.0% within 6 months. A secondary aim was to increase the proportion of PL2s identifying food insecurity by 50% in the same 6-month period.
METHODS
Setting
Cincinnati Children’s Hospital Medical Center (CCHMC) is a large, urban, pe-diatric academic medical center. This QI project was performed in the PPCC, the hospital-based outpatient primary-care site, which is the medical home for ∼15 000 children (35 000 visits/ year). The patient population is 70% African American, 21% white 1% His-panic, 1% Asian, 3% multiracial, and 4% other. The payer mix is 80% Medicaid, 10% private insurance, and 10% self-pay. The PPCC has 22 attending physi-cians (8 full-time equivalents) and multiple ancillary providers. The PPCC is the continuity clinic site for approx-imately half of the CCHMC pediatric residents. The 24 PL2s with the con-tinuity clinic at the PPCC were the in-tervention group for this QI project. This cohort of PL2s was demographi-cally representative of our resident
population: 67% were women; 96% were between 26 and 30 years old; and 83% self-identified as white, 4% as black/ African American, and 13% as other.
Improvement Team
A CCHMC pediatric chief resident led the multidisciplinary team that included attending physicians, residents, die-ticians, social workers, legal partners from the PPCC’s Medical-Legal Part-nership, and ancillary personnel. Care-givers were interviewed to obtain families’perspectives and input, given the sensitive nature of household food insecurity. A data analyst and QI con-sultant provided technical and meth-odological support.
Planning and Executing the Intervention
PL2s already screened for social risk factors, but there was concern about the quality of this screening owing to lack of case detection. Therefore, the team attempted to increase the accu-racy of the screening process by con-ducting preliminary interviews with key stakeholders, including PPCC staff, families, and the PL2s who most fre-quently identified social risks. The QI team found significant reasons that were potentially affecting clinic screening. There was variation among providers’style in taking a social history, despite preexisting standardized prompts in the EMR. Some providers lacked awareness of social strains and others did not feel empowered to offer families lasting solutions when strains were detected. In addition, the food in-security question embedded in the social history was not validated and was located on the social/environmental screen, not the nutrition screen, where most physi-cians addressed issues related to feeding and household food supply.
Five key drivers to effectively screen our population for food insecurity were identified: the use of evidence-based
understanding why screening for social risks relates to child health, empow-erment of providers and families to feel comfortable discussing sensitive top-ics, and buy-in from clinic staff (Fig 1).
Our goal was to identify half of the households estimated to be food in-secure, which would be 15% of an es-timated 30% of the PPCC population. PPCC leadership felt there was suffi -cient support from social workers, nutritionists, and legal advocates to ef-fectively handle the concerns that could arise if 15% of our families were iden-tified as food insecure.
Several interventions were planned to address the various key drivers of this process. First, interventions to use evidence-based criteria to standardize screening began. A published 2-question screen studied in low-income families with young children was tested, which showed that a positive response to either question had a sensitivity of 97% and specificity of 83% in previous studies.15 After a 2-week trial on paper, data
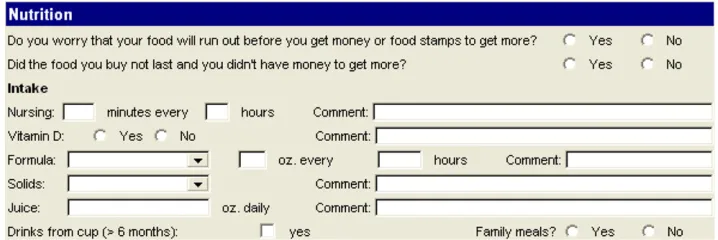
existing tool, so it was embedded in the EMR. Next, the location of the food in-security questions was addressed. After discussion with the improvement team and resident users, it was determined that the nutrition form was a better location for food insecurity questions (Fig 2). After a small-scale test, the questions were permanently moved to the new EMR location.
The next set of interventions focused on 2 key drivers: awareness that food in-security is a problem in our population and an understanding of how and why screening for social risks relates to child health. To address these drivers, the team started a series of educational interventions. Education was essential to our intervention group, as all residents were less than halfway through their training. In addition, most of the partic-ipating pediatric residents were not raised in families that experienced social strain. A series of interactive large- and small-group multidisciplinary case-based sessions that focused on the
social risk screening was implemented and continued over 6 months.
To empower residents and to address our fourth key driver, many PL2s were observed taking a social history and given one-on-one feedback for both val-idation and suggestions for individual improvement. This enabled the im-provement team to gain additional in-sight into the variation of residents, as it became apparent that some resi-dents did not ask such questions be-cause they did not know how to react when they received a positive response. Further education on interventions and asking sensitive questions was added to the educational series, in-cluding videos on how to conduct inter-views. In addition, residents received positive feedback via E-mail after pos-itively identifying a family with food insecurity. Residents who had detected no food insecurity were deemed“low performers” and received feedback to help them overcome their specific barriers.
In addition to attempting to empower residents, families were also encour-aged to speak up about social concerns they faced. Posters in exam rooms explained to families the PPCC’s focus on social determinants of health and about the services available. The PPCC began a new initiative with a commu-nity partner to provide supplemental infant formula to food-insecure house-holds with children younger than 1 year of age. Bundled with the formula was educational material prepared by the QI team that focused on sustainable budgeting, job, career training, and ad-ditional food resources.
Finally, gaining buy-in from the entire PPCC staff was essential. Although the PL2s were the focus of the interventions, improvement efforts ultimately involved the entire clinic. The QI team met with
FIGURE 1
clinic management to integrate this work into the existingflow and mission of the PPCC. Data were shared with all staff to further promote awareness.
Outcome Measures and Methods of Evaluation
The primary outcome measure was the percentage of households identified as food insecure by PL2s during routine WCC. This outcome was chosen because identification during WCC would allow for intervention at the point of care. A secondary outcome measure was the percentage of PL2s who successfully identified an infant living in a food-insecure household. This outcome was chosen to determine if a more standar-dized screening process would better engage PPCC physicians. Baseline data were collected from 800 charts via EMR review from April through August 2010, specifically looking at WCC encounters completed by the 24 residents followed during this project.
Analysis
The QI team used a series of statistical run charts, which show trends over time, to monitor progress toward im-provement. Run charts track the ef-fectiveness of piloted interventions, as well as differentiating common-cause and special-cause variation. Common-cause variation is the typical variation that occurs inherent to a process, but lacks significance in individual high and low numbers. In contrast, special-cause
variation results from causes that are from specific circumstance. Our goal in using run charts was to identify if special-cause variation could be at-tributed to our previously stated in-terventions, as well as to reduce the inherent variation in process or common-cause variation.
Statistically significant differences be-tween preintervention and postinter-vention outcomes were assessed. For positive identification of food insecurity, we defined April through August 2010 as preintervention and August 2010 to January 2011 as postintervention. P
values were obtained viax2testing.
Ethical Issues
Background information regarding PL2s was collected anonymously via online survey methodology in a study approved by the CCHMC institutional review board. This project was con-ducted within PPCC’s ongoing improve-ment efforts that respect privacy of all key stakeholders. All patient information reviewed was de-identified and no pro-tected patient information was col-lected, so as to protect patient privacy.
RESULTS
The demographics and childhood social hardships (history of inadequate housing, food security, use of public benefits, maternal depression, and ex-posure to domestic violence)16of the PL2s are listed in Table 1. More than
70% of the PL2s grew up in households with none of these defined hardships. Owing to the anonymous survey, this information was not correlated to de-termine if childhood social hardships affected resident screening for food insecurity.
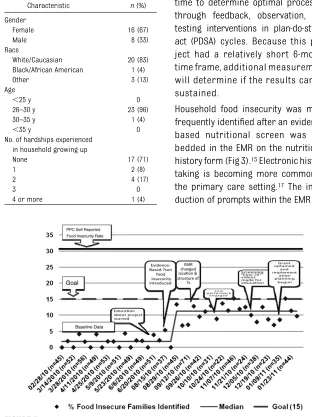
Despite the lack of reported personal experiences with social hardships, the PL2s increased the rate of identification of household food insecurity. The cohort’s baseline identification of food insecurity rate increased from 1.9% to 11.2% during the intervention period (Fig 3). Based on the number of PL2s scheduled in the PPCC on any given week, an average of 43 families (range 23–72) were screened weekly during the intervention period. Therefore, the PL2s increased identification of food insecurity from fewer than 1 to almost 5 families per week. The run chart shows that the efforts to standardize the evidence-based questions, alter the EMR, and educate those most involved in the care processes provided a successful change that was statisti-cally significant (P,.01).
Decreased physician variation occur-red as the screening process was standardized. At the beginning of the project, 9 of the 24 PL2s (37.5%) had documented identifying a family expe-riencing food insecurity. On comple-tion of our process and educacomple-tional interventions, 22 of 24 residents (91.9%) had detected and documented food insecurity during routine WCC visits.
FIGURE 2
Nutritional screening questions in the EMR.
food insecurity detected during the intervention period, as the perfor-mance improvement was variable across residents. The increased num-ber of providers effectively screening for food insecurity was statistically significant (P,.01).
DISCUSSION
QI methodology can enhance rates of identification of household food
included the use of evidence-based criteria to systematize screening through the EMR. Increased awareness about food insecurity and understanding how it affects child health were addressed through education. The empowerment of both resident providers and families to feel comfortable discussing sensitive topics, and gaining buy-in from clinic staff were addressed by increasing awareness of food insecurity and early exploration of potential interventions, such as point-of-care formula distri-bution. Measurable change required a multiphase approach changing over time to determine optimal processes through feedback, observation, and testing interventions in plan-do-study-act (PDSA) cycles. Because this pro-ject had a relatively short 6-month time frame, additional measurement will determine if the results can be sustained.
Household food insecurity was more frequently identified after an evidence-based nutritional screen was em-bedded in the EMR on the nutritional history form (Fig 3).15Electronic history taking is becoming more common in the primary care setting.17The intro-duction of prompts within the EMR can
ability to change EMR-based questions proved important, as both content and location were refined. Further changes could still be necessary, as possibilities to intervene expand.12 A provider-administered screening tool can be an effective way to increase identifi ca-tion of food insecurity in a busy clinic14; however, this requires the clinician to interview in a sensitive and family-centered manner.
Because most residents did not grow up in poverty, they cannot rely on per-sonal experience. Based on Knowles’ theory on adult learning styles, this sug-gests a need for education and feedback on these topics18; however, the correla-tion between residents’experience with childhood social hardships and their ability to detect food insecurity was not the study focus. Low-performing residents were asked their opinions and feelings about the issue of food insecurity and how they interact with families. After expressing their personal views and receiving feedback from peers on how others approach such issues, many low performers did de-tect greater numbers of families with food insecurity. The team anticipates that lessons learned by these resi-dents will be sustainable in their future clinical practice.
Several of our interventions had no measurable effect on our outcome (Fig 3). Some PDSA cycles, including social history videos and engaging low per-formers, resulted in only common-cause variation. Although we do not know the ultimate effect of these interventions, we felt that these 2 interventions were not worth further pursuit. The new pro-gram to provide infant formula was an-nounced at the end of the intervention period as a separate project undertaken in parallel to these QI interventions. The formula distribution has not been abandoned even though it did not show
FIGURE 3
Percentage of households with food insecurity identified by PL2s. TABLE 1 Demographics of PL2 Residents (n
= 24)
Characteristic n(%)
Gender
Female 16 (67)
Male 8 (33)
Race
White/Caucasian 20 (83) Black/African American 1 (4)
Other 3 (13)
Age
,25 y 0
26–30 y 23 (96)
30–35 y 1 (4)
,35 y 0
No. of hardships experienced in household growing up
None 17 (71)
1 2 (8)
2 4 (17)
3 0
evidence of special-cause variation. Because of the brief time frame of this QI project, the formula distribution was not studied long enough to determine its ultimate impact. Because the for-mula program targets only families with infants, its effect on the overall trend will likely be limited.
Educational interventions are more difficult to sustain than those based on system change, such as implementa-tion of EMR-based templates. There was increased identification with educa-tional interventions, but the duration of these effects is unknown; however, there is a need for education based on the residents’ limited life experience related to social and financial hard-ships and to enhance their overall training in general pediatrics. Although isolated educational interventions have low reliability and often lack sustainability, owing to turnover and inconsistent application, the continued and repetitious educational curri-culum helps address this problem. EMR documentation of food-insecurity questions was used as a proxy for physician behavior, but discrepancies between what was asked and what was documented cannot be determined. Furthermore, it is difficult to know the degree of sensitivity and family cen-teredness displayed by the residents,
which may affect the family’s response. Although the EMR-based template makes documentation easier, it may lead to inaccurate information. Wagner and Hogan,19 evaluating medication data, found that outpatient EMRs may have significant levels of data error. Because of the nature of our mea-sure, it is impossible to learn from failures, as we do not know if a specific household is food insecure but does not wish to share that information, or if our screening process is insuf-ficient. Risk identification is also lim-ited by the possibility of social desirability bias.20 Families may not wish to report household food inse-curity for fear that their physician would think less of them or even report them to children’s protective services. A small number of PL2s from a single hospital-based pediatric clinic with excellent ancillary support staff par-ticipated, so the ability to generalize may be limited.
Although a significant increase in de-tection rates was documented, the predetermined goal of detecting 15% of food-insecure families was not achieved. This goal was established knowing the limitations of family report and pro-vider detection on sensitive issues in conjunction with the PPCC’s ancillary staff’s ability to handle intervention on
this rate of detection. Families’ poten-tial to underreport food insecurity may mean that screening was effective in identifying a high percentage of fami-lies willing to disclose food insecurity. Even though the goal of 15% was not reached, the team believes that the greater thanfivefold increase is clini-cally significant.
CONCLUSIONS
QI methodology, in conjunction with multidisciplinary collaboration, can be effectively implemented in a busy pe-diatric clinic to improve identification of household food insecurity. Target-ing a specific provider population and standardizing the screening process can increase effective screening. In-terventions that focused on education and evidence-based prompts in an EMR were most effective. Several in-terventions instituted in PDSA cycles were ineffective and abandoned. As the importance of awareness of food in-security within a vulnerable popula-tion increases, techniques to improve identification become more essential. This QI platform will be used to develop and test a food insecurity intervention, and to expand screening and inter-vention for other social determinants of health.
REFERENCES
1. US Department of Agriculture. Measuring
US Household Food Security. 2005.
Avail-able at: www.ers.usda.gov/AmberWaves/
April05/DataFeature/. Accessed January
22, 2010
2. Bickel G, Nord M, Price C, Hamilton W, Cook
J.Guide to Measuring Household Food Se-curity, Revised.Alexandria, VA: USDA Food and Nutrition Service, Office of Analysis and
Evaluation; 2000
3. Black MM, Cutts DB, Frank DA, et al;
Child-ren’s Sentinel Nutritional Assessment
Pro-gram Study Group. Special Supplemental
Nutrition Program for Women, Infants, and
Children participation and infants’growth
and health: a multisite surveillance study.
Pediatrics. 2004;114(1):169–176
4. Cook JT, Frank DA. Food security, poverty,
and human development in the United
States. Ann N Y Acad Sci. 2008;1136:193– 209
5. Silverstein M, Conroy K, Sandel M. Screening for social determinants of health in
pediat-ric primary care.Pediatr Ann. 2008;37(11): 740–746
6. Ma CT, Gee L, Kushel MB. Associations
be-tween housing instability and food
in-security with health care access in
low-income children.Ambul Pediatr. 2008;8(1): 50–57
7. Garg A, Butz AM, Dworkin PH, Lewis RA,
Serwint JR. Screening for basic social needs
at a medical home for low-income children.
Clin Pediatr (Phila). 2009;48(1):32–36 8. Bhattacharya J, DeLeire T, Haider S, Currie
J. Heat or eat? Cold-weather shocks and
nutrition in poor American families.Am J Public Health. 2003;93(7):1149–1154 9. Frank DA, Neault NB, Skalicky A, et al. Heat
or eat: the Low Income Home Energy
As-sistance Program and nutritional and
health risks among children less than 3
years of age. Pediatrics. 2006;118(5). Available at:
www.pediatrics.org/cgi/con-tent/full/118/5/e1293
Pediatrics. 2005;115(suppl 4):1124–1128 11. Institute of Medicine (U.S.).Committee on
Quality of Health Care in America. Crossing the Quality Chasm: A New Health System for the 21st Century. Washington, DC: Na-tional Academy Press; 2001
12. Kenyon C, Sandel M, Silverstein M, Shakir A, Zuckerman B. Revisiting the social history for child health. Pediatrics. 2007;120(3). Available at: www.pediatrics.org/cgi/con-tent/full/120/3/e734
13. Jolly P.Analysis in Brief: Diversity of U.S. Medical Students by Parental Income. As-sociation of American Medical Colleges.
little time: care for the socially disadvan-taged and the 15-minute visit.Arch Intern Med. 2008;168(17):1843–1852
15. Hager ER, Quigg AM, Black MM, et al. De-velopment and validity of a 2-item screen to identify families at risk for food insecurity.
Pediatrics. 2010;126(1). Available at: www. pediatrics.org/cgi/content/full/126/1/e26
16. Klein M, O’Toole J, Burkhardt MC, Solan L, Vaughn L.Resident Confidence Addressing Social History: Is It Influenced by Availabil-ity of Social-Legal Resources?Denver, CO: Abstract and Poster Presentation, Pediatric Academic Societies; 2011
Stat Report. 2010;(23):1–11
18. Merriam SB, Caffarella RS, Baumgartner L.
Learning in Adulthood: A Comprehensive Guide. 3rd ed. San Francisco, CA: Jossey-Bass; 2007
19. Wagner MM, Hogan WR. The accuracy of medication data in an outpatient electronic medical record. J Am Med Inform Assoc. 1996;3(3):234–244
DOI: 10.1542/peds.2011-1153 originally published online January 16, 2012;
2012;129;e504
Pediatrics
Melissa D. Klein
Mary Carol Burkhardt, Andrew F. Beck, Patrick H. Conway, Robert S. Kahn and
Quality-Improvement Techniques
Enhancing Accurate Identification of Food Insecurity Using
Services
Updated Information &
http://pediatrics.aappublications.org/content/129/2/e504
including high resolution figures, can be found at:
References
http://pediatrics.aappublications.org/content/129/2/e504#BIBL
This article cites 13 articles, 5 of which you can access for free at:
Subspecialty Collections
http://www.aappublications.org/cgi/collection/nutrition_sub
Nutrition
sub
http://www.aappublications.org/cgi/collection/quality_improvement_
Quality Improvement
e_management_sub
http://www.aappublications.org/cgi/collection/administration:practic
Administration/Practice Management
following collection(s):
This article, along with others on similar topics, appears in the
Permissions & Licensing
http://www.aappublications.org/site/misc/Permissions.xhtml
in its entirety can be found online at:
Information about reproducing this article in parts (figures, tables) or
Reprints
http://www.aappublications.org/site/misc/reprints.xhtml
DOI: 10.1542/peds.2011-1153 originally published online January 16, 2012;
2012;129;e504
Pediatrics
Melissa D. Klein
http://pediatrics.aappublications.org/content/129/2/e504
located on the World Wide Web at:
The online version of this article, along with updated information and services, is
by the American Academy of Pediatrics. All rights reserved. Print ISSN: 1073-0397.