www.astrophys-space-sci-trans.net/7/387/2011/ doi:10.5194/astra-7-387-2011
© Author(s) 2011. CC Attribution 3.0 License. Astrophysics and Space Sciences
Transactions
MHD simulation of the evolution of shock structures in the solar
corona: implications for coronal shock acceleration
J. Pomoell1, R. Vainio1, and R. Kissmann2
1Department of Physics, University of Helsinki, Finland
2Institute for Astro and Particle Physics, University of Innsbruck, Austria
Received: 12 November 2010 – Revised: 14 February 2011 – Accepted: 10 March 2011 – Published: 12 September 2011
Abstract. We have employed magnetohydrodynamic (MHD) simulations to study the dynamics of shocks in a so-lar minimum-like corona caused by an erupting coronal mass ejection (CME). Our simulations show that a highly non-trivial evolution of the shock properties on coronal field lines occurs even for simple coronal conditions. By comparing with recent test particle simulations of an evolving coronal shock employing a simplified shock model, we qualitatively assess the possibility of the shocks given by the MHD simu-lations to produce energetic particles. Our conclusion is that the evolution of parameters most crucial to particle acceler-ation at shocks, such as the compression ratio and obliquity, need to be more accurately taken into account in models and simulations of particle acceleration than has been customary, so far.
1 Introduction
Shock waves driven by coronal mass ejections (CMEs) play a key role in the generation of energetic particle popula-tions in the heliosphere. In the standard two-class paradigm (Reames, 1999), CME driven shocks are held responsible for producing large, gradual solar energetic particle (SEP) events, while impulsive events are ascribed to particle accel-eration at sites associated with flares. However, detailed data obtained from spacecraft measurements collected during so-lar cycle 23 have revealed features challenging the standard picture.
At energies above a few MeV per nucleon, gradual events exhibit a substantial event-to-event variability especially in the elemental abundance ratios and charge states. As a result, many gradual events show characteristics typical to both im-pulsive and gradual events, blurring the compositional
dis-Correspondence to: J. Pomoell
tinction between the two types of events. Thus, the funda-mental question is whether the high-energy variability can be understood within the context of shock acceleration, or if some other mechanism is needed (Tylka and Lee, 2006).
One avenue of probing this question is by developing appropriate simulation models of shock acceleration in the corona. A fundamental problem is, however, that the param-eters of CME driven shocks most crucial to particle acceler-ation, such as the compression ratio and obliquity angle, are not known from observations. Therefore, to study the parti-cle acceleration at shocks in the corona, the global dynamics of the shocks also need to be modeled.
In this study, we employ magnetohydrodynamic (MHD) simulations to study the evolution of shocks induced by a CME erupting into a corona similar to solar minimum condi-tions. On one hand, we focus on the potential of the shocks to produce energetic particles by referring to results of re-cent test particle simulations of an evolving coronal shock employing a simplified shock model. On the other hand, we can assess the correctness of using simplified shock mod-els to represent coronal shocks. This discussion will be pre-sented in Sect. 4 after the presentation of the MHD model in Sect. 2 and a brief review of previous test particle simulation results in Sect. 3. Finally, Sect. 5 provides a summary and the conclusions.
2 Model
We study the dynamics in the corona by solving numerically the equations of ideal MHD, given by
∂ρ
∂t = −∇ ·(ρv), (1)
ρ∂v
∂t +ρv· ∇v= −∇P+
1
µ0
(∇ ×B)×B+ρg, (2)
∂(P /ργ)
∂t +v· ∇(P /ρ
γ)=S, (3)
∂B
using spherical coordinates in a two-dimensional azimuthally symmetric setting. In the system of equations aboveρ is the mass density, v is the velocity field, B is the magnetic field,P is the thermal pressure, g= −GM
r2 r is the gravita-ˆ
tional acceleration withGthe gravitational constant andM the solar mass, γ is the adiabatic index andS is a source term. The numerical method we apply is a conservative second-order finite volume scheme. The hyperbolic equa-tions are solved using the methods described in Kissmann et al. (2009), while the induction equation is treated with a consistent constrained transport technique so that the mag-netic field remains divergence-free up to machine precision. Note that since the solver is conservative, we solve the equa-tions not in the primitive form given above, but in conser-vative form using the variablesρ,ρv,B and energy density
u= P
γ−1+ 1 2ρv
2+ 1 2µ0B
2(see Kissmann et al., 2009). Although we are interested in studying the dynamics close to the Sun, the boundary conditions become more tractable if the simulation domain is chosen such that at the outer radial boundary the flow is super fast-magnetosonic so that sim-ple extrapolation of the variables can be used, and the entire meridional plane is considered so that symmetry conditions determine the lateral boundaries. Accordingly, we choose the domain to extend in the radial direction from 1.2R out to 30R, and consider the full plane fromθ=0 toθ=π. The boundary conditions at the lower radial boundary will be dis-cussed below. In order to maintain a sufficient resolution near the Sun, we apply a stretched grid in therdirection, concen-trating grid cells near the Sun so that the radial grid spacing is1r=0.008R at the lower boundary and increases by a constant factor of 1.8% from one cell to the next. Also in the latitudinal direction the grid is stretched, with1θ=0.0125 at the equator and increasing towards the poles by 2.2% per cell. In total, 235×125 cells then cover the entire domain. 2.1 The initial corona
The first step of the simulation procedure is to obtain an ini-tial condition representing the solar corona. Specifically, we seek a steady-state initial corona that includes a solar wind-like steady outflow. However, as the physical processes re-sponsible for accelerating the solar wind remain unknown, some form of ad-hoc heating mechanism is needed to actu-ally drive the wind. Out of a variety of such methods that have been employed in conjunction with MHD simulations (see, e.g. Cohen et al., 2008; Feng et al., 2010; Nakamizo et al., 2009, for references to a number of such studies), we adopt the simple and common method of choosing the adi-abatic index to beγ=1.05, in other words smaller than the value of 5/3 expected for a monoatomic plasma such as the solar corona. With the driving method established, the so-lar wind solution is then obtained by integrating the MHD equations in time until a converged steady state is reached.
However, altering the adiabatic index is not problem-free. For instance, the efficiency of shocks as particle accelerators
is very sensitive to the compression ratiorc of the shocks, and the maximal compression ratio of an MHD shock is re-lated toγ byrc,max=(γ+1)/(γ−1). Thus, for applications where capturing the shock physics is essential, it is clear that models using an altered adiabatic index should not be used. To remedy this, we add the source termSto Eq. (3). To ob-tain the solar wind solution, we first perform a convergence simulation using γ=1.05≡01 andS=0. We then wish to obtain the identical solar wind solution but instead using
γ=5/3≡02. To achieve this,S must be non-zero, and is determined from Eq. (3) by putting∂/∂t=0, and requiring the two solutions to be identical. This gives
S=v1· ∇
P1ρ −02
1
(5) where v1,P1andρ1are the velocity, pressure and density of the simulation with γ=1.05. Using this source term, one can retain γ=5/3 and still have the identical solar wind solution as obtained by using a lower adiabatic index. To the best of our knowledge, such an equivalent heating source term approach has not previously been applied to drive the solar wind in MHD simulations.
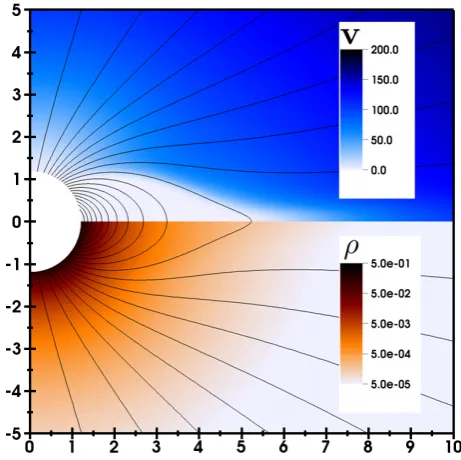
We choose the initial magnetic field to be a dipole field with the strength of approximately 1.3·10−4T at the pole, and the density and radial velocity are initialized accord-ing to Parker’s hydrodynamical solar wind solution, with
ρ0=1.67·10−13 kg/m3the density andT0=1.5·106K the temperature at the coronal base atr=R. During the con-vergence run the density, temperature and magnetic field are kept fixed to the initial values at the inner radial boundary. Note that the azimuthal velocity and magnetic field remain zero throughout the simulation since we do not include the effects of solar rotation as these are of minor importance near the Sun. Figure 1 shows the speed and density of the obtained converged solar wind solution. A common critique for wind models usingγ=1.05 is their inability to produce a fast po-lar wind (e.g. Jacobs et al., 2005). This is also visible in Fig. 1. However, the model has been noted to reproduce the essential features of the corona during quiet solar conditions (Riley et al., 2006).
2.2 CME model
After the initial coronal state has been obtained, the final step in the simulation procedure is to generate a coronal mass ejection. The practice in many studies (e.g. Liu et al., 2008; Cohen et al., 2010, and references therein) has been to sim-ply superpose some eruptive non-equilibrium structure on to the initial condition. Following this route, we superimpose on the converged solar wind solution a toroidal region with a higher density and a non-zero radial velocity to mimic an erupting prominence. Specifically, we choose
ρ(r,θ )=ρsw(r,θ )+f (r,θ )ρcme (6)
whereρcme=6ρ0andvcme=1150 km/s, and the quantities with the subscript SW refer to the background solar wind solution. The profilef of the eruptive structure is similar to the one applied by Jacobs et al. (2005), and is given by
f (r,θ )=
(
1
2(1−cos[π((dcme−d)/dcme)]), d < dcme
0, d > dcme
(8)
where d is the distance from the center of the CME and
dcme=0.1Ris the radius of the CME. In addition, we vary the initial location of the eruptive structure and consider two separate cases: in the first case (designated Run A), the CME is launched in to the equatorial plane, while in the other case (Run B) the CME is launched 30◦ to the North from the equatorial plane. In both cases, the center of the filament is placed atr=1.4R so that the entire erupting structure is above the lower radial boundary of the simulation. Thus, the converged solar wind solution with the erupting promi-nence superimposed serves as the initial condition for the shock simulations.
Although the axisymmetric model described above is nat-urally a crude simplification of an actual erupting promi-nence, the shock driven by such an eruption can be expected to be less sensitive to the actual structure of the prominence. Furthermore, for the time period of interest in the current study, the evolution of the shock is not sensitive to the choice of the parameters of the model. This is evident from the work of Jacobs et al. (2007), in which a parameter study as well as a comparison to a three-dimensional simulation for a similar CME model was conducted.
3 Review of recent results from Monte Carlo simulations
Since we are interested in studying the ability of the shock to produce energetic particles, which the magnetohydrody-namic simulation cannot directly address, we first recapitu-late recent results obtained by Sandroos and Vainio (2009b) using test-particle simulations of particle acceleration in a coronal shock with a simplified shock model. By comparing with that model, we can then qualitatively assess the possi-bility of the more realistic shocks given by the MHD simu-lations to produce energetic particles, and at the same time address the limitations of using analytical models to repre-sent coronal shocks driven by CMEs.
3.1 Model description
In a series of studies, Sandroos and Vainio (2007, 2009a,b) have performed test particle Monte Carlo simulations of ion acceleration in coronal shocks with an evolving magnetic ge-ometry. The model is based on tracing individual particles, using the full equation of motion, in the large-scale electro-magnetic field of the coronal plasma, including the shock wave and its downstream flow. The small-scale field, i.e.
Fig. 1. The velocity (top half) and density distribution (bottom half) of the initial coronal state. The unit in the velocity plot is km/s and for the density 1.67·10−13kg/m3, the density of the coronal base.
magnetic turbulence, is taken into account in the model by performing random pitch-angle scattering on the particles. The scattering is assumed to be elastic in the local plasma frame and the frequency,ν, of the scatteing is a model pa-rameter that depends on the particle momentum and loca-tion, tuned so that the cut-off energies of the accelerated ions match the observations. The scattering model leads to a par-allel mean free path,λk=v/ν, that is from some hundreds to some thousands of times the ion Larmor radius,rL, the ex-act fex-actor depending on the ion rigidity. The perpendicular mean free path resulting from the scattering model is almost negligible, of the order ofλ⊥∼rL2/λk.
The ion injection in the model is handled so that a supra-thermal ion population with energies above 2 keV/nucleon is taken to be present upstream of the shock. The shock runs into this seed population and injects a part of it to the dif-fusive shock acceleration process. Since the model assumes that the amplitude of the upstream turbulent field is small, it assumes that the shock normal angle,2Bnis determined
by the mean field. This results in an injection threshold for ions that increases roughly as∼1/cos2Bn with the shock
a:
t
=
8 min
b:
t
=
16 min
c:
t
=
24 min
d:
t
=
24 min
e:
t
=
48 min
f:
t
=
72 min
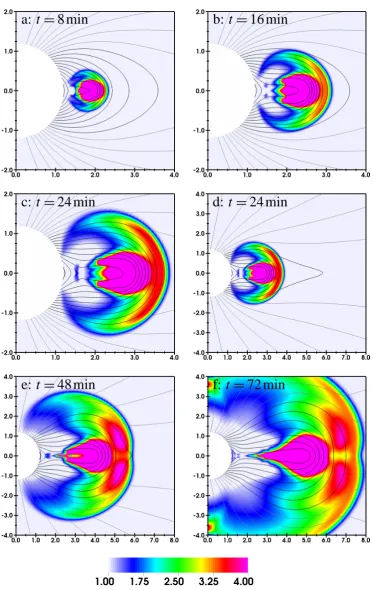
Fig. 2. Snapshots of the compression ratio at five different times after the onset of the eruption for Run A where the CME was launched into the equatorial plane. The black curves show closed magnetic field lines, while the gray curves show open magnetic field lines. Note that the plotted domain as well as the magnetic field lines shown are different in panels (a-c) from those in panels d-f. Panels c and d show the same time frame to illustrate these changes. The colorbar, shown at the bottom, is the same for all panels and has been clipped to the range[1,4]
a:
t
=
8 min
b:
t
=
16 min
c:
t
=
24 min
d:
t
=
24 min
e:
t
=
48 min
f:
t
=
72 min
Specifically, in Sandroos and Vainio (2009b), the simu-lation setup consists of a semirealistic large scale coronal magnetic field describing the field near a bipolar active re-gion. A spherical shock expanding radially from a point near the active region with a constant speed and with a constant compression ratio of 3 is introduced so as to model a shock driven by an eruption. Ions are then injected on selected field lines to study the effect of the evolving magnetic geometry on the acceleration efficiency under the assumptions described above.
3.2 Results
The Monte Carlo simulations showed that on field lines ex-periencing an extended period such that 2Bn was close to
90 degrees, i.e. a quasi-perpendicular shock, ions are accel-erated to the highest energies provided that a suprathermal seed population above the injection threshold exists in the ambient plasma. As expected from theory, acceleration to high energies was found to be fastest if the shock was quasi-perpendicular. However, acceleration to the highest energies for field lines with a quasi-perpendicular phase of the shock evolution was found to be very sensitive to the energies of the seed particles. In fact, it was found that diffusive shock acceleration is most effective on field lines where the shock experiences a phase when 2Bn is increasing from oblique
to quasi-perpendicular values. This was interpreted so that during the oblique phase the shock was capable of inject-ing lower-energy particles to the acceleration process, which could then be further accelerated to the highest energies when the shock was turning quasi-perpendicular.
In light of these results, we now turn to discuss the results obtained from the MHD simulations.
4 Results and discussion
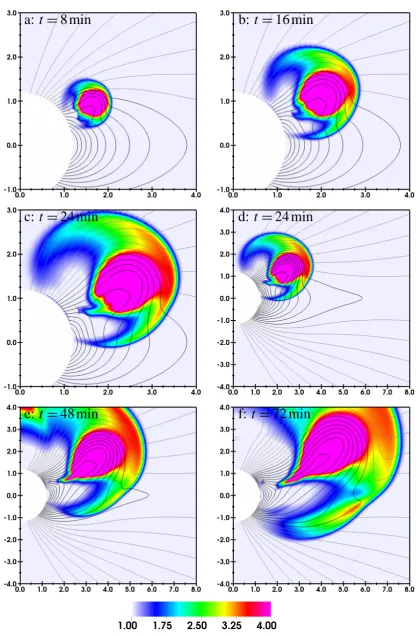
The temporal evolution of the shocks driven by the erupting CME as given by the simulations are presented in Figs. 2 and 3. The plots show the compression ratiorc, defined as
rc(r,θ,t )=ρ(r,θ,t )/ρ(r,θ,t=0), (9) at several different times for the two simulation runs, with the results from Run A shown in Fig. 2 and the results from Run B shown in Fig. 3. The figures also depict the magnetic field lines, where closed field lines are drawn by black curves while the gray curves show open field lines. A given field line was designated open if it reached the outer boundary of the simulation atr=30R. Movies of the two simulation runs are included as on-line supplementary material.
4.1 Run A
Run A presents a CME launched from the equatorial region to a corona with dipole-like structure. The early evolution of the shock wave in a meridional plane is represented by a
quasi-circular evolution of the wave, with the strongest re-gion located near the nose of the shock. The compression ratio of the shock isrc>3 but stays below the upper-limit of 4. This indicates that the model treats the shocks physics consistently in terms of compression, which is important for particle acceleration.
The shock enters the open magnetic field line region aroundt∼20 min. The first contact of the shock to these field lines occurs, when the flank of the shock, with rc= 2−3, touches the open field lines tangentially (Fig. 2, pan-els b and c). After the first contact, the evolution on a given open field line proceeds so that the shock gets stronger and the shock obliquity decreases. At around∼25−30 min, the shock normal angle decreases below 45 degrees on the open field lines closest to the equator (panels d and e). After that time, the shock obliquity and compression ratio on these field lines stay roughly constant for an extended period of time (compare for instance the first open field line in panel e to the same line in panel f). Thus, at this stage, particle accelera-tion at the shock should be diffusive shock acceleraaccelera-tion under quasi-stationary conditions. If enough high-energy seed par-ticles (that can be injected by a quasi-perpendicular shock) are available, the most efficient phase of particle acceleration on each open field line occurs some minutes after the first contact of the shock, when the shock is quasi-perpendicular. Particle acceleration on closed field lines in Run A is most efficient after∼10 min, when the curvature radius of the shock becomes larger than the curvature radius of the ambient field lines. When this is the case, the upstream field lines become connected to the shock in two points and there is a collapsing trap between the points of contact (see panel b). This type of geometry has been shown to be very favourable for particle acceleration to high energies (San-droos and Vainio, 2006).
4.2 Run B
Run B presents a CME launched at mid-latitudes to a corona with dipole-like structure. As the system is non-symmetric, a considerably more complicated shock evolution than in Run A follows. The shock properties on open field lines are very different on the two sides of the heliospheric current sheet. North of the current sheet, the shock reaches the open field lines very quickly, in a matter of minutes from the launch of the CME and the shock geometry stays quasi-parallel for almost the whole evolution of the shock. Only for the non-equatorial field lines at the northern flank, where the shock is weak, is the shock quasi-perpendicular.
than on the northern side of the current sheet due to the more favourable magnetic geometry.
Particle acceleration on closed field lines occurs on the southern flank of the shock. There, the key properties of the shock (compression ratio, obliquity) vary a lot from one field line to another and have a complicated time evolution. The shock on some of the field lines (e.g. the outermost closed field lines shown in panels d and e of Fig. 3) shows a favourable evolution where a quasi-parallel phase (panel d), capable of injecting thermal particles to the acceleration pro-cess, is followed by a quasi-perpendicular phase (panel e), capable of rapid acceleration to high energies. In the model by Sandroos and Vainio (2009b), the most efficient particle acceleration was found for precisely such geometries. How-ever, at present it is unclear whether the accelerated parti-cles could find a way to escape from the closed field region, e.g. by chaotization of orbits in the current sheet upstream of the shock, if the field would be truly three-dimensional. Numerical simulations on particle orbits in such fields would be highly interesting. More generally, we expect that fully three-dimensional simulations would produce additional in-teresting configurations with varying capabilities to acceler-ate particles, especially in the currently ignored azimuthal directions as the shock expands in all directions.
5 Summary and conclusions
We have developed an MHD model of CMEs capable of modeling the dynamics of the CME-initiated shock waves during the first couple of hours of the event, when particles are believed to be accelerated to the highest energies in most of the SEP events. Our simulations show that a non-trivial evolution of the shock properties on coronal field lines oc-curs under even relatively simple coronal conditions. The model runs show that the evolution of parameters most cru-cial to particle acceleration at shocks (compression ratio and obliquity) need to be modeled accurately, rather than just as-suming constant values or over-simplified evolution for these parameters. In this study, we discussed the implications of our MHD simulations by comparing the shock evolution to earlier test-particle simulations of shock acceleration in sim-ilarly evolving magnetic geometries. In future work, we will use the MHD-modeled evolution of the shock parameters as input to our particle acceleration simulations, including the self-generated Alfv´en waves (Vainio and Laitinen, 2007, 2008; Vainio et al., 2009) to study these effects in a self-consistent manner.
Supplementary material related to this article is available online at:
http://www.astrophys-space-sci-trans.net/7/387/2011/ astra-7-387-2011-supplement.zip
Acknowledgements. The Academy of Finland (projects 121650
and 133723) and DAAD (project 50020335) are thanked for financial support.
Edited by: B. Heber
Reviewed by: J. Kleimann and another anonymous referee
References
Cohen, O., Sokolov, I. V., Roussev, I. I., and Gombosi, T. I.: Val-idation of a synoptic solar wind model, Geophys. Res., 113, A03104, doi:10.1029/2007JA012797, 2008.
Cohen, O., Attrill, G. D. R., Schwadron, N. A., Crooker, N. U., Owens, M. J., Downs, C., and Gombosi, T. I.: Numer-ical simulation of the 12 May 1997 CME Event: The role of magnetic reconnection, Geophys. Res., 115, A10104, doi:10.1029/2010JA015464, 2010.
Feng, X., Yang, L., Xiang, C., Wu, S. T., Zhou, Y., and Zhong, D.: Three-dimensional Solar WIND Modeling from the Sun to Earth by a SIP-CESE MHD Model with a Six-component Grid, As-trophys. J., 723, 300–319, doi:10.1088/0004-637X/723/1/300, 2010.
Giacalone, J.: Particle Acceleration at Shocks Moving through an Irregular Magnetic Field, Astrophys. J., 624, 765–772, doi:10.1086/429265, 2005.
Jacobs, C., Poedts, S., Van der Holst, B., and Chan´e, E.: On the effect of the background wind on the evolution of inter-planetary shock waves, Astron. Astrophys., 430, 1099–1107, doi:10.1051/0004-6361:20041676, 2005.
Jacobs, C., van der Holst, B., and Poedts, S.: Comparison between 2.5-D and 3D simulations of coronal mass ejections, Astron. Astrophys., 470, 359–365, doi:10.1051/0004-6361:20077305, 2007.
Kissmann, R., Pomoell, J., and Kley, W.: A central conservative scheme for general rectangular grids, Comp. Phys., 228, 2119 – 2131, doi:10.1016/j.jcp.2008.11.030, 2009.
Liu, Y. C.-M., Opher, M., Cohen, O., Liewer, P. C., and Gom-bosi, T. I.: A Simulation of a Coronal Mass Ejection Propagation and Shock Evolution in the Lower Solar Corona, Astrophys. J., 680, 757–763, doi:10.1086/587867, 2008.
Nakamizo, A., Tanaka, T., Kubo, Y., Kamei, S., Shimazu, H., and Shinagawa, H.: Development of the 3-D MHD model of the so-lar corona-soso-lar wind combining system, Geophys. Res., 114, A07109, doi:10.1029/2008JA013844, 2009.
Reames, D. V.: Particle acceleration at the Sun and in the heliosphere, Space Sci. Rev., 90, 413–491, doi:10.1023/A:1005105831781, 1999.
Riley, P., Linker, J. A., Miki´c, Z., Lionello, R., Ledvina, S. A., and Luhmann, J. G.: A Comparison between Global Solar Magne-tohydrodynamic and Potential Field Source Surface Model Re-sults, Astrophys. J., 653, 1510–1516, doi:10.1086/508565, 2006. Sandroos, A. and Vainio, R.: Particle acceleration at shocks prop-agating in inhomogeneous magnetic fields, Astron. Astrophys., 455, 685–695, doi:10.1051/0004-6361:20054754, 2006. Sandroos, A. and Vainio, R.: Simulation Results for Heavy Ion
Sandroos, A. and Vainio, R.: Reacceleration of Flare Ions in Coro-nal and Interplanetary Shock Waves, Astrophys. J. Suppl., 181, 183–196, doi:10.1088/0067-0049/181/1/183, 2009a.
Sandroos, A. and Vainio, R.: Diffusive shock acceleration to rel-ativistic energies in the solar corona, Astron. Astrophys., 507, L21–L24, doi:10.1051/0004-6361/200913228, 2009b.
Tylka, A. J. and Lee, M. A.: A Model for Spectral and Composi-tional Variability at High Energies in Large, Gradual Solar Parti-cle Events, Astrophys. J., 646, 1319–1334, doi:10.1086/505106, 2006.
Vainio, R. and Laitinen, T.: Monte Carlo Simulations of Coronal Diffusive Shock Acceleration in Self-generated Turbulence, As-trophys. J., 658, 622–630, doi:10.1086/510284, 2007.
Vainio, R. and Laitinen, T.: Simulations of coronal shock acceler-ation in self-generated turbulence, Atmos. Solar-Terr. Phys., 70, 467–474, doi:10.1016/j.jastp.2007.08.064, 2008.