Original Research Article
Analysis of environmental impact on emotional health of people visiting
temples of Vrindavan, India: a qualitative survey
Purva Shoor*, Bhumika Bhatt
INTRODUCTION
Physical environment of pilgrimage and its impact on emotional health is a delicate issue due to cultural and religious constraints. Spirituality and emotions attached with it are rarely critically analyzed and mostly they are preconceived as religious practices and vows without instigating queries about appropriate and safe physical environment. Both the perceived frequency of use and efficacy of environmental strategies are positively related to perceived health. Moreover, the perceived efficacy of
environmental strategies is positively related to life satisfaction in regulating sadness.1
This study proposes to decipher various viewpoints related to the environment of a pilgrimage town in India and its emotional health consequences upon the visitors. We have questioned the impact the environment of temples might have on affect regulation.1 With this situation analysis pertaining to the environment, we can change attitudes of the temple authorities, environmental analysts, and visitors’ perception regarding cleanliness,
ABSTRACT
Background: In this century, blind faith in unhealthy environments is dwindling and more focus on environmental impact on a truly spiritual and emotionally uplifting experience is regarded as most important to contemporary visitors to sacred places. The main objective is to describe the emotional state of people visiting temples of Vrindavan and to describe the viewpoints on environmental factors affecting their emotional health.
Methods: Type of study: a qualitative survey, study population: visitors to temples of Vrindavan. Method of sampling: purposive sampling, sample size: 67 people, study tool: pre-tested, semi-structured questionnaire for interview, data was analyzed using Microsoft Excel spreadsheet, and tabulated.
Results: 82.09% of people interviewed were of the age 18-50 years. Among the visitors all were Indians, and one NRI. Majority interviewed were males. 6 people visiting temple 1 reported feeling annoyed, disturbed and insecure during visit. There were relatively positive responses regarding environmental factors due to religious constraints. Many people reported good conduct of pujaris (temple priests) in all the three temples with quite a few bad comments like professional seekers and greedy. Long queues and no comfort was disliked for all the three temples, however some people expressed no problem with it.
Conclusions: Pilgrims do not critically analyze environmental aspects managed by authorities. They felt spiritual and emotionally aroused and preferred not to comment on not so comfortable experiences. We cannot neglect the rising exceptions to the usual herd of visitors who are on the rise.
Keywords: Vrindavan, Environmental impact, Emotional health, Survey
Department of Community Medicine, Kanti Devi Medical College, Akbarpur, Mathura-Delhi Highway, Mathura, Uttar Pradesh, India
Received: 10 May 2019
Revised: 06 July 2019
Accepted: 08 July 2019
*Correspondence:
Dr. Purva Shoor,
E-mail: [email protected]
Copyright: © the author(s), publisher and licensee Medip Academy. This is an open-access article distributed under the terms of the Creative Commons Attribution Non-Commercial License, which permits unrestricted non-commercial use, distribution, and reproduction in any medium, provided the original work is properly cited.
security, access, linkage, and other factors to create a good quality emotionally healthy experience.
Objectives
To describe the emotional state of people visiting temples of Vrindavan.
To describe the viewpoints on environmental factors affecting their emotional health.
METHODS
Type of study: a qualitative survey. Method of sampling: purposive sampling. Selection criteria
All visitors were eligible, who were above 15 years of age, and who gave their consent to spare some time to conduct an in depth interview.
Sample size
There are around 5 lakh people visiting temples of Vrindavan, a temple town in India, every year.2 If we assume that influx of visitors is distributed equitably, we get around 1400 people who might in the least number, visited the temples on a single day. There are 13 hours of the day when the temples are open for visits, so by dividing 1400 with 13hrs, we get 107 people who visited any one of the temple in any particular hour. If 2% of these people were assumed to be retreating from visit at any hour of the day from any of the three temples, we got 21.4 people from each temple. This was calculated as 64.2 people or 64 people. When we actually interviewed, this being a survey, we were able to catch the attention of a few people extra in temple 1 and 3 whereas only 17 people in temple 2. Our final sample size was 67 people. Method of collection of data
The interviewer visited 3 temples in Vrindavan and noted viewpoints using a pre-tested questionnaire and informed the subjects that the interviewer was not a representative of police, press or government and the information shall be kept confidential. The questionnaire was translated in Hindi for interviewing the visitors. The temples were selected out of the list in the official website of Mathura: mathura.nic.in. They were as follows:
Shri Banke Bihari
Iskcon Temple
Prem Mandir
Two visits were organized for each temple. Data collection days had been divided into 3 visits in November 2017 followed by 3 visits in December 2017. Approximately 10-12 people retreating from darshan
were interviewed at each visit. For each temple, time of data collection was selected as per convenience from 9-10 am or 4-5pm.
Time period: November 2017 to December 2017. Study tool
A pre-tested, semi-structured questionnaire was used for the study which had been translated in Hindi.
Method of analysis
Microsoft Excel spreadsheet was used for data entry and descriptive statistics.
RESULTS
In this study we interviewed 27 (40.30%) people visiting temple1, 17 (25.37%) visiting temple 2 and 23 (34.33%) pilgrims visiting temple 3.
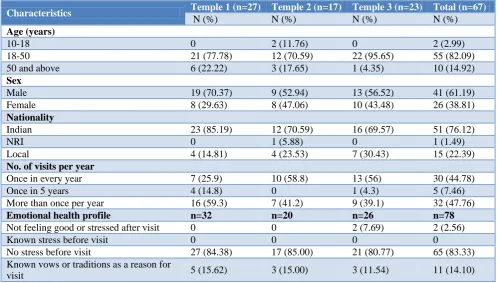
According to Table 1, maximum numbers of visitors interviewed in the temples were of the age 18-50 years. 10 people (14.92%) who were interviewed were of the age 50 years and above, and, 2 people (2.99%) were below 18 years of age while remaining 55 people (82.09%) were in the age group of 18-50 years.
41 people (61.19%) interviewed were males and 26 (38.81%) were females. All people interviewed were Indians from almost all states like Gujarat, Orissa, Rajasthan, Haryana, Delhi, Punjab, J and K and UP. One visitor to temple 2 was an NRI. 15 people belonged to local residents of Mathura of whom 7 were interviewed in Temple 3.
Table 1 suggests, out of 27 people visiting temple 1, 59.3% visited more than once per year, whereas 25.9% visited once per year. In contrast, 56% of temple 3 visitors were frequent for once in a year and 39.1% more than once in a year. Temple 2 showed similarity in number of visits per year to temple 3; 58% once in a year and 41.2% more than once in a year. There have been reported less frequent visits like once in five years in temple 1 and 3.
As shown in Table 1, the emotional health profile of visitors was found good subjectively as only 2 people (2.56%) reported not feeling good after their visit. None of the visitors mentioned any known stress or problems existing before their visit. Maximum visitors (65 in number, 83.33%) reported that they had no stress before the visits. Some people (11 in number, 14.10%) mentioned certain vows and traditions as a reason for visit.
and two responses as annoyed. One response for temple 3 was as annoyed. 2 responses were of no comments, and 1 response was peace for the emotional experience of
visitors to temple 1. Similarly, peace and stress relief were other comments described by people visiting temple 3.
Table 1: Distribution depicting profile of visitors to temples.
Characteristics Temple 1 (n=27) Temple 2 (n=17) Temple 3 (n=23) Total (n=67)
N (%) N (%) N (%) N (%)
Age (years)
10-18 0 2 (11.76) 0 2 (2.99)
18-50 21 (77.78) 12 (70.59) 22 (95.65) 55 (82.09)
50 and above 6 (22.22) 3 (17.65) 1 (4.35) 10 (14.92)
Sex
Male 19 (70.37) 9 (52.94) 13 (56.52) 41 (61.19)
Female 8 (29.63) 8 (47.06) 10 (43.48) 26 (38.81)
Nationality
Indian 23 (85.19) 12 (70.59) 16 (69.57) 51 (76.12)
NRI 0 1 (5.88) 0 1 (1.49)
Local 4 (14.81) 4 (23.53) 7 (30.43) 15 (22.39)
No. of visits per year
Once in every year 7 (25.9) 10 (58.8) 13 (56) 30 (44.78)
Once in 5 years 4 (14.8) 0 1 (4.3) 5 (7.46)
More than once per year 16 (59.3) 7 (41.2) 9 (39.1) 32 (47.76)
Emotional health profile n=32 n=20 n=26 n=78
Not feeling good or stressed after visit 0 0 2 (7.69) 2 (2.56)
Known stress before visit 0 0 0 0
No stress before visit 27 (84.38) 17 (85.00) 21 (80.77) 65 (83.33) Known vows or traditions as a reason for
visit 5 (15.62) 3 (15.00) 3 (11.54) 11 (14.10)
Table 2: Distribution depicting responses of visitors regarding their emotional experience inside the temples.
Response No. in temple 1 No. in temple 2 No. in temple 3 Total
Disturbed 3 0 0 3
Insecure 1 0 0 1
Satisfied 20 17 10 47
Spiritually aroused 20 13 13 46
Annoyed 2 0 1 3
Any other 3 (1-peace, 2-no comments) 0 2 (1-peace, 1-stress relief) 5
Total 49 30 26 105
Table 3: Distribution showing responses regarding mannerisms of local pujaris.
Response Grade 1, 2, 3 Grade 4, 5 No comments
N (%) N (%) N (%)
Temple 1 (n=27)
Good conduct 7 (25.93) 18 (66.67) 2 (7.40)
Greedy 13 (48.15) 8 (29.63) 6 (22.22)
Not fair 10 (37.04) 9 (33.33) 8 (29.63)
Sympathetic 4 (14.81) 14 (51.85) 9 (33.33)
Any other 0 1-professional seekers (3.70) 26 (96.3)
Temple 2 (n=17)
Good conduct 0 15 (88.24) 2 (11.76)
Greedy 14 (82.35) 2 (11.76) 1 (5.89)
Not fair 10 (58.82) 6 (35.29) 1 (5.89)
Sympathetic 0 16 (94.12) 1 (5.88)
Any other 0 0 17 (100)
Response Grade 1, 2, 3 Grade 4, 5 No comments
N (%) N (%) N (%)
Temple 3 (n=23)
Good conduct 1 (4.34) 16 (69.57) 6 (26.09)
Greedy 10 (43.48) 2 (8.7) 11 (47.82)
Not fair 8 (34.78) 4 (17.4) 11 (47.82)
Sympathetic 5 (21.74) 7 (30.43) 11 (47.83)
Any other 0 1-not efficient; (4.35) 22 (95.65)
(n=total number of responses).
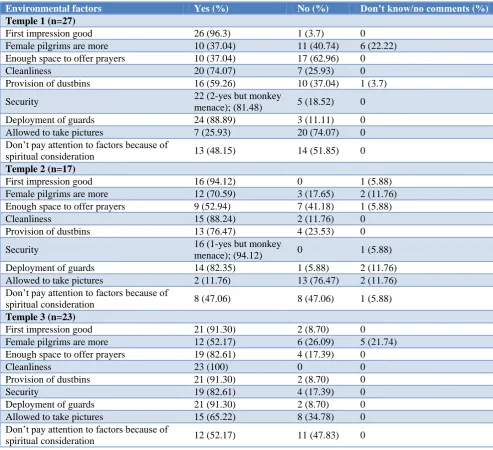
Table 4: Distribution describing comfort, security and image of temples.
Environmental factors Yes (%) No (%) Don’t know/no comments (%) Temple 1 (n=27)
First impression good 26 (96.3) 1 (3.7) 0 Female pilgrims are more 10 (37.04) 11 (40.74) 6 (22.22) Enough space to offer prayers 10 (37.04) 17 (62.96) 0
Cleanliness 20 (74.07) 7 (25.93) 0
Provision of dustbins 16 (59.26) 10 (37.04) 1 (3.7)
Security 22 (2-yes but monkey
menace); (81.48) 5 (18.52) 0 Deployment of guards 24 (88.89) 3 (11.11) 0 Allowed to take pictures 7 (25.93) 20 (74.07) 0 Don’t pay attention to factors because of
spiritual consideration 13 (48.15) 14 (51.85) 0
Temple 2 (n=17)
First impression good 16 (94.12) 0 1 (5.88) Female pilgrims are more 12 (70.59) 3 (17.65) 2 (11.76) Enough space to offer prayers 9 (52.94) 7 (41.18) 1 (5.88)
Cleanliness 15 (88.24) 2 (11.76) 0
Provision of dustbins 13 (76.47) 4 (23.53) 0
Security 16 (1-yes but monkey
menace); (94.12) 0 1 (5.88) Deployment of guards 14 (82.35) 1 (5.88) 2 (11.76) Allowed to take pictures 2 (11.76) 13 (76.47) 2 (11.76) Don’t pay attention to factors because of
spiritual consideration 8 (47.06) 8 (47.06) 1 (5.88)
Temple 3 (n=23)
First impression good 21 (91.30) 2 (8.70) 0 Female pilgrims are more 12 (52.17) 6 (26.09) 5 (21.74) Enough space to offer prayers 19 (82.61) 4 (17.39) 0
Cleanliness 23 (100) 0 0
Provision of dustbins 21 (91.30) 2 (8.70) 0
Security 19 (82.61) 4 (17.39) 0
Deployment of guards 21 (91.30) 2 (8.70) 0 Allowed to take pictures 15 (65.22) 8 (34.78) 0 Don’t pay attention to factors because of
spiritual consideration 12 (52.17) 11 (47.83) 0
The mannerisms of local priests, called pujaris or pundits are described in Table 3. During the interview, we asked the visitors to grade each comment about the priests from 1 to 5. Grade 1 was least applicable and 5 the most applicable grade. In temple 1, out of 27 responses for good conduct, 66.67% marked grade 4 or grade 5. 25.93% responses showed that the conduct of priests was not as good. There were maximum low grades for greed,
were sympathetic, and there was one other response telling that they were mere professional seekers.
There were more positive responses about mannerisms of priests in temple 2 and 3, which can be attributed to better temple management and ambience of these temples. There was one other comment in temple 3 describing the
priests as not efficient. There were 51 no comments in temple 1, 22 in temple 2 and 61 in temple 3. This finding may suggest that people are either religiously constrained as not to provide a negative comment or are satisfied, but more so because they do not bother so much and take for granted the mannerisms of priests inside the temples as natural.
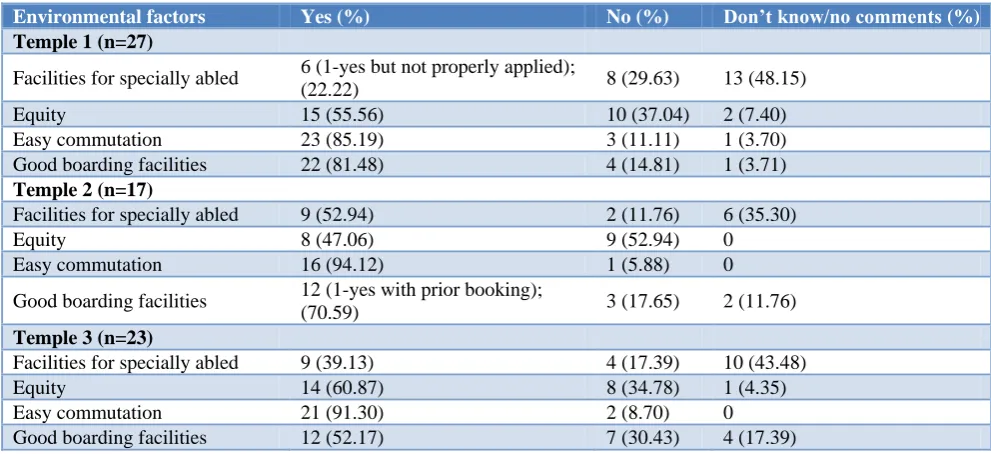
Table 5: Distribution describing access and linkage.
Environmental factors Yes (%) No (%) Don’t know/no comments (%)
Temple 1 (n=27)
Facilities for specially abled 6 (1-yes but not properly applied);
(22.22) 8 (29.63) 13 (48.15)
Equity 15 (55.56) 10 (37.04) 2 (7.40)
Easy commutation 23 (85.19) 3 (11.11) 1 (3.70) Good boarding facilities 22 (81.48) 4 (14.81) 1 (3.71)
Temple 2 (n=17)
Facilities for specially abled 9 (52.94) 2 (11.76) 6 (35.30)
Equity 8 (47.06) 9 (52.94) 0
Easy commutation 16 (94.12) 1 (5.88) 0
Good boarding facilities 12 (1-yes with prior booking);
(70.59) 3 (17.65) 2 (11.76)
Temple 3 (n=23)
Facilities for specially abled 9 (39.13) 4 (17.39) 10 (43.48)
Equity 14 (60.87) 8 (34.78) 1 (4.35)
Easy commutation 21 (91.30) 2 (8.70) 0
Good boarding facilities 12 (52.17) 7 (30.43) 4 (17.39)
For depicting comfort, security and image of temples (Table 4) we enlisted certain characteristics like first impression, enough space for praying, number of female pilgrims, security, deployment of guards, cleanliness, provision of dustbins, taking pictures and even an emotional aspect that whether due to spiritual attachment, these characteristics were never looked upon seriously or critically?. We found that these characteristics had similar distribution across all the three temples, with positive perception. Monkey menace hampered security according to 2 comments in temple1, and 1 comment in temple 2. Many people commented (13 in temple 1, 8 in temple 2 and 12 in temple 3) that they do not pay attention to these factors due to spiritual attachment. The percentage varied from 47 to 52 for not paying attention which showed that the people who do not consider environmental conditions during visit were just half of the whole.
Table 5 describes access and linkage with positive viewpoints regarding visit to all three temples. Facilities for specially abled in temple 1 was perceived by 22.22% visitors and no comments was the response by 48.15%. In temple 2, 52.94% perceived provision for visitors with disability and 35.30% no comments for the same. In temple 3, 39.13% responded for availability of such facilities like wheel chairs and 43.48% had no comments. Equity of access to darshan in temples by people of all socio-economic classes and their boarding and commuting facilities were found to be fairly good. There
were fair responses to equity. For boarding and commuting, visitors had responded positively with good comments irrespective of temples where we interviewed them.
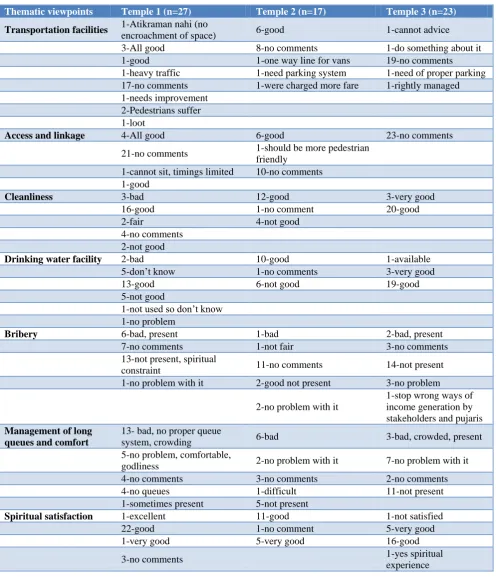
As shown in Table 6, there were certain viewpoints shared regarding various environmental factors. Temple 3 was the first to be located when one enters the temple town from the highway NH-2 and had a very spacious, newly constructed infrastructure. It is a newly planned temple, hence people visiting were found to be happier about rightly managed transportation. Whereas, temple 1 and 2 were primitive and embraces huge emotional attachment among the visitors, there were uncomfortable parking and access facilities with heavy load of visitors in congested streets which might have elicited negative remarks as described in Table 6.
Table 6: Viewpoints and suggested environmental changes by temple visitors.
Thematic viewpoints Temple 1 (n=27) Temple 2 (n=17) Temple 3 (n=23)
Transportation facilities 1-Atikraman nahi (no
encroachment of space) 6-good 1-cannot advice 3-All good 8-no comments 1-do something about it 1-good 1-one way line for vans 19-no comments 1-heavy traffic 1-need parking system 1-need of proper parking 17-no comments 1-were charged more fare 1-rightly managed 1-needs improvement
2-Pedestrians suffer 1-loot
Access and linkage 4-All good 6-good 23-no comments
21-no comments 1-should be more pedestrian friendly
1-cannot sit, timings limited 10-no comments 1-good
Cleanliness 3-bad 12-good 3-very good
16-good 1-no comment 20-good
2-fair 4-not good
4-no comments 2-not good
Drinking water facility 2-bad 10-good 1-available
5-don’t know 1-no comments 3-very good
13-good 6-not good 19-good
5-not good
1-not used so don’t know 1-no problem
Bribery 6-bad, present 1-bad 2-bad, present
7-no comments 1-not fair 3-no comments 13-not present, spiritual
constraint 11-no comments 14-not present 1-no problem with it 2-good not present 3-no problem
2-no problem with it
1-stop wrong ways of income generation by stakeholders and pujaris
Management of long queues and comfort
13- bad, no proper queue
system, crowding 6-bad 3-bad, crowded, present 5-no problem, comfortable,
godliness 2-no problem with it 7-no problem with it 4-no comments 3-no comments 2-no comments 4-no queues 1-difficult 11-not present 1-sometimes present 5-not present
Spiritual satisfaction 1-excellent 11-good 1-not satisfied
22-good 1-no comment 5-very good
1-very good 5-very good 16-good
3-no comments 1-yes spiritual
experience
DISCUSSION
Du Plessis et al found that the more frequent the visits, the more the environmental impacts of tourism were perceived. 3 In contrast to this study, in our survey, the viewpoints noted had no dependence upon frequency of visits. The negative responses perceived were only due to
benefits.4 Similarly, in our study the local inhabitants gained income through shops, eateries and priests employed in temples, revenue was gained by managing darshan and the mannerisms of pujaris was found to affect the visitors who had mixed emotions about them. Quite a few judged them to be greedy, unfair while some admitted that the pujaris were sympathetic and had good conduct.
According to a study conducted by Priyanka et al the pilgrimage affected the environment with problems such as accumulation of huge amount of non-biodegradable waste (plastic and glass cups, polythene etc.), water pollution (due to inadequate sewerage facilities), deforestation due to harvesting of firewood, and destruction of flora and fauna were reported.5 Another problem was related to overcrowding, congestion and stampedes which usually got a lot of media attention.5 Mathura has become a municipality recently and there were no comments regarding environmental sanitation, people’s viewpoints were not directed towards garbage accumulation, open drains, spitting, trash or unhygienic toilet facilities.
CONCLUSION
Pilgrimage is holy and people visit the temples to fulfill their vows and traditions without critically analyzing the surrounding environment. The visitors felt spiritual and emotionally aroused and preferred not to comment on not so comfortable aspects of the environment, they were momentarily agitated but acclimatized themselves to age old norms and conditions. But we cannot neglect the other few who did not make controversial comments and some spoke to bring about a better environment. Such will be the majority of the whole in coming years.
ACKNOWLEDGEMENTS
We thank our then HOD Dr. R. K. Pal for his encouragement to conduct this study. We are grateful for the support of HR Department of medical college that
arranged a vehicle for our visits to the temples of Vrindavan. This study would not have been possible without the support of our staff Mr. Ankur (statistician) and Mr. Raj Kumar (computer operator) of Community Medicine Department who accompanied us and helped in conducting the interview at the temples.
Funding: No funding sources Conflict of interest: None declared
Ethical approval: The study was approved by the Institutional Ethics Committee
REFERENCES
1. Korpela M, Pasanen T, Repo V, Hartig T, Staats H, Mason M, et al. Stigsdotter, Catharine Ward Thompson- Environmental Strategies of Affect Regulation and Their Associations With Subjective Well-Being. Frontiers in Psychol. 2018;9:562. 2. Uttar Pradesh tourism, Government of Uttar
Pradesh. Available at http://mathura.gov.in/en/ destination. Last Accessed on: July 15th 2019. 3. du Plessis ML, van der Merwe P, Saayman M.
Environmental factors affecting tourists’ experience in South African national parks. African J Bus Manag. 2012;6(8):2911-8.
4. Barkauskas V, Jasinskas E. Analysis of macro environmental factors influencing the development of rural tourism: Lithuanian case. Procedia Soc Behav Sci. 2015;213:167-72.
5. Priyanka P, Dandapani S, Mahajan DM. Pilgrimage and the environment: challenges in a pilgrimage centre in Maharashtra, India. Int J Environ Sci. 2013;3(6):2269-77.