Absorption of nutrients, growth and nutritional disorders
resulting from ammonium toxicity in rice and spinach
plants
Gilmara Pereira da Silva*, Renato de Mello Prado, Ricardo Perri Soares Ferreira
Universidade Estadual Paulista Júlio de Mesquita Filho, Access Road Prof. Paulo Donato Castellane, Jaboticabal, SP, Brazil
INTRODUCTION
The supply of N in different ionic forms has complex effects on the growth and metabolism of plants (Guo et al., 2012), and may result in distinct physiological responses (Bartelheimer and Poschlod, 2014), for example ammonium nutrition can cause toxicity in plants at high concentrations.
The harmful effects of excess ammonium in plants can result in decreased dry matter accumulation of the shoot and also the roots (Guimarães et al., 2014), chlorosis of the leaves associated with lower chlorophyll levels (Jampeetong et al., 2012), increasing cell death (Bittsánszky et al., 2015). In addition to this is the fact that ammonium toxicity decreased the levels of leaf macronutrients, contributing to reduced plant growth (Helali et al., 2010).
These facts may be related in some cultures that present different responses. Thus, the ammonium concentration
in the nutrient solution that induced a 10% reduction in dry matter varies with the species, including 2.0 mmol L-1
in spinach (Lin et al., 2014) and the pea cultivar Rondo (Dominguez-Valdivia et al., 2008), 8.0 mmol L-1 in the
tomato cultivar Moneymaker (Borgognone et al., 2013), 6.0 mmol L-1 in the rice cultivar Guidan 4 and 15 mmol L-1
in the cultivar Wuyunjing 23 (Chen et al., 2013).
Thus, plant species have different tolerance to excessive N (Horchani et al., 2011), and even within the same species there are differences between varieties with regards to behavior of plants under ammonium stress (Cruz et al., 2011).
It is important to evaluate the effects of ammonium toxicity on physiology and nutrition, as well as its effects on dry matter reduction which may vary with the species. This is because excess ammonium can reduce cation absorption, cause degradation of chlorophyll and reduce height; leaf area is reflected in losses of root and shoot Excess nitrogen in the ammonium form may induce different nutritional disorders in plants depending on the species cultivated. The present study sought to evaluate the accumulation of nutrients, growth and visual symptoms in rice and spinach plants in function of the ammonium concentrations. Two experiments were performed with rice and spinach plants in a greenhouse, at the Universidade Estadual
Paulista Júlio de Mesquita Filho, Campus of Jaboticabal-SP, Brazil. In each experiment five ammonium concentrations were used (10, 20, 40, 80 and 100 mmol L-1), arranged in a randomized block design with five repetitions. The effects of excess ammonium were studied on
the green color index, electrolyte leakage, accumulation of N, Mg, K and Ca in the shoots, leaf area, height, dry matter of root, shoots and whole plant, and characterization of the visual symptoms of toxicity in the plants. These effects of excess ammonium reported above
are reflected in the production of plant dry matter, with a linear decrease in dry matter of the roots, shoots and whole plant. Excess
ammonium in the nutrient solution decreased the accumulation of dry matter due to reduced leaf area and increased cellular electrolyte leakage which induced symptoms characteristic of ammonium toxicity in both species, and also decreased uptake of Ca, Mg and K in rice plants and only Ca in spinach plants.
Keywords: Abiotic stress; Ammonium nutrition; Plant species; Oryza sativa; Spinacia oleracea
A B S T R A C T
http://www.ejfa.me/
R E G U L A R A R T I C L E
*Corresponding author:
Gilmara Pereira da Silva, Universidade Estadual Paulista Júlio de Mesquita Filho, Access Road Prof. Paulo Donato Castellane, Jaboticabal, SP, Brazil, +55(16)3209-7406. E-mail: [email protected]
dry matter production as well as characteristic visual symptoms.
It was therefore hypothesized that the rice and spinach species will provide different responses of reduced dry matter due to excess ammonium. The present study sought to evaluate the accumulation of nutrients, growth and visual symptoms in rice and spinach plants in function of the ammonium concentrations.
MATERIAL AND METHODS
The study was developed in a greenhouse of the Universidade Estadual Paulista Júlio de Mesquita Filho - Campus of Jaboticabal-SP, Brazil (21º 15’ 22’’ S and 48º 18’ 58” W), from February to May 2015, by means of a hydroponic cultivation system; two experiments were conducted, the first with rice plants, cultivar IAC 203, and the second with spinach plants, cultivar New Zealand.
The treatments consisted of five ammonium concentrations (10, 20, 40, 80 and 100 mmol L-1), arranged in a randomized
block design, with five repetitions. For the experiment with rice and spinach, each experimental unit consisted of three and two seedlings, respectively, grown in a polypropylene recipient.
Planting of the rice and spinach plants was carried out in Styrofoam trays of 200 cells filled with substrate. The nutrient solution proposed by Hoagland and Arnon (1950) was used, with modification to the source of iron from Fe-EDTA to Fe-EDDHMA, and the nitrogen source used to compose the treatments was ammonium chloride, maintaining the pH value of the nutrient solution between 5.5 and 6.0.
Days after emergence the rice seedlings were transplanted into polypropylene pots with a volume of 1.7 dm3 (upper
diameter: 12 cm, lower diameter: 10 cm; height: 20 cm), filled with bioplant® commercial substrate composed of pine and coconut fibers. From then on, 50 mL of the nutrient solution were used for 15 days after transplanting (DAT). After this period the treatments were initiated by applying a volume of 100 mL until 35 DAT, when the experiment was disassembled.
Spinach plants were transplanted at 36 days after sowing to polypropylene pots with volume of 1.7 dm3, applying
50 mL of the nutrient solution diluted to 10% of ionic strength up to 6 DAT, 20% from 7 to 14 DAT and finally 100% of the nutrient solution from 15 DAT to 17 DAT. At 18 DAT the treatments were initiated with application of 100 mL of this same solution until 30 DAT, followed by
200 mL from 31 DAT to 41 DAT. At 42 DAT, 300 mL of the solution was applied and at 46 DAT 500 mL was applied until 50 DAT when the experiment was disassembled.
The bottom of the pots had a collector recipient to capture the nutrient solution, avoiding losses. Recovery of the nutrient solution and new applications were performed in the early morning.
During the experimental period, descriptions of the symptoms of ammonium toxicity were reported daily, along with images of the plants and dates of each observation after application of the treatments.
At the onset of symptoms characteristic of ammonium toxicity in plants, the following assessments were performed: i) Plant height, measured from the base to the last fully expanded leaf with a ruler; ii) green color index, performing measurements on the third developed leaf from the apex, where readings were made in the middle third of the leaves, between 8:00 and 10:00 am, by a leaf chlorophyll content meter (CCM-200, Opti-sciences®); iii) leaf area, collecting all leaves from the plant and obtaining measurements with the LI-3100 Area Meter® device; iv) Electrolyte leakage, estimated by the electrolyte leakage rate using samples with 200 mg of leaf discs from each treatment, exposed to 20 mL of deionized water for one hour. Then, electric conductivity (µS m-1) of the extract (L
1) was determined
in a conductivity meter (Analyser, mod. 650, São Paulo, Brazil) and the same leaf segments were again placed in boiling water for 2 h. After reaching room temperature, a reading was obtained (L2) for the final conductivity (μS m-1) of the extract. The rate of leaf membrane damage
(%LMD) was established by the following relationship: %LMD = (L1/L2) x 100 (Dionisio-Sese and Tobita, 1998); v) dry matter of shoots, roots and the whole plant, where plants were separated into shoots and roots, stored in paper bags and taken to the laboratory, followed by washing with distilled water and drying in an oven with forced air circulation at 65ºC until reaching constant weight.
After drying the plant material the individual shoot and root dry matters were obtained, followed by grinding in a Willey mill, and analysis of plant tissue was performed to determine the levels of N, Mg, K and Ca according to the method described by Bataglia et al. (1983), along with calculation of the accumulation of these nutrients in the shoots.
The data obtained were submitted to analysis of variance using the F-test at 5% probability. In the case of significance for the NH4+ concentrations, a polynomial regression
SISVAR, version 5.3 BETA (Ferreira, 2011), was used and graphs were obtained using the program Microsoft Excel Starter 2010 in Windows 7 Starter.
RESULTS AND DISCUSSION
Rice
Excess N in its ammonium form in the nutrient solution promoted a linear decrease in the green color index in function of the ammonium concentrations (Fig 1a). A similar result was found by some authors who reported that excess ammonium caused a lower green color index in the leaves of Brassica napus (Hu et al., 2015) and Manihote suculenta (Cruz et al., 2014). This is because the excess ammonium caused a decrease in chlorophyll content (Wang et al., 2010), with changes to the leaf structure (Lopes and
Araus, 2006) and induction of leaf chlorosis and necrosis (Li et al., 2014).
The symptoms of ammonium toxicity are explained by the fact that the high ammonium concentrations in plants promoted increased electrolyte leakage in the cell (Fig. 1b), which induced injuries to the plasma membrane and the cell wall structure (Li et al., 2014).
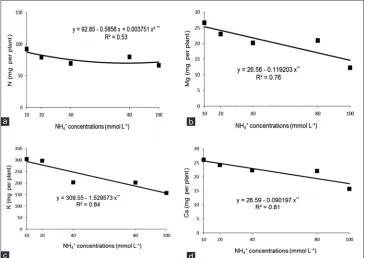
Moreover, excessive ammonium affects the nutritional balance of cations despite promoting quadratic increases in N accumulation to the ammonium concentration of 78 mmol L-1 (Fig. 2a), however there was a linear decrease
in accumulation of Mg, K and Ca (Fig. 2b-d).
Nutritional imbalance caused by excess ammonium occurs by competition of Mg, K and Ca for the same absorption
Fig 1. Green color index (a) and electrolyte leakage (b) in rice plants in function of the ammonium concentrations, Jaboticabal-SP, Brazil, 2015. **Significant at 1% probability.
b a
Fig 2. Accumulation of N (a), Mg (b), K (c) and Ca (d) in rice plants in function of the ammonium concentrations. Jaboticabal-SP, Brazil, 2015. **Significant at 1% probability.
d c
sites (Marschner, 2012). This ionic imbalance occurs due to the increased influx of NH4+ and efflux of cations in
the plasma membrane, with extrusion of these ions to the cell vacuole, which may cause symptoms of nutritional deficiencies in the plants (Mendonza-Villareal et al., 2015).
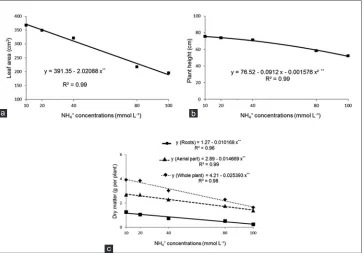
Another event observed from excessive ammonium in the nutrient solution was a linear decrease in leaf area growth (Fig. 3a) and in plant height, where this occurred when the ammonium concentration was greater than 29 mmol L-1
(Fig. 3b). The reduction in plant growth resulted from the harmful effect of excess ammonium on the green color index (Fig. 1a), electrolyte leakage in the cell (Fig. 1b) and the nutritional imbalance of cations (Fig. 2).
These effects of excess ammonium reported above are reflected in the production of plant dry matter, with a linear decrease in dry matter of the roots, shoots and whole plant (Fig. 3c). It was observed that at the ammonium concentration of 17 mmol L-1 there was a 10% reduction in
dry matter of rice plants, where a similar fact was observed by Chen et al. (2013) in rice plants (cultivar Wuyunjing 23) at a concentration of 15 mmol L-1 and a much lower
concentration was found in cultivar Guidan 4 (6.0 mmol L-1
ammonium), which was little tolerant to ammonium.
The increased tolerance to ammonium observed in the rice plants of this work was possibly due to the plant age at the time of applying the treatments, because plants were subjected to ammonium concentrations at 30 days after
emergence, and in the cited work rice plants were subjected to treatment with ammonium at 14 days after emergence. This corroborated with Vollbrecht et al. (1989) who reported that tolerance of plants to ammonium toxicity depends on the development stage of the plant subjected to cation excess in the nutrient solution.
An additional hypothesis attributed to the cultivar studied and in agreement with Cruz et al. (2011), indicates that the genetic factor has a strong effect on the tolerance to ammonium toxicity of plants.
From the correlation studies of dry matter and the variables analyzed it was observed that ammonium toxicity hampered dry matter accumulation due to decreased height (r=0.86**), leaf area (r=0.90**) and reduced absorption of Ca (r=0.85**), Mg (r=0.84**), K (r=0.93**), and increased electrolyte leakage (r=-0.96**).
The harmful effects of ammonium on the plants described above resulted in visible symptoms that, as of the fifth day after applying the treatments, lead to the appearance of chlorosis from the tip to the base of the old leaf, followed by leaf necrosis and plant death at the ammonium concentration of 100 mmol L-1 (Fig 4). Other authors also
reported visible symptoms of ammonium toxicity in plants, with the appearance of chlorosis, necrosis and in cases of severe toxicity even plant death (Li et al., 2014; Jampeetong et al., 2012; Wong, 2005).
Fig 3. Leaf area (a), plant height (b) and dry matter of the roots, shoots and whole plant (c) in rice plants in function of the ammonium concentrations. c
Spinach
As a result of excess ammonium in the nutrient solution, the green color index increased linearly with the ammonium concentrations (Fig. 5a). Guimarães et al. (2014) also verified an increase in green color index for the eucalyptus clone AEC0144 at the ammonium concentration of 100 mmol L-1.
Another event observed, resulting from the ammonium excess in the nutrient solution, was a linear increase in electrolyte leakage of the cell (Fig. 5b). Excess ammonium can cause damage to the physical integrity of the plant cell membranes. These effects occur due to membrane damage and rupture of the cell wall, causing increased cellular electrolyte leakage (Kochanová et al., 2014).
After causing changes to the green color index and membrane integrity, excess ammonium affected the nutritional balance of cations, resulting in a quadratic increase in the accumulation of N, Mg and K up to concentrations of 54, 50 and 41 mmol L-1 of ammonium,
respectively (Fig. 6a-c). However, the accumulation of Ca showed a linear decrease in function of the ammonium concentration (Fig 6d). Helali et al. (2010) reported that
there is competition and lower cation absorption in plants nourished only with ammonium as a nitrogen source, as well as some of the fundamental causes that result in reduced plant growth and therefore reduced production.
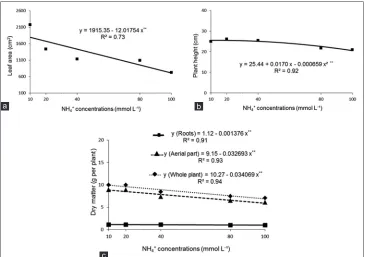
It was also observed that the ammonium concentrations provoked a linear reduction in leaf area (Fig. 7a); reductions in plant height were noted for ammonium concentrations exceeding 13 mmol L-1 (Fig. 7b). In addition to these
harmful effects of excess ammonium were increased cellular electrolyte leakage (Fig. 5b) and nutritional imbalance (Fig. 6).
In relation to the plant dry matter, excess ammonium caused a linear decrease in dry matter of the roots, shoots and whole plant (Fig. 7c), and the ammonium concentration of 34 mmol L-1 was responsible for reducing the dry matter
of the whole plant by 10%. A similar result was observed by Lin et al. (2014) in spinach plants at a concentration of 2.0 mmol L-1 ammonium.
Spinach plants in the present study showed a higher tolerance to ammonium due to the cultivar used; this has been confirmed in literature and Cruz et al. (2011) stated that the genetic factor has a strong effect on the tolerance of plants to ammonia toxicity. Another hypothesis is the plant age at the time of applying the ammonia treatment, because in this work ammonium application was initiated at 54 days after emergence due to the slow plant growth; however in the study described above the ammonium application occurred at 14 days after plant emergence. This is in agreement with Vollbrecht et al. (1989) who reported that the tolerance of plants to ammonium toxicity can be attributed to the plant development stages.
Other authors noted that for the same percent reduction in dry matter, the ammonium concentration in the nutritive solution must be 2.0 mmol L-1 (pea cultivar Rondo)
(Domínguez-Valdivia et al., 2008) and 8.0 mmol L−1 (tomato cultivar Moneymaker) (Borgognone et al., 2013).
Fig 4. Photos illustrating the visible symptoms of ammonium toxicity in rice plants in the initial phase (a) and final phase (b) Jaboticabal-SP, Brazil, 2015.
b a
Fig 5. Green color index (a) and electrolyte leakage (b) in spinach plants in function of the ammonium concentrations, Jaboticabal-SP, Brazil, 2015. **Significant at 1% probability.
Thus, plant species have different tolerances to excess N (Horchani et al., 2011).
From correlation studies of dry matter and the variables analyzed, excess ammonium reduced dry matter accumulation due to the reduced leaf area (r=0.79**),
in electrolyte leakage (r=-0.82**) with ammonium application.
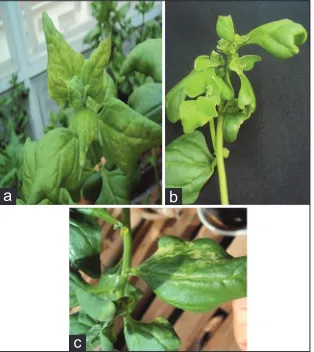
Due to the harmful effects of excess ammonium described above, at sixteen days after application of the treatments visual symptoms of ammonium toxicity were noted, with
Fig 6. Accumulation of N (a), Mg (b), K (c) and Ca (d) in spinach plants in function of the ammonium concentrations, Jaboticabal-SP, Brazil, 2015. **Significant at 1% probability.
d c
b a
Fig 7. Leaf area (a), height (b) and dry matter of the roots, shoots and whole plant (c) in spinach plants in function of the ammonium concentrations, Jaboticabal-SP, Brazil, 2015. **Significant at 1% probability.
c
new leaves, followed by leaf necrosis and visible symptoms of Ca deficiency (Fig. 8).
The Ca deficiency observed in this study possibly occurred due to reduced calcium accumulation in plants as a function of the increasing ammonium concentration in the nutrient solution (Fig. 6d). This is probably related to the fact that Ca absorption occurs only in young roots, specifically in the meristematic zones where endoderm cells are not yet suberized (Marschner, 2012), and the excess ammonium causes injuries to these root structures, decreasing their development (Britto and Kronzucker, 2002; Liu et al., 2013).
CONCLUSION
Excess ammonium in the nutrient solution decreased the absorption of Ca, Mg and K in rice plants and only Ca in spinach plants. It also decreased the accumulation of dry matter due to the decrease in leaf area and increase of electrolyte leakage of the cell, inducing symptoms characteristic of ammonium toxicity in the two plant species.
Author contributions
G.P.S.: Experiment driving and writing work; R.M.P.: Writing and correction work; R.P.S.F: Experiment driving and writing work.
REFERENCES
Bartelheimer, M and P. Poschlod. 2014. The response of grassland species to nitrate versus ammonium coincides with their pH optima. J. Veg. Sci. 25: 760-770.
Bataglia, O.C., A. M. C. Furlani, J. P. F. Teixeira, P. R. Furlani and J. R. Gallo. 1983. Métodos de Análise Química de Plantas.
Campinas, Instituto Agronômico, Boletim Técnico.
Bittsánszky, A., K. Pilinszky, G. Gyulai and T. Komives. 2015. Overcoming ammonium toxicity. Plant Sci. 231: 184-190. Borgognone, D., G. Colla, Y. Rouphael, M. Cardarelli, E. Rea and D.
Schwarz. 2013. Effect of nitrogen form and nutrient solution pH on growth and mineral composition of self-grafted and grafted tomatoes. Sci. Hortic. 149: 61-69.
Britto, D. T and H. J. Kronzucker. 2002. NH4+ toxicity in higher plants:
A critical review. J. Plant Physiol. 159: 567-584.
Chen, G., S. Guo, H. J. Kronzucker and W. Shi. 2013. Nitrogen use efficiency (NUE) in rice links to NH4+ toxicity and futile NH
4+
cycling in roots. Plant Soil. 369: 351-363.
Cruz, C., M. D. Domínguez-Valdivia, P. M. Aparicio-Tejo, C. Lamsfus, A. Bio, M. A. Martins-Loução and J. F. Moran. 2011. Intra-specific variation in pea responses to ammonium nutrition leads to different degrees of tolerance. Environ. Exp. Bot. 70: 233-243. Cruz, J. L., A. A. C. Alves, D. R. Lecain, D. D. Ellis and J. A. Morgan.
2014. Effect of elevated CO2 concentration and nitrate: Ammonium ratios on gas exchange and growth of cassava (Manihote sculenta Crantz). Plant Soil. 374: 33-43.
Dionisio-Sese, M. L and S. Tobita. 1998. Antioxidant responses of rice seedlings to salinity stress. Plant Sci. 135: 1-9.
Domínguez-Valdivia, M. D., P. M. Aparicio-Tejo, C. Lamsfus, C. Cruz, M. A. Martins-Loução and J. F. Moran. 2008. Nitrogen nutrition and antioxidant metabolism in ammonium-tolerant and sensitive plants. Physiol. Plant. 132: 359-369.
Ferreira, D.F. 2011. Sisvar: A computer statistical analysis system. Ciên. Agrotecnol. 35: 1039-1042.
Guimarães, M. M. C., P. A. R. Cairo and O. S. C. Neves. 2014. Crescimento de Eucalyptus urophylla em meio hidropônico com diferentes proporções de nitrato e amônio. Floresta Ambient. 21: 52-61.
Guo, X. R., Y. G. Zu and Z. H. Tang. 2012. Physiological responses of Catharanthus roseus to different nitrogen forms. Acta Physiol. Plant. 34: 589-598.
Helali, S. M. R., H. Nebli, R. Kaddour, H. Mahmoudi, M. Lachaâl and Z. Ouerghi. 2010. Influence of nitrate ammonium ratio on growth and nutrition of Arabidopsis thaliana. Plant Soil. 336: 65-74. Hoagland, D. R and D. I. Arnon. 1950. The Water Culture Method for
Growing Plants Without Soil. California Agricultural Experiment Station, Berkeley.
Horchani, F., R. Hajri and S. Aschi-Smiti. 2011. Is the sensitivity to ammonium nutrition related to nitrogen accumulation? Curr. Bot. 2: 18-22.
Hu, L., J. Yu, W. Liao, G. Zhang, J. Xie, J. Lv, X. Xiao, B. Yang, R. Zhou and R. Bu. 2015. Moderate ammonium: Nitrate alleviates low light intensity stress in mini Chinese cabbage seedling by regulating root architecture and photosynthesis. Sci. Hortic. 186: 143-153.
Jampeetong, A., H. Brix and S. Kantawanichkul. 2012. Effects of inorganic nitrogen forms on growth, morphology, nitrogen uptake capacity and nutrient allocation of four tropical aquatic macrophytes (Salvinia cucullata, Ipomoea aquatica, Cyperus involucratus and Vetiveria zizanioides). Aquat. Bot. 97: 10-16. Kochanová, Z., K. Jašková, B. Sedláková and M. Luxová. 2014.
Silicon improves salinity tolerance and affects ammonia assimilation in maize roots. Biologia. 69: 1164-1171.
Li, B., G. Li, H. J. Kronzucker, F. Baluska and W. Shi. 2014. Ammonium stress in Arabidopsis: Signaling, genetic loci, and physiological targets. Trends Plant Sci. 19: 107-114.
Lin, X. Y., X. X. Liu, Y. P. Zhang, Y. Q. Zhou, Y. Hu, Q. H. Chen and C. W. Jin. 2014. Short-term alteration of nitrogen supply prior
Fig 8. Photos illustrating the visible symptoms of ammonium toxicity in spinach plants, in the initial phase (a) and final phase (b) and (c). Jaboticabal-SP, Brazil, 2015.
c
to harvest affects quality in hydroponic-cultivated spinach (Spinacia oleracea). J. Sci. Food Agric. 94: 1020-1025.
Liu, Y., N. Lai, K. Gao, F. Chen, L. Yuan and G. Mi. 2013. Ammonium inhibits primary root growth by reducing the length of meristem and elongation zone and decreasing elemental expansion rate in the root apex in Arabidopsis thaliana. Plos One. 8: p.e-61031. Lopes, M. S and J. L. Araus. 2006. Nitrogen source and water regime
effects on durum wheat photosynthesis and stable carbon and nitrogen isotope composition. Physiol. Plant. 126: 435-445. Marschner, H. 2012. Mineral Nutrition of Higher Plants. 3rd ed.
Elsevier, Oxford.
Mendoza-Villarreal, R., L. A. Valdez-Aguilar, A. Sandoval-Rangel, V.
Robledo-Torres and A. Benavides-Mendoza. 2015. Tolerance of lisianthus to high ammonium levels in rockwool culture. J. Plant. Nutr. 38: 73-82.
Vollbrecht, P and E. Klein, H. Kasemir. 1989. Different effects of supplied ammonium on glutamine synthetase activity in mustard (Sinapis alba) and pine (Pinus sylvestris) seedlings. Physiol. Plant. 77: 129-135.
Wang, C., S. H. Zhang, P. F. Wang, W. Li and J. Lu. 2010. Effects of ammonium on the antioxidative response in Hdrilla vyerticillata (Lf) Royle plants. Ecotoxicol. Environ. Saf. 73: 189-195. Wong, M. 2005. Visual symptoms of plant nutrient deficiencies in