Original Research Article
Nutritional status assessment of elderly using MNA tool in
rural Belagavi: a cross sectional study
D. J. Patil, M. M. Shindhe*
INTRODUCTION
‘Aging’ is a biological process, not a disease or curse which is inevitable and irreversible. It is associated with many of physiological and biological changes which are progressive.1 As such there is no standard numerical criterion to define ‘old age’. However United Nations (UN) recommended a cut off of age 60 years and above when referring to elderly population.2
Because of increase in ‘life expectancy at birth’ in the last 10 years, the gap in life expectancy at birth drastically reduced between under developed and developing countries. This has lead to gradual increase in elderly population. As per the report of United Nations 2017, world elderly population is expected to rise from 962
million in 2017 to 2.1 billion by 2050 and 3.2 billion in 2100.3,4 In India, elderly population was 8.6% as per 2011 census and it is expected to cross 19% by 2050.5
Such a rapid rise in elderly population will certainly pose several challenges. The consequences of aging are multiple, complex and most of the time they go unrecognized. As age advances there will be gradual decline in the physical and biological function/s. Psychological and social problems are also faced by the elderly. Malnutrition is one of the major but neglected problem in elderly.
They are at risk of malnutrition due to physical, psychological, social, dietary and environmental risk factors. It is associated with adverse health effects.6
ABSTRACT
Background: Worldwide the elderly population gradually increasing and that will definitely pose several challenges. Malnutrition is one of the major but neglected problem in elderly. They are at risk of malnutrition due to physical, psychological, social, dietary and environmental risk factors. Malnutrition in elderly is associated with adverse health effects. Hence to study the nutritional status of elderly.
Methods: The study was carried out between January 2016- June 2017. 545 elderly were included in the study. Out of the 6 subcentres, 1 subcentre (Uchagaon) was selected by simple random sampling technique and house to house survey was carried out to select eligible elderly participants in the villages of selected subcentre. Data was collected from eligible elderly by using mini nutritional assessment (MNA) tool.
Results: Majority of the participants (65.1%) were between the age group of 60-69 years. 55% were females. 23.5% were malnourished, 49% were at risk of malnutrition and 27.5% had normal nutritional status.
Conclusions: The present study concluded that majority of the elderly were at risk of malnutrition. There is a need of actions to improve the nutritional status of the elderly.
Keywords: Elderly, Nutritional status, Mini nutritional assessment tool
Department ofCommunity Medicine, Belgaum Institute of Medical Sciences, Belagavi, Karnataka, India
Received: 28 July 2018
Accepted: 30 August 2018
*Correspondence:
Dr. M. M. Shindhe,
E-mail: [email protected]
Copyright: © the author(s), publisher and licensee Medip Academy. This is an open-access article distributed under the terms of the Creative Commons Attribution Non-Commercial License, which permits unrestricted non-commercial use, distribution, and reproduction in any medium, provided the original work is properly cited.
The magnitude of malnutrition in elderly is under reported. Nutritional problems are not yet acknowledged by health professionals due to lack of nutritional assessment and intervention as in this age group it is crucial.
To determine the nutritional status of elderly, Nestle’s mini nutritional assessment (MNA) is one of the most recognized screening tool and is used all over the world. Mini nutritional assessment (MNA)- is an 18 questionnaire screening tool which consists of 2 sections- screening and assessment with a total scoring of 0 to 30. Based on the scoring of the elderly, nutritional status were classified as normal nutritional status (24-30), at risk of malnutrition (17.5-23.5) and malnourished (<17).7
It is a non-invasive, in-expensive practical evaluation tool specially designed for elderly to detect malnutrition and those at risk of malnutrition. It has high sensitivity of 96% and specificity of 98%.8
In Karnataka, only few studies were conducted to assess the nutritional status of elderly by MNA tool. Hence an attempt was made to carry out the present study on nutritional status assessment of elderly by using MNA tool in rural area of Belagavi district as the majority of elderly live in rural area and very limited information is available on nutritional status of elderly.
METHODS
Study design
The study was a community based cross-sectional study.
Study duration and period
The study was conducted for a period of 1½ years from January 2016 to June 2017.
Source of data
The present study was carried out among the elderly population of Rural Health Training Centre (RHTC), Uchagaon, a rural field practice area of Department of Community Medicine, BIMS, Belagavi.
Sample size
Sample size was estimated by considering the prevalence of malnutrition in elderly as 15% 9 and by using below mentioned formula,
n=
where, n= sample size, z= alpha error= 1.96
p=prevalence of malnutrition=15%, q=100-p=85,
d=absolute error as 3%
so, n= = 544.5 ≈ 545
n=545
Hence, the study comprised of total 545 elderly people residing in the study area.
Method of collection of data
A cross sectional study was carried out among the elderly population of RHTC, Uchgaon which caters a total population of 42,461 and has 6 subcentres Out of the 6 subcentres, Uchagaon subcentre was selected by ‘lottery method’ as a simple random sampling technique which covers 2 villages with a total population of 7272.
House to house survey was carried out in the villages of the selected subcentre after applying the selection criteria.
Selection criteria
Persons who were aged ≥60 years, residing in the area for >1 year and who gave consent to participate in the study were included and those who were terminally ill and bedridden were excluded
Data collection
After obtaining written informed written consent from eligible elderly data was collected using Nestlé’s Mini Nutritional Assessment tool through personal interview. Weight of each elderly’s were recorded by using KRUP’S weighing machine and recorded nearest to 0.1 kg. Height was recorded using portable stadiometer and it was recorded nearest to 0.1 cm. Mid arm and maximum calf circumferences were recorded from each participants using simple measuring tape and readings were recorded nearest to 0.1 cm.
Statistical analysis
The obtained data was entered on a Microsoft Excel Windows 10 spread sheet. The data was analyzed using SPSS version 22.0. The categorical data was expressed in percentages while continuous data was expressed as mean. The association between the MNA score with age and gender were tested using chi-square test. Significance level was considered at ‘p’ value of ≤0.05.
RESULTS
Table 1: Distribution of the elderly participants according to their gender and age group.
Age groups (in years)
Gender
Total N (%)
Male N (%)
Female N (%)
60-69 144 (58.8) 211 (70.3) 355(65.1)
70-79 77 (31.4) 68 (22.7) 145 (26.6)
≥80 24 (9.8) 21 (7) 45 (8.3)
Total 245 300 545
Table 2: Distribution of the nutrition status of participants based on their MNA-SF and MNA
scoring.
MNA-SF MNA
MNA score Number % Number % Normal 154 28.3 150 27.5
At risk 285 52.3 267 49
Malnourished 106 19.4 128 23.5
Total 545 100 545 100
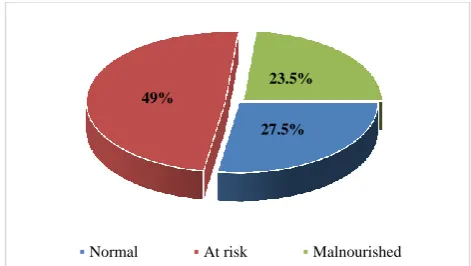
Figure 1: Distribution of participants according to their MNA scoring.
Nutritional status of elderly using MNA-SF revealed that 19.4% were malnourished, 52.3% were at risk of malnutrition and 28.3% had normal nutritional status (Table 2). And using complete MNA tool 128 (23.5%) participants were malnourished, 267 (49%) were at risk of malnutrition and 150 (27.5%) had normal nutritional status (Table 2 and Figure 1).
Table 3: Association between age group of participants and MNA scoring.
Age group (years)
MNA scoring
Normal At risk Malnourished Total
Chi square value 186.01
‘p’ value <0.001
60-69 (%) 138 (38.9) 185 (52.1) 32 (9) 355 (65.1)
70-79 (%) 11 (7.6) 77 (53.1) 57 (39.3) 145 (26.6)
≥80 (%) 1 (2.2) 5 (11.1) 39 (86.7) 45 (8.3)
Total 150 267 128 545
Table 4: Association between gender and MNA scoring.
Gender MNA scoring Total
N (%)
Normal At risk Malnourished
Chi square value 5.125
‘p’ value=0.07
Male (%) 79 (32.3) 114 (46.5) 52 (21.2) 245 (45)
Female (%) 71 (23.7) 153 (51) 76 (25.3) 300 (55)
Total 150 267 128 545
Among the participants aged 60-69 years and 70-79 years, majority were at risk of malnutrition and among the participants aged ≥80 years, majority were malnourished. There was a statistically significant association found between advancing age and low MNA score (Table 3).
Among males, 46.5% were at risk of malnutrition and 21.2% were malnourished. Among females, 51% were at risk of malnutrition and 25.3% were malnourished. However, there was no statistically significant association found between gender and MNA score (Table 4).
DISCUSSION
Elderly population is the fastest growing age group than any other age group worldwide including India. As the
elderly population increases it certainly poses several challenges on society, particularly on health, economy and social life. Elderly are prone for malnutrition as it is influenced by many factors.
Considering the above facts, a community based cross sectional study was conducted and the study included 545 elderly participants aged 60 years and above residing in Uchagaon, a rural field practice area of Department of Community Medicine, BIMS, Belagavi.
In the present study, almost 2/3rd (65.1%) of the elderly participants were in the age group of 60-69 years with the mean age of 67.84±6.38 years. The finding observed in our study was similar to the study conducted by Kansal et al, Kavya et al and Vedantham et al.10-12 A study conducted by Reddy et al in rural areas of Tamil Nadu observed that the mean age of the entire study population
27.5% 49%
23.5%
was 69.8±7.8 years which was almost similar to our study.15
A significant association was found between low MNA scoring and advanced age. Study conducted by Paul et al, Agarwal et al and Krithika et al also showed similar association between advanced age and low MNA score.9,13,14
Majority of the participants were between the age group of 65-70 years. Only 8.3% were aged ≥80 years and among them 86.7% were malnourished. This could be because of age related biological and physiological changes that leads to loss of appetite (anorexia of aging) and malnutrition.
In the present study, 55% of the participants were females with female to male ratio of 1.25:1 suggesting female predominance. No significant association was found between gender and MNA score. Studies conducted by Kansal et al and Kavya et al showed similar pattern of distribution with female predominance with no significant association found between gender and MNA scoring.10,11
In contrast, studies conducted by Lahiri et al, Kritika et al and Reddy et al had shown that male participants were more than the females.14-16 However there was no significant association between gender and MNA scoring. The female predominance could be because of greater life expectancy in females than males in India.
The present study which was conducted to assess the nutritional status of elderly by using MNA tool revealed, 23.5% were malnourished, 49% were at risk of malnutrition 27.5% had normal nutritional status. The results were almost similar to the study conducted by Kansal et al in other part of rural Belagavi it was observed that, 22.6% of elderly were malnourished and 43.7% were at risk of malnutrition.10 This could be because of same geographical and environmental conditions that influenced the elderly nutrition.
A study which was conducted by Kavya et al in rural Bangalore had shown 30.8% of elderly were malnourished and 56% were at risk of malnutrition.11 As compared to our study it had shown high prevalence of malnutrition and at risk of malnutrition.
A study by Vedantam et al in rural areas of Tamil Nadu revealed that, 14% of elderly were malnourished and 49% were at risk of malnutrition.12 As compared to the present study it showed lower prevalence of malnutrition. Another study by Paul et al in other part of Tamil Nadu had shown 24.4% were at risk of malnutrition and none of the elderly were malnourished.13 This could be because of geographical change and health care facilities provided by state government.
Another study conducted by Agarwalla et al in rural Assam revealed that 15% of elderly were malnourished and 55% were at risk of malnutrition.9 As compared to our study it had shown lower prevalence of malnutrition but higher ‘at risk’ of malnutrition in elderly.
A study conducted by Ghimire et al in rural areas of Nepal had shown 24% were malnourished and 65% were at risk of malnutrition.17 The prevalence of malnutrition and at risk of malnutrition were higher than our study.
The present study was carried out in only one sub centre out of 6 sub centres and thus the results obtained cannot be generalised to entire population of RHTC. Bio-chemical investigations were not carried out which could help in determining overall nutritional status of elderly.
Conclusion: In the present study, majority of the elderly participants were in the age group of 60-69 years and majority were females. Nutritional assessment of elderly by MNA tool revealed, that majority of the elderly were ‘at risk’ of malnutrition. There was a significant association found between lower MNA score and advanced age.
Regular screening of nutritional status of elderly is required in the rural area. The malnourished elderly need special care regarding the nutritional components and factors which influences their nutritional status. National level elderly nutritional programmes should be implemented.
ACKNOWLEDGEMENTS
We thank to statistician and all the staff members of Department of Community Medicine, BIMS, Belagavi for their suggestions and support. We also thankful to all the elderly of Uchagaon village who participated in this study.
Funding: No funding sources Conflict of interest: None declared
Ethical approval: The study was approved by the Institutional Ethics Committee from IEC committee, BIMS, Belagavi
REFERENCES
1. Gupta P. Text book of Community Medicine. 4th ed. Bangalore: CBS publication; 2010: 677-87. 2. WHO: Health statistics and information system.
Proposed working definition of an older person in Africa for the MDS Project. Available at http://www.who.int/healthinfo/survey/ageingdefnold er/en. Accessed on 17 July 2017.
4. Department of Social Economics and Social Affairs, Population division. United Nations, New York. World population aging - 2015. Available at http://www.un.org/en/development/desa/population/ publications/pdf/ageing/WPA2015_Report.pdf. Accessed on 12 August 2017.
5. Government of India, Ministry of Statistics and Programme implementation, Central statistics office. Elderly in India- Profile and Programmes- 2016. Available at: http://mospi.nic.in/sites/ default/files/publication_reports/ElderlyinIndia_201 6.pdf. Accessed on 12 August 2017.
6. Agarwal A, Udipi SA. Textbook of Human Nutrition. 1st ed. New Delhi: Jaypee Brothers Medical Publishers Ltd; 2014: 419-425.
7. Mini Nutritional Assessment, Nestle Nutrition Institute. Available at: http://www.mna-elderly. com/forms/MNA_english.pdf. Accessed on 29 June 2017.
8. Vellas B, Guigoz Y, Garry PJ, Nourhashemi F, Bennahum D, Lauque S, et al. The Mini Nutritional Assessment (MNA) and its use in grading the nutritional state of elderly patients. Nutrition. 1999;15(2):116-22.
9. Agarwalla R, Saikia AM, Baruah R. Assessment of the nutritional status of the elderly and its correlates. J Family Community Med. 2015;22(1):39-43. 10. Kansal D, Baiga SS, Kruthika K, Mallapur M.D.
Nutritional assessment among population of rural Belagavi: a cross sectional study. Int J Med Sci Public Health. 2016;5(4):1496-9.
11. Kavya C, Sathosh A. Geriatric health; Assessment of the nutritional status and functional ability of
elderly living in rural area of Bangalore, Karnataka, India. Int J Community Med Public Health. 2016;3(12):3460-4.
12. Vedantam A, Subramanian V, Nicholas VR, John KR. Malnutrition in free living in rural south India: Prevalence and risk factors. Public Health Nutr. 2009;13(9):1328-32.
13. Paul SS, Abraham VJ. How healthy is our geriatric population? A community based cross sectional study. J Family Med Primary Care. 2015;4(2):221-4.
14. Kritika, Deepshika, Senwal J, Vyas S, Juyal R, Sati HC. Nutritional status and associated comorbidities among the elderly in Doiwala block, Dehradun. Indian J Community Health. 2014;26(2):197-203. 15. Reddy BN, Reddy LK, Pallavi M, Reddy N,
Shireesha P. A study on nutritional status and prevalence of non-communicable diseases among the rural elderly of Tamil Nadu: A community based cross sectional study. Int J Res Health Sci. 2014;2(2):604-9.
16. Lahiri S, Biswas A, Santra S, Lahiri S K. Assessment of Nutritional Status among Elderly population in a Rural area of West Bengal, India. Int J Med Sci Public Health. 2015;4(4):569-72.
17. Ghimire S, Baral BK, Callahan K. Nutritional assessment of community dwelling older adults in rural Nepal. PLoS ONE. 2017;12(2):1-15.