© 2017 IJSRSET | Volume 3 | Issue 1 | Print ISSN: 2395-1990 | Online ISSN : 2394-4099 Themed Section: Engineering and Technology
Runoff-Rainfall Prediction Formula for West Dar Fur State
using Statistical Methods and GIS
1
Tyseer Y. Mustafa ,
2Abbas A. Ibrahim ,
3Insaf S.
Babiker,
4Arman M. Abdalla
1,2
Sudan University of Science and Technology, collage of Environment and water resource Engineering, Department of water resource Engineering, Sudan
3
University of Khartoum, Faculty of science, Department of Geology, Sudan
4
Sudan University of Science and Technology, collage of Engineering and Technology Industries, Department of Plastic Engineering, Sudan
ABSTRACT
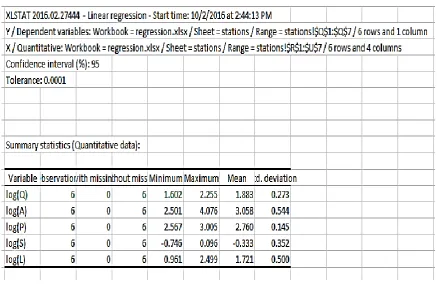
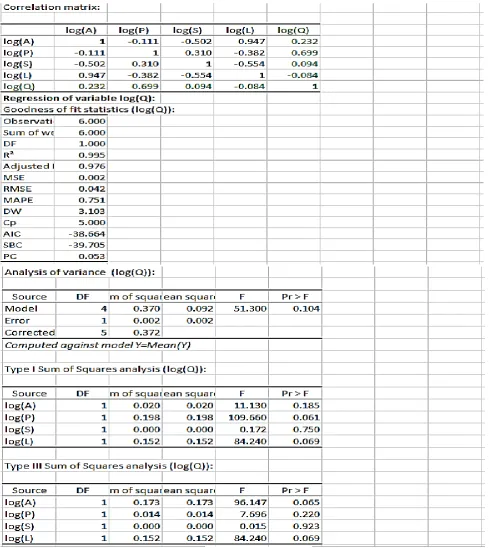
The Runoff-Rainfall prediction formula of annual stream flow was developed for Wadis system in West Dar Fur State using discharge gauged stations, GIS program, and rainfall data analysis together with multiple regression equation were evaluated by XLSATA tool in Excel. The relationship produced R3 (correlation coefficient) value equal to 0.995. Some stations were chosen to verify the accuracy of the relationship. Finally, the total annual flow was calculated for the State based on two major Wadis are Azum and kaja. The collective flow volume calculated in West Dar Fur State was (2348 Million m3 )for the two wadies. These results were discussed and compared with previous studies in West Dar Fur State. The integrated approach using GIS and statistical methods proved to be successful and accurate procedure.
Keywords : West Dar Fur, multiple regression, prediction, GIS, XLSATA tools
I.
INTRODUCTION
West Dar Fur State has a total area of 150,000 km² and a population of 1,693,000 in 2003. Its capital is Al-Ginaina Town. The main water resources in the State are seasonal streams running from Jebel Mara and the groundwater. It has an arable land of about 8 million feddans, 3 million of which are exploited. The major Wadis are Azum and Kaja. The overall surface area of Wadi Azum –including all three sub-streams is 36965 km2[1], 36700 km2 [2],and 40393 km2 [3] .It drains from the higher western slopes of Jebel Marra with altitudes ranging between 2600m and 600m[1].The surface area of Kaja is 42850 km2 [2], and 47337 km2 [3]. The measured discharge rate is 487 million cubic meter per year[3].
Multiple regression model is one of the statistical methods, it is relation between one depending parameter with more independent one, and it is commonly used to estimate mean annual stream flow of any gauge station. The meteorological and geographic characteristics of
stations upstream were related to formulate the adopted multiple regressions model the developed empirical equation has the form:
Where: -
Q is discharge value at gauged station (million m3/s), A is catchment area (km2),
P is mean annual rainfall precipitation (mm), S is mean catchment slope (%)
L is longest flow path in catchment (km) And bo, b1, b2, b3, b4 are model coefficients.
The above empirical relationship developed a better linear form by taking logarithms as in the equation below:
The optimum values of model parameters can be estimate in this equation and several combinations of stations can be investigated in order to optimize the regression equation. Combination achieves maximization of the correlation coefficient R and compatibility of estimated discharge and precipitation. This has resulted in a small difference between estimated and observed discharge in different stations.[4]
The optimum model parameters were estimated with selected independent characteristics such as the mean precipitation, catchment area, and catchment mean slope while the length of Wadis was not considered in previous studies [4]. The model used in this paper uses parameters shown in equation (1).
II.
METHODS AND MATERIAL
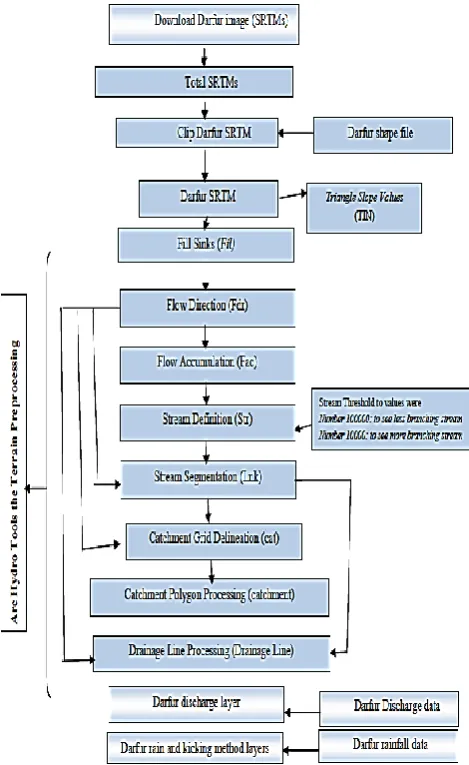
The data used to predict the equation for the West Dar Fur region include; Wadi discharge data (station names and length of time period), rainfall data (number and name of stations and length of time period) [5],and digital elevation model DEM (90m) of the Shuttle Radar Topography Mission (SRTM). The later was used to create layers such as catchment, stream length and slope employing the Arc-Hydro tool of the ArcGis 10 software following the routine analysis shown in figure (1). The annual stream discharge (Table 1) and rainfall data were analyzed by XLSATA tools in Excel program in order to determine the best distribution for the thirty-year rainfall data. Layers of some parameters were created by using Kringing Method. Mapping all data in GIS environment and the application of multiple regression method reveal the general methodology developed in this study (Figure 2).
The best selected discharge station that has given a high and accurate R value in the regression analysis, belongs to Wadi Azum which has more gauging stations compared to Wadi Kaja (table 1)[3]. The Arc-Hydro tools and the Kriging Method were used to compute all independent characteristics such as catchment area, precipitation, stream length and slope as shown in table (1 and 2). Hence using the data set layers for each wadi, the regression was performed (3 to 13). Table (3) was used to verify the equation. Figures (14 to 15), (16 to 17) show Wadi Azum and Wadi Kaja catchment properties obtained by GIS.
III.
RESULTS AND DISCUSSION
The result of regression for West Dar Fur State of figure (18) is summarize in table (4)
i. Firstly, the discharge is considered as the most important parameter in the study. It was revealed from the result that the difference between measured and predicted annual discharges was small ranging from 0.25% to 7.71 %. Furthermore, it is associated with a reasonably high correlation coefficient close to ( )
ii. For the verification equation, the analysis is depicted in table (6).
From table (6) it is clearly apparent that the verification stations located in Wadi Azum has smaller difference, (approximately 29.2) than those located in Wadi Kaja (approximately 113.5). Wadi Azum Station has close precipitation data values (indicating homogeneity) and would preferably be used to develop the equation.
iii. Tables (7) and (8) described the simple calculation of annual discharges for both Wadi Azum and Wadi Kaja respectively. They were calculated using the layers prepared in GIS as shown the figures (13, 14, 15, and 16).
IV.
CONCLUSION
The use Arc-Hydro tools reduced time needed to delineate West Dar Fur catchments. The 3D TIN layer for elevation values and Kringing Method for rainfall data interpolation provided successful tools. This methodology would also help scientists to understand morphology and topographic characteristics of study area. It is highly recommended to use XLSATA tools in Excel to get most suitable probability distributions that fits the annual rainfall data and to use multiple regression method.
V.
REFERENCES
[1]. M. A. R. Yousif, "Darfur Water Resources, Current Situation and Future Perspectives and opportunities" Darfur International Water Conference -Water for sustainable Peace, vol. Friendship Hall, Khartoum Sudan, 27th and 28th June 2011, June 2011
[2]. Dr. Babiker I. Barsi, "Water Resources of Wadi Systems in Darfur," International Seminar on "Challenges in Applications of Integrated Water Resources Management, vol. Water and Environment Center, Sana'a University, Sana’a, 2010.
[3]. H. E. Ali, Darfur's Political Economy: A Quest for Development: Routledge, 2014.
[4]. B. E. ZOBANAKIS G., DASSAKLIS A., and MIMIKOU M., "QUANTIFYING SURFACE RUNOFF IN THE WATER DISTRICT OF WESTERN MACEDONIA USING MULTIPLE REGRESSION ANALYSIS AND G.I.S " International Conference on Environmental Science and Technology September 2003.
TABLE1
THE INDEPENDENT CHARACTERISTICS FOR WADI AZUM
Wadi, station
Q Measured
annual discharge
(M.m3)
A (Km2)
Max.Elev (m)
Min.Elev (m)
L long flow path
(Km) S Slope% P (mm)
Wadi Saleh, Saleh 180 317.0476 921.527 807.6355 9.133234 1.247 1010.5 Wadi Toro , Toro 45 541.4434 1116.538 1054.94295 34.34349 0.17935 537.5
Wadi Aribo, Aribo 58 1282.083 1196.834 870.829 69.112694 0.4717 566.3232 Wadi Dodari, Dodari 40 1074.1 1835.618 1095.672 68.647 1.0779 494.5 Wadi Bari, Murnei 150 11904 1370.636 736.9433 315.27 0.201 645 Wadi Bari, kabkabiya 70.93 789.8476 1361.172 1160.48433 45.40445 0.442 368.96051
Source: [3],
TABLE2
THE INDEPENDENT CHARACTERISTICS AT LOG SCALE FOR WADI AZUM Wadi , station Log Q Log A Log P Log S Log L Wadi Saleh, Saleh 2.255273 2.501124 3.004536 0.095866 0.960625
Wadi Toro , Toro 1.653213 2.733553 2.730378 -0.7463 1.535844
Wadi Aribo, Aribo 1.763428 3.107916 2.753064 -0.32633 1.839558
Wadi Dodari, Dodari 1.60206 3.031045 2.694166 0.032578 1.836622
Wadi Bari, Murnei 2.176091 4.075693 2.80956 -0.6968 2.498679 Wadi Bari, kabkabiya 1.85083 2.897543 2.56698 -0.35458 1.657098
TABLE3
VERIFICATION FOR WEST DARFUR EQUATION
Years of measured Big Wadi-small wadi station Q Measured annual discharge (M.m3)
A (Km2)
Max.Elev (m)
Min.Elev (m)
L long flow path
(Km) S Slope% P (mm) 1977-1997 Azum -wadi elserief kabkabiya
23.27 146.2845 1259.412 1159.3065 14.26003
0.702 372.661407
1965-1973
Kaja - wadi abu sunut Ereigi
9.928482 655.6033 1111.282 945.393 68.21074 0.2432 335.9222
1965-1972
Kaja- wadi abu sunut Tilfou
2.707991 37.57289 868.346 867.981 9.172147
0.00398 262.5257
1964-1973
Kaja -wadi abu sunut Abu Gidad
45.20211 744.33341 892.198 875.323 39.21754 0.04303 408.0355
1978-2002
Azum -wadi bargu Umm Sineina
TABLE4
COEFFICIENTS OF REGRESSION FUNCTIONS FOR WEST DIFFERENT STATE Coefficients Predicted Discharge Function (million m
3
) Four Decimal Places.
1.57996091739009
2.0113 0.7437 0.008 2.2056
30.0155
A
P
S
L
2.01127688478 -0.74371290456 -0.00795204617 -2.20560977060 0.995150 TABLE5
WEST DARFUR STATE PREDICTED AND MEASURED DISCHARGES
Wadi, station
Q
Measured annual discharge (M.m3)
Q
Predicted annual discharge (M.m3) Difference %
Wadi Saleh, Saleh 180 180.458 0.254646159
Wadi Toro , Toro 45 46.317 2.925721942
Wadi Aribo, Aribo 58 53.530 7.706383996
Wadi Dodari, Dodari 40 41.823 4.557533861
Wadi Bari, Murnei 150 152.136 1.423983613
Wadi Bari, kabkabiya 70.93 70.232 0.984334135
TABLE6
RESULT OF VERIFICATION WEST DAR FUR EQUATION
Years of
measured Big Wadi-small wadi -station
Q Measured
annual discharge
(M.m3)
Q Predict annual discharge (M.m3)
Difference %
1977-1997 Azum -wadi elserief -kabkabiya 23.27 30.070 29.22327729
1965-1973 Kaja - wadi abu sunut- Ereigi 9.928482 21.200 113.5237807
1965-1972 Kaja- wadi abu sunut -Tilfou 2.707991 6.991 158.1689908
1964-1973 Kaja -wadi abu sunut -Abu Gidad 45.20211 81.384 80.04483017
TABLE7
CALCULATED WADI AZUM DISCHARGE Gird ID
of catchment
A (km2) Max.Elev Min.Elev long flow
path (L) km slope% P(mm)
Pred Q(M.cm)
162 3231.616 1373.955 923.775 150.97 0.298192 367.9232 84.837 170 1077.417 1111.134 923.775 78.59 0.238401 375.8245 38.760 172 80.09485 923.775 921.221 12.28 0.020798 402.6767 12.087 174 5540.519 921.221 736.43 163.54 0.112994 566.1135 153.832 175 1974.184 1463.652 921.221 135.94 0.399022 425.1625 35.551 182 1526.142 1145.335 1105.925 91.85 0.042907 446.6855 49.351 186 1638.639 1821.245 1060.513 102.81 0.73994 485.4009 40.810 191 30.60531 1060.513 1105.925 11.33 0.400812 541.8088 1.633 192 1203.044 1275.332 1060.513 58.41 0.367778 561.1142 68.870 193 12.60822 1105.925 1005.851 6.07 1.648666 545.1047 1.070 194 1589.628 897.69 735.933 97.22 0.166382 672.0461 34.503 197 1422.191 1302.953 1005.851 73.5 0.40422 644.2181 52.378 198 298.986 1005.851 897.69 29.29 0.369276 513.9307 20.487 199 3119.261 870.46 643.763 114.31 0.198318 767.2358 84.755 200 1282.083 1225.616 897.69 69.06 0.474842 724.5131 44.642 202 1206.129 857.661 643.763 76.69 0.278913 777.2839 29.864 206 3726.948 1091.976 609.183 129.15 0.373823 970.0508 77.405 208 1461.726 887.675 609.183 85.17 0.326984 797.9763 34.161 213 153.4563 609.183 581.34 22.52 0.123637 805.462 6.907 214 191.551 584.703 581.34 18.3 0.018377 807.6827 17.276 215 9.103717 581.34 571.609 6.98 0.139413 816.0332 0.309 223 3186.626 799.402 584.703 115.32 0.186177 911.2453 76.394 225 1456.116 730.879 584.703 66.22 0.220743 818.6612 58.121
Sum 35418.674
4 1024.004
TABLE8
CALCULATEDWADIKAJA DISCHARGE Gird ID
of catchment A (km2) Max.Elev Min.Elev long flow path (L) km slope% P(mm)
156 3793.35 974.261 873.06 116.96 0.086526 494.665 166.625 163 2174.417 908.099 873.06 109.26 0.032069 504.1596 62.831 173 1029.509 995.057 850.921 65.61 0.219686 529.7501 40.830 176 931.0133 873.06 850.921 56.6 0.039115 575.9814 44.012 177 1373.583 892.798 763.928 50.25 0.256458 615.3716 117.326
Sum 28746.88328 1324.073
TABLE9
COMPARISON BETWEENPRESENT AND PREVIOUS STUDIES FOR WEST DAR FUR
NO. Name of wadi
Catchment area (Km)
Estimated/predicted Annual Discharge
(M.CM)
Estimated/predicted Total Annual Discharge
(M.CM)
Reference
1 Azum 36965 - 4016 [1]
Kaja - -
2 Azum 36700 601 900 [2]
Kaja 42850 299
3 Azum 40393 2597 4016 [3]
Kaja 47337 1419
Figure1. Researcher Developed ArcGIS Analysis and Layers
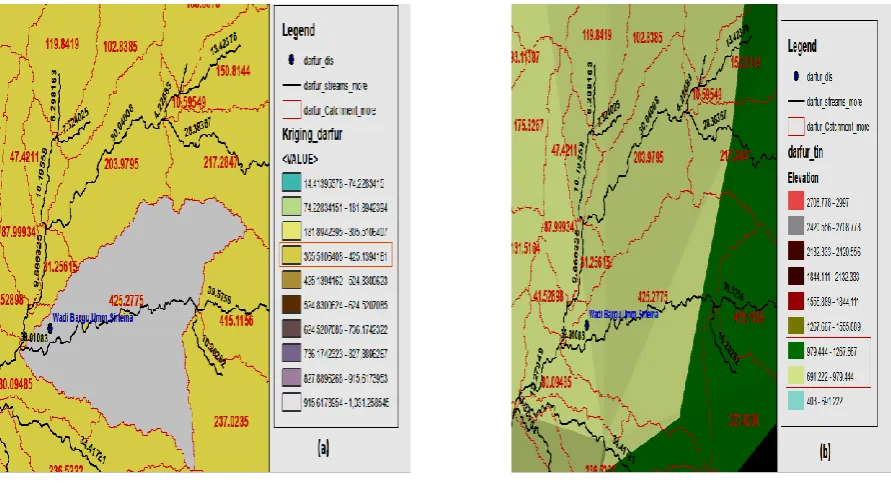
Figure 3. wadi Bari, Umm Sineina station, (a) rain, catchment and stream length, (b) elevation
Figure 4. Wadi Toro,(a) rain, catchment and stream length,(b) elevation
Figure 6. Wadi Dodari,(a) rain, catchment and stream length,(b) elevation
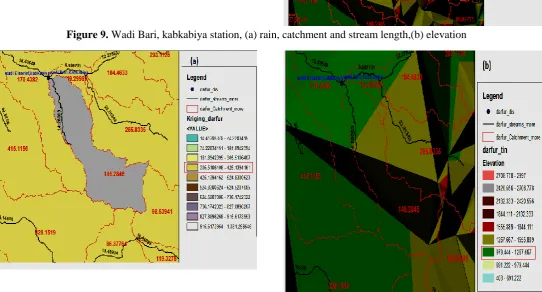
Figure 8. Wadi Bari, kabkabiya station, (a) rain, catchment and stream length,(b) elevation
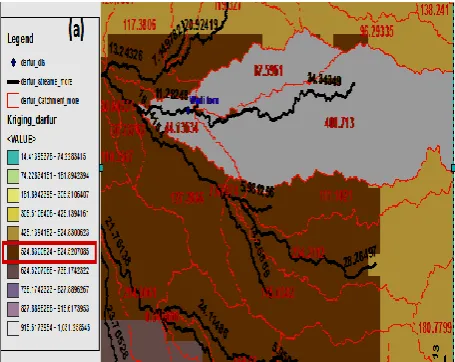
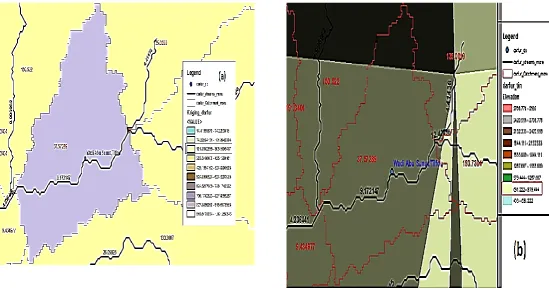
Figure 00. Wadi Abu Sunut, Ereigi station,(a) rain, catchment and stream length,(b) elevation
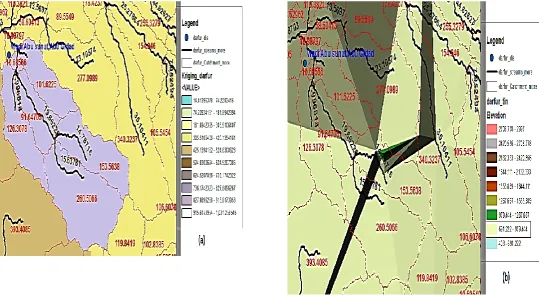
Figure 02. Wadi Abu Sunut, Abu Gidad station,(a) rain, catchment and stream length,(b) elevation
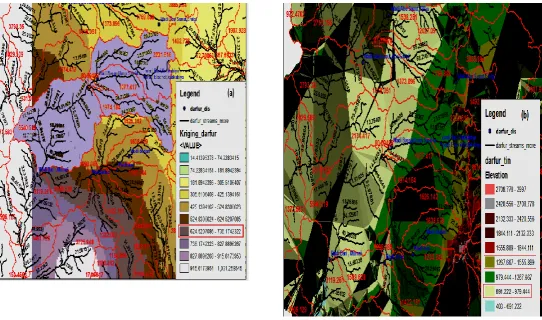
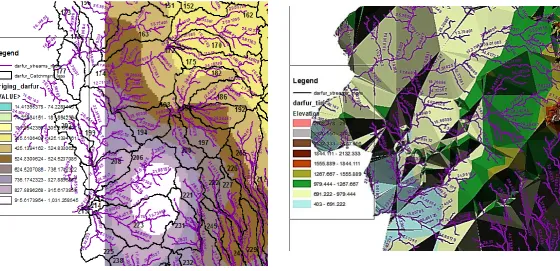
Figure 04. Wadi Azum ,(a) rain, catchment and stream length,(b) elevation
Figure 07. Wadi Kaja ,(a) rain, catchment and stream length,(b) elevation