IJSRSET1738144 | Received : 07 June 2018 | Accepted : 18 June 2018 | May-June-2018 [ 4 (8) : 522-527]
Themed Section : Engineering and Technology
522
Renewable Energy for PCM Based Thermal Energy Storage
System by Using Nanoparticles
K.Narasimham1, E. Siva Reddy2 , R. Meenakshi Reddy31,3Department of Mechanical Engineering G.P.R College of Engineering, Andhra Pradesh, India
ABSTRACT
Day by day the use of fossil fuels increase in greenhouse gas emissions and rise in fuel prices. These are the main driving forces behind efforts for the effective utilization of various types of renewable energy resources. Thermal energy storage is an effective method of storing thermal energy. The use of phases change materials in the solar system would improve the performance of the system due to its high energy storage density and isothermal operations. Nowadays for solar heating applications, phase change materials (PCM) are used to store the energy in the form of latent heat because the large quantity of thermal energy is stored in the small volume. In present work, nanofluids namely Al2O3 and CuO were used in 0.02%, 0.05%, and 0.08% volume concentration into the base fluid (water) and also different flow rates 2lit/min, 4lit/min and 6lit/min to enhance its thermal performance. An experimental set-up is designed, fabricated and commissioned to collect thermal performance data on the thermal energy storage tank. In these experiment spherical capsules is used with a circular fin which contains phase change materials (PCM) of stearic acid charging and discharging. Experiments were carried out with the base fluid to study the heat transfer rates.
Keywords : Thermal energy storage systems (TESS). The phase change material (PCM), Nanoparticles, charging and discharging.
I.
INTRODUCTIONThe renewable energies available in the environment should be used to meet the growing power demand for sustained future. These renewable energy systems play a vital role in energy savings and reducing global gas emissions to have a pollution free environment for future generations. Thermal energy storage system is one of the renewable energy sources. Thermal energy storage system is one of the renewable energy sources.
II.
METHODS AND MATERIAL Thermal Energy Storage SystemsThermal Energy Storage Systems are conserving thermal energy in the form of sensible heat and latent heat that can be utilized later for many industrial and
domestic applications. Sensible heat storage system is high efficiency but constrained with storage capacity. Latent heat storage system is using PCM most preferred thermal heat devices. Because of their less volume with good storage capacity and quick charging/discharging process.
Phase change material
Table : 1 Stearic acid properties
Appearance White
Melting Temperature 0C 69.4 Latent heat of fusion (KJ/Kg) 198.91 Density (Kg/m3) Solid 960
Liquid 840 Specific heat
(J/Kg0C)
Solid 1600 Liquid 2300 Thermal
conductivity(W/m)
Solid 0.3 Liquid 0.172
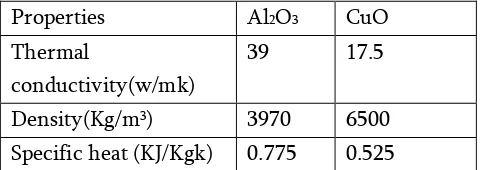
Nanoparticles
In present investigation base fluid (water) and nanoparticles are mixed. The nanoparticles are used Al2O3 and CuO.
Table : 2 Properties of nanoparticles
Properties Al2O3 CuO Thermal
conductivity(w/mk)
39 17.5
Density(Kg/m3) 3970 6500 Specific heat (KJ/Kgk) 0.775 0.525
The purpose of the present work is to study the thermal performance of the latent heat storage unit investigated with a constant heat source. In these experiment spherical capsules is used with a circular fin which contains phase change materials(PCM) of stearic acid charging and discharging. Different experiments were carried out with the base fluid to study the heat transfer rates.
Experimental setup and investigation
Two water heaters 1000w capacity,100lits capacity of water storage tank, 0.5 Hp of circulating pump, flow meter based on adjusting, 40mm diameter of PVC pipe, three-foot al ball valves, 380mm diameter and 500mm height of stainless steel TES tank has the 52L capacity and also insulated. The shower plate is arranged at the top of the tank is to get the uniform
flow of HTF. The water tank is placed beside the storage tank.PCM is encapsulated finned spherical capsules with stearic acid. TES tank supplied by HTF from water tank by using a centrifugal pump. The spherical capsule of 70mm outer diameter and 0.8mm thickness and inserted with circular fins of 0.6mm.These circular fins temperatures will be equilibrium at the middle of the spherical capsule ball. The capacity of the TES tank is 80 balls. The spherical balls are each layers supported by wire mesh. The PCM are used stearic acid with melting temperature is 690C and base fluid (water) is used as SHF material and nanopartical is used Al2O3. The HTF is water+Al2O3. The flow meter is used different flow rates of HTF. The centrifugal pump is used to circulate the HTF from the top of the TES tank. The TES tank is divided in to five layers. Each layer placed 16 spherical PCM balls with one thermo couple is inserted to any one PCM ball. The thermo couple wires placed at inlet, outlet and five layers of the mesh in TES tank. These are used to measure the inlet and outlet temperatures of HTF. The total numbers of thermo couple wires are twelve. These thermo couple wires are connected to a temperature indicator. The experimental set up is shown in below fig.
Experimental Procedure
The water tank is taken and it is filled with water up to 80 lits. The water tank is connected to the heaters. The water is heated by using heaters and the temperature rise up to 800C. The hot water is circulating to the TES tank by using centrifugal pump.
Figure 2. Nanoparticles CuO and Al2O3
Formulation of Nano particle % volume concentration =
Where
WP = Weight of the nano particles in grams Wf = Weight of base fluid (water) in grams
ῤP = Density of Al2O3 is 3970 kg/m3 and CuO is 6310 kg/m3
ῤf = Density of base fluid (water) is 995kg/m3
Table : 3 Different concentration of Nano particle Weight
% of concentration Weight of nano particles in grams
0.02 61.52
0.05 187.32
0.08 249.72
Table : 4 Charging process Time only with water 2lit/min
Time in mins/PCM temperature
0 60 100 120 130
T2 33 54 64 69 73
T4 34 55 65 69 74
T6 35 57 66 70 74
T8 35 58 66 70 75
T10 34 58 67 70 75
Table : 5 Charging process Time only with water 4lit/min
Time in mins /PCM Temperatu res
0 30 60 90 100
T2 34 46 54 64 69
T4 35 45 53 65 69
T6 34 46 54 65 68
T8 35 47 54 66 69
T10 35 45 55 67 70
Table: 6 Charging process Time only with water 6lit/min
Time in mins/PC M Temperat ures
0 20 40 60 80 90
T2 35 43 52 64 68 73
T4 35 42 53 63 69 72
T6 34 44 54 64 67 74
T8 35 44 55 64 69 74
T10 35 44 55 63 68 74
Table: 8 charging process Time with 0.05% concentration of Al2O3
Nano particle 0.05%
Time in mins
2 lit/mi ns
4 lit/min s
6 lit/mi ns
Al2O3 + water
10 47 53 55
20 50 56 58
30 52 58 60
40 55 59 65
50 60 62 67
60 62 65 72
70 65 68 73
80 66 73
Table : 9 charging process Time with 0.08% concentration of Al2O3
Table : 10 Charging process Time with 0.02% concentration of CuO and different mass flow rates
Nano particle 0.02% Time in mins 2 lit/mins 4 lit/mins 6 lit/mi ns CuO + Water
10 42 54 56
20 48 57 58
30 50 59 60
40 53 63 65
50 57 66 67
60 58 68 70
70 65 70 73
80 70 72
90 71
100 72
Table : 11 Charging process Time with 0.05% concentration of CuO and different mass flow rates
Nano particl e 0.05% Time in mins 2 lit/ min s 4 lit/mi ns 6 lit/mis CuO
10 43 50 54
20 47 54 60
30 50 58 63
+ Water
40 55 67 66
50 62 69 69
60 67 70 72
70 69 72
80 71 90 73
Table : 12 Charging process Time with 0.08% concentration of CuO and different mass flow rates
Nano particle 0.08% Time in mins 2 lit/mi ns 4 lit/m ins 6 lit/m ins CuO + Water
10 41 52 53
20 50 57 59
30 55 63 64
40 60 67 70
50 63 70 72
60 66 73
70 69
80 71
GRAPHS
Figure 3. Charging process only with the water
0 50 100
0 50 100 150
PCM Tem p e ratu re
Time in mins
Charging process only with water 2liters/min 0 20 40 60 80
0 50 100
PCM Te m p e ratu re
Time in mins
Charging process only with water 4liters/min Nano particle 0.08% Time in mins 2 lit/mi ns 4 lit/mins 6 lit/mins
Al2O3 + Water
10 50 52 54
20 54 54 55
30 55 59 60
40 62 62 71
50 64 66 75
60 67 70
70 69 71
80 71 73
Figure 4. Charging process with water 4 litres/min and the time taken for the charging process is less
when compared to the 2 litres/min
Figure 5. Charging process with water 4 litres/min and time taken for the charging process is more less
compared with the water 2,4 litres/min
Figure 6. Charging process with the nanoparticle with the 0.02 Conc with the different flow rates
Figure 7. Charging process with the nanoparticle with the 0.02 Conc with the different flow rates and
the time taken is less when compared with the 0.02 Conc
Figure 8. Charging process with the nanoparticle with the 0.02 Conc with the different flow rates and the time taken is less when compared with the 0.02, 0.06
Conc
Figure 9. Charging process with the nanoparticle with the 0.02 Conc with the different flow rates
0 20 40 60 80
0 20 40 60 80 100
PCM
Te
m
p
e
ratu
re
Time in mins
Charging process only with water 6liters/min
0 20 40 60 80
0 50 100 150
PCM
Te
m
p
e
ratu
re
Time in mins
Base fluid+nano fluid(Al2O3 0.02con) charging process and different mass flow
rates
0 20 40 60 80
0 50 100 150
PCM
Te
m
p
e
ratu
re
Time in mins
Base fluid+nano fluid (Al2O3 0.05conc) charging process and
different mass flow rates
0 20 40 60 80
0 50 100
PCM
t
e
m
p
ar
atu
re
Time in minutes
Base fluid +nanofluid(Al
2O3
0.08con) charging process and
different mass flow rates
2 lit/min
4 lit/min
6 lit/min
0 50 100
0 50 100
P
CM
Tem
p
er
atu
re
Time in mins
Base fluid+nanofluid(CuO 0.02
con) charging process and
different mass flow rates
2 lit/min
4 lit/min
6lit/min
0 50 100
0 50 100
PCM
Te
m
p
e
ratu
re
Time in mins
Base fluid+nano fluid (CuO
0.05con) charging process and
Figure 10. Charging process with the nanoparticle with the 0.05 Conc with the different flow rates and
the time taken for the charging process for the CuO nanoparticle, the time is less when compared with the
0.02 Conc
Figure 11. Charging process with the nanoparticle with the 0.08 Conc with the different flow rates and
the time taken for the charging process for the CuO nanoparticle, the time is less when compared with the
0.02, 0.05 Conc
III. RESULTS AND DISCUSSIONS
By using the PCM the thermal energy storage for the total systems was compared with the plane water and by using the nanoparticles. The charging process required for the TESS system when compared with water the time taken for the charging process with the nanoparticles was less. So for the charging process required to raise the temperature was additionally increased the flow rates for the time reduction, in this experiment the different flow rates are 2,4 and 6. For the above flow rates the time reduction is 6 litres/min. As the thermal conductivity of the CuO is more the charging process for the TESS system with the high flow rates gives the good result within a short period of time for the many more usage applications, and the different nanoparticles with different concentrations with the different flow rates are explained in the table with the reference to the time and the temperature for melting of the PCM.
IV.
CONCLUSIONIn Thermal Energy storage System is developed for the supply of at the average temperature 450C for different applications. There are building applications, air heating, water heating, printing on the cotton cloths and also dying the threads etc. In this paper the charging process different experiments are conducted such as H2O, H2O+Al2O3 , H2O+CuO different concentrations of nano particles, different mass flow rates. From the experimental results it is concluded that less times taking of charging process is H2O+CuO when compared to only with water and H2O+Al2O3. Hence, it is concluded that by charging process times can be reduced by using nanoparticles.
V.
REFERENCES[1]. Das S.K., Putra N., Peter T., Roetzel w., (2003), “Temperature dependence of thermal conductivity enhancement for nanofluids”, journal of Heat Transfer, Vol. 125, 567-574. [2]. Khodadai, J.m., and Hosseinizadeh, S.F.,(2007),
“nanoparticle enchanced phase change materials (NEPCM) with great potential for improved thermal energy storage,” International Communicatioin in Heat Mass Transfer, 34,534-543.
[3]. Sharma A., Tyagi V.V., Chen C.R., Buddhi D. (2009), “Review on thermal energy storage with PCM and applications”, Renewable and sustainable Energy Reviews, 13,318-345.
[4]. Holman, J.P., 2004. Experimental methods for engineers, seventh ed, Tata Mcgraw-Hill Publishing Company Limited, New Delhi. [5]. C.kavirasu and D.prakash, Review of phase
change materials with Nanoparticles/Journal of engineering science and Technology Review 9 (4) (2016) 26-36.
0 20 40 60 80
0 50 100
PCM
Te
m
p
e
ratu
re
Time in mins