Original Research Article
Are other feasible options available for screening of risk assessment of
osteoporosis in postmenopausal women at community level in
Southern Coastal India
Gowry Reddy
1, Priya Rathi
2*, Unnikrishnan B.
2, Surendra Kamath
3, Kalpita Shringapure
4INTRODUCTION
Osteoporosis is a major health concern for
postmenopausal women worldwide. In India, the number of women with osteoporosis is increasing.1-5 According to some studies of the estimated 230 million Indians with osteoporosis over the age of 50 years, approximately 46
million (20% prevalence) are women.6 Precipitating risk factors include low peak bone mass, medication usage, hormonal factors, hereditary factors, race and menstrual status. 4-7 Various determinants are deemed significant, especially menstrual status, which is responsible for altering peak bone mass and bone remodelling prior to the commencement of menopause. It has been thus
ABSTRACT
Background: Osteoporosis is a chronic debilitating condition which exhibits iceberg phenomenon. Identification at an early stage of disease will enable preventive measures to reduce the incidence of disease and complications. Owing to the cost of diagnostic test, this study, various screening tools such as WHO fracture risk assessment tool, osteoporosis self-assessment tool for Asians, simple calculated osteoporosis risk estimation and osteoporosis risk assessment instrument have been used for assessment, in order to screen postmenopausal women in the preliminary stages.
Methods: A facility-based cross-sectional study was conducted among 107 postmenopausal women carried over a period of five months.
Results: Prevalence of osteoporosis and osteopenia was 24.3% and 69.2%. The area under the curve for osteoporosis self-assessment tool for Asians (OSTA), simple calculated osteoporotic risk estimation (SCORE) and osteoporotic risk assessment instrument (ORAI) was 0.731, 0.407 and 0.172 respectively. OSTA proved to be effective in differentiating normal BMD from low BMD score (i.e., osteopenia and osteoporosis) with a cut off of 1.1, SCORE to be more effective in screening osteoporosis than the other tools because it had a higher positive probability with a cut off 22. FRAX tool predicted probability of five and three percent probability of major fracture and hip fracture risk in ten years
Conclusions: Various tools assessed in the studies can be utilized at community level for identifying high risk women in post-menopausal stage but with different cut offs. This will reduce the cost of screening and also facilitate non pharmacological measures to reduce the progression of disease.
Keywords: Osteoporosis, Screening tools, Bone densitometry, Postmenopausal women
1
MBBS Student, Kasturba Medical College, Mangalore, Karnataka, India
2
Department of Community Medicine, 3Department of Orthopaedics, Kasturba Medical College, Mangalore, MAHE,
Karnataka, India
4
Tutor, Department of Preventive and Social Medicine, Medical College Baroda, Gujarat, India
Received: 30 November 2018 Accepted: 19 December 2018
*Correspondence: Dr. Priya Rathi,
E-mail: [email protected]
Copyright: © the author(s), publisher and licensee Medip Academy. This is an open-access article distributed under the terms of the Creative Commons Attribution Non-Commercial License, which permits unrestricted non-commercial use, distribution, and reproduction in any medium, provided the original work is properly cited.
documented that postmenopausal women have drastically lower bone mass than pre-and perimenopausal women.8
Several bone fragility measurements and techniques are available, most common being DEXA (Dual Energy X-Ray Absorptiometry), which is the current gold standard
in diagnosing osteoporosis. Some disadvantages
outweigh the benefits of early screening at a financially feasible level; disadvantage being the cost of equipment (7000 USD to 30,000 USD) with the actual screening cost ranging from 60-100 USD/patient, future risk of cancer due to exposure to radiation and unaffordability of patients from low-socioeconomic status in developing countries. 2,9
A variant of DEXA, an alternate screening modality– the ultrasound heel test; uses the quantitative ultrasound densitometer. This has shown to have similar advantages as in the DEXA, albeit with affordability. The specificity (sp) for predicting osteoporosis is quite high compared to its low sensitivity (sn); hence result of utilization of heel ultrasound densitometer is highly predictive of estimating the osteoporotic range of Bone Mineral Density (BMD) defined osteoporosis.10-15
In order to predict the occurrence and the degree of risk of being diagnosed with osteoporosis, a myriad of cost-effective screening tools, such as fracture risk assessment
tool (FRAX), osteoporosis self-assessment tool (OSTA), simple calculated osteoporotic risk estimation (SCORE), and osteoporosis risk assessment instrument (ORAI), have been developed for assessment which can be easily applied at community levels by peripheral health workers. These help to screen those at high risk and determine the need for directed therapeutic interventions and targeted therapies.10 There are studies which showed that these tools can be utilized in the community for screening. However, the standard cut-off for each tool differs from region to region.1-4,8,15 Hence our objectives were to assess the prevalence of osteoporosis and utility of various risk scores viz. SCORE, ORAI, FRAX, OSTA for screening of osteoporosis in postmenopausal women in comparison to ultrasound based densitometer in South India and to determine optimal cut offs of various screening tools in comparison to the heel bone densitometry.
METHODS
This is a cross-sectional study conducted between September 2016 to September 2017, among apparently healthy participants attending a bone mineral density (BMD) camp in the Department of Orthopaedics of a 600 multi-bed tertiary care specialty hospital. The study was approved by the Institutional Ethics Committee. Prior permission was taken from the appropriate authorities.
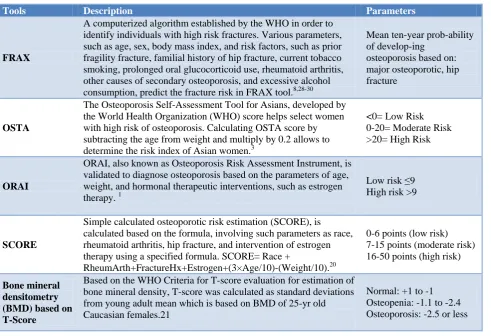
Table 1: Description of various screening tools used for diagnosis of osteoporosis.
Tools Description Parameters
FRAX
A computerized algorithm established by the WHO in order to identify individuals with high risk fractures. Various parameters, such as age, sex, body mass index, and risk factors, such as prior fragility fracture, familial history of hip fracture, current tobacco smoking, prolonged oral glucocorticoid use, rheumatoid arthritis, other causes of secondary osteoporosis, and excessive alcohol consumption, predict the fracture risk in FRAX tool.8,28-30
Mean ten-year prob-ability of develop-ing
osteoporosis based on: major osteoporotic, hip fracture
OSTA
The Osteoporosis Self-Assessment Tool for Asians, developed by the World Health Organization (WHO) score helps select women with high risk of osteoporosis. Calculating OSTA score by subtracting the age from weight and multiply by 0.2 allows to determine the risk index of Asian women.3
<0= Low Risk 0-20= Moderate Risk >20= High Risk
ORAI
ORAI, also known as Osteoporosis Risk Assessment Instrument, is validated to diagnose osteoporosis based on the parameters of age, weight, and hormonal therapeutic interventions, such as estrogen therapy. 1
Low risk ≤9 High risk >9
SCORE
Simple calculated osteoporotic risk estimation (SCORE), is calculated based on the formula, involving such parameters as race, rheumatoid arthritis, hip fracture, and intervention of estrogen therapy using a specified formula. SCORE= Race +
RheumArth+FractureHx+Estrogen+(3×Age/10)-(Weight/10).20
0-6 points (low risk) 7-15 points (moderate risk) 16-50 points (high risk)
Bone mineral densitometry (BMD) based on T-Score
Based on the WHO Criteria for T-score evaluation for estimation of bone mineral density, T-score was calculated as standard deviations from young adult mean which is based on BMD of 25-yr old Caucasian females.21
Normal: +1 to -1 Osteopenia: -1.1 to -2.4 Osteoporosis: -2.5 or less
Assuming Sn of the screening tools as 90%, precision of 4%, prevalence of osteoporosis 20%, level of significance of 5 % and power of 80% with a 10% non-response rate, the sample size calculated was 105.16 Convenience sampling method was used in the study. Apparently healthy postmenopausal women attending osteoporosis camp in hospital were included in the study. 107 postmenopausal women were approached. Participants with a history of metabolic bone disorders, osteoporosis, rheumatoid arthritis, renal disorders, cancer and using glucocorticoid were excluded. The participants were then briefed about the purpose of the study prior to data collection, and a written informed consent was obtained from them. A pre-tested semi-structured proforma was used to obtain information like socio-demographic details, reproductive history and questions related to risk scores.3,5,7,8,17 The women were then subjected to assessment of BMD using ultrasound densitometer. Socioeconomic status was calculated using modified Kuppuswamy scale.18
Anthropometric measurements such as weight and height; and BMD (using an ultrasound densitometer, the patient’s right heel calcaneus scan) were measured. BMI was calculated as weight/height (m2) according to the WHO standard for BMI classification.5,19 Details of index tools are mentioned in Table 1.
Data was analysed using Statistical Package for the Social Sciences (SPSS) Version 11.5. Prevalence of osteopenia and osteoporosis is expressed in percentage. Sn and Sp were calculated for each of the screening tools. Receiver operating characteristic (ROC) curve was used to determine optimal cut offs and area under the curve (AUC) used to determine the Sn and Sp of other screening tools in comparison to the heel bone densitometry.
RESULTS
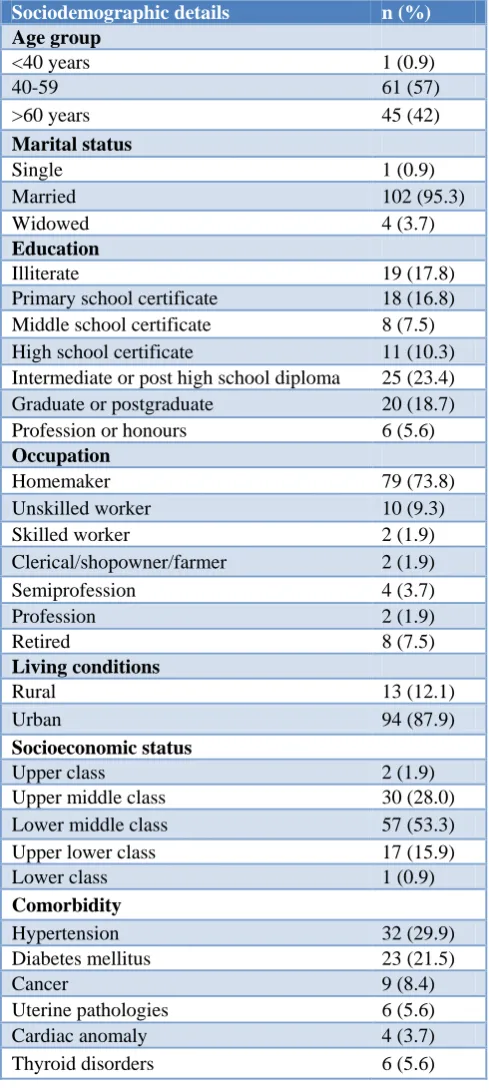
Of the 107 participants included in the study. Majority of them, 102 (95%) were married, with a quarter of the study population having an intermediate/post high school diploma (23.4%). Out of the 107 female participants, 79 (73.8%) were homemakers, and 94(87.9%) of them from urban areas and 57 (53.3%) of the female participants were from lower middle class, according to the modified Kuppuswamy scale. None of the female participants had abortions and 80 (74.8%) women had 2-5 children. Most of the participants had other comorbid conditions- 32 (29.9%) had hypertension; 23 (21.5%) had diabetes mellitus (Table 2).
The prevalence of osteopenia and osteoporosis was found to be 74/107 (69.2%) and 26/107 (24.3%) respectively. High risk women based on various tools has been depicted in Table 3. According to SCORE all women belonged to high risk group, as per ORAI 75% belonged to high risk and OSTA suggested 80% in high risk. According to FRAX tool the ten-year probability of
developing Major osteoporotic fracture and hip fracture was six percent and three percent of women respectively.
Table 2: Socio demographic details of study participants (n=107).
Sociodemographic details n (%) Age group
<40 years 1 (0.9)
40-59 61 (57)
>60 years 45 (42)
Marital status
Single 1 (0.9)
Married 102 (95.3)
Widowed 4 (3.7)
Education
Illiterate 19 (17.8)
Primary school certificate 18 (16.8)
Middle school certificate 8 (7.5)
High school certificate 11 (10.3)
Intermediate or post high school diploma 25 (23.4)
Graduate or postgraduate 20 (18.7)
Profession or honours 6 (5.6)
Occupation
Homemaker 79 (73.8)
Unskilled worker 10 (9.3)
Skilled worker 2 (1.9)
Clerical/shopowner/farmer 2 (1.9)
Semiprofession 4 (3.7)
Profession 2 (1.9)
Retired 8 (7.5)
Living conditions
Rural 13 (12.1)
Urban 94 (87.9)
Socioeconomic status
Upper class 2 (1.9)
Upper middle class 30 (28.0)
Lower middle class 57 (53.3)
Upper lower class 17 (15.9)
Lower class 1 (0.9)
Comorbidity
Hypertension 32 (29.9)
Diabetes mellitus 23 (21.5)
Cancer 9 (8.4)
Uterine pathologies 6 (5.6)
Cardiac anomaly 4 (3.7)
Thyroid disorders 6 (5.6)
high risk category. Hence the Sp of SCORE was calculated as 100%.
Table 3: Comparison of screening tools used in diagnosis of osteoporosis in female patients (n= 107).
Screening tool N (%) Normal Osteoporosis Sensitivity Specificity SCORE
High risk 107 (100) 81 26 - 100
ORAI N (%)
Low risk 27 (25.2) 22 05
80.7% 78%
High risk 80 (74.8) 59 21
OSTA N (%)
Low to moderate risk 22 (20.6) 14 08
27.16% 70%
High risk 85 (79.4) 67 18
FRAX Mean ten-year probability (%)
Major osteoporotic -fracture 5.78%
Hip fracture 2.29%
Figure 1a: ROC Curve differentiating osteoporosis from normal and osteopenia; 1b: ROC Curve differentiating normal from osteopenia and osteoporosis.
We constructed a ROC curve and estimated AUC for two different T-score cut offs. First curve (Figure 1a) is to differentiate osteoporosis from others (osteopenia and normal BMD), and the second curve (Figure 1b) to differentiate normal BMD from osteopenia and osteoporosis). We observed that in the initial stage of the disease SCORE performed better with a AUC of 0.714 (CI- 0.606-0.823); however, for the later stage of the disease, OSTA was a better predictor with a AUC of 0.731(CI- 0.553-0.908). The cut off for SCORE was found to be 22 (Sn- 96% and Sp- 40%) and for OSTA 1.1 (Sn- 71%, Sp- 51%).
DISCUSSION
Osteoporosis exhibits an iceberg phenomenon.20 Many Participants remain undiagnosed and directly present to the hospital with complications like fracture. By the time the fracture occurs, the disease has advanced to a stage
where prevention and reversal seem difficult. The ideal way is to identify osteoporosis in an early phase, such as osteopenia; where the effect of non-pharmacological measures can be maximized and the progression of the disease can be halted or slowed down.
Since DEXA and bone densitometry cannot be used as a cost effective tool in the community for screening, the four available risk assessment tools can be utilized at community level.
other studies as well. The sn of OSTA tool in other studies also varies with different population for instance it was 91% sn and 45% sp in Asian population ,56% and 69% in Canadian population,88% and 42% in rural south Indian population. ORAI sn and sp was found to be 52% and 67% in Asian post-menopausal women, 80% and 51% in Canadian women. Score sn and sp 72 and 46 percent. 91% and 61% in Asian postmenopausal women and Minnesota population.1,15,21-26
We observed that in the initial stage of the disease SCORE performed better with a AUC of 0.714 (CI- 0.606-0.823); however, for the later stage of the disease, OSTA was a better predictor with a AUC of 0.731 (CI- 0.553-0.908) with cut offs of 22 and 1.1.
This, when compared to the study done by Sharma et al showed that SCORE had AUC (ROC curve) of 0.81, and a Sn of 91% and a Sp of 40% in the validation group at cut off of 9.8 Studies conducted by Yang, Chen and Crandall, Panichiyawat, demonstrated that OSTA had AUC of 0.824, 0.8, 0.75 and 0.65 respectively. 23,24,27,28
With the cut off in this validation group, SCORE and OSTA can be used as an effective tool to differentiate normal from low BMD Participants (i.e., osteopenia and osteoporosis). This reinforces that these tools must be validated for each indigenous population for effective use at community level.
CONCLUSION
SCORE is an effective tool to distinguish between osteopenia and normal BMD with a cut off of 22; can be used primarily to prevent further disease progression. Whereas OSTA can be used to in later stages of the disease with a cut off of 1.1.
Recommendations
Screening tools like OSTA, SCORE, ORAI and FRAX cannot be directly adopted in any local population with the standard cut offs. However, a population specific cut offs may be helpful in assessing the high risk women. We also found that not all tools perform same in our population. Based on the AUC, we can conclude that during the preliminary stages.
Funding: No funding sources Conflict of interest: None declared
Ethical approval: The study was approved by the Institutional Ethics Committee
REFERENCES
1. Cadarette SM, Jaglal SB, Kreiger N, McIsaac WJ, Darlington GA, Tu JV. Development and validation of the osteoporosis risk assessment instrument to facilitate selection of women for bone densitometry. CMAJ. 2000;162:1289–94.
2. RudB, Jensen JE, Mosekilde L, Nielsen SP, Hilden
J, Abrahamsen B. Performance of four clinical
screening tools to select peri- and early
postmenopausal women for dual X-ray
absorptiometry. Osteoporos Int. 2005;16(7):764-72.
3. Kedros JG, Sybrowsky CL, Stoddard GJ. The
osteoporosis self-assessment screening tool: a useful tool for the orthopaedic surgeon. J Bone Joint Surg [AM]. 2007;89(4):765-72.
4. Ribot C, Pouilles JM, Bonneau M, Tremollieres F (1992) Assessment of the risk of post-menopausal osteoporosis using clinical factors. Clin Endocrinol. 1992;36:225–8.
5. Kataria S, Pareek P, Dadhich A, Kataria K, Bhati M.
The Effect of Body Mass Index on Bone Mineral Density in pre and postmenopausal women of Western Rajasthan population. Int J Biol Med Res. 2012;3(3):1899-901.
6. Khadilkar AV, Mandlik RM. Epidemiology and
treatment of osteoporosis in women: an Indian perspective. International J Women’s Health. 2015;7:841-50.
7. Jain V, Agrawal BK, Varshney A. Prediction of
bone mineral density by age, body mass index and menopausal status in middle socioeconomic status women of urban kolar region of Bhopal. IOSR J Dental Medical Sci. 2013;12(3):17-21.
8. Sharma S, Khandelwal S. Effective risk assessment
tools for osteoporosis in the Indian menopausal female. J Midlife Health. 2010;1(2):79-85.
9. DEXA Bone Density Scan: Advantages and
Disadvantages of DEXA Scan. Available at: http://orthopedics.ygoy.com/2010/08/24/dexa-bone- density-scan-advantages-and-disadvantages-of-dexa-scan/. Accessed on 18 July 2018.
10. Hashmi FR, Elfandi KO. Heel Ultrasound Scan in Detecting Osteoporosis in Low Trauma Fracture Patients. Orthopedic Reviews. 2016;8(2):6357. 11. Miller PD, Zapalowski C, Kulak CAM, et al. Bone
densitometry: the best way to detect osteoporosis and to monitor therapy. J Clin Endocrin Metab. 1999;84:1867–71.
12. Perez D, Marin AF, Vila J, Abizanda M, Cervera A,
Carbonell C, et al. Evaluation of calcaneal quantitative ultra- sound in a primary care setting as a screening tool for osteoporosis in post- menopausal women. J Clin Densitom. 2003;6:237.
13. Langton CM, Ballard PA, Bennett DK, Purdie DW.
A comparison of the sensitivity and specificity of calcaneal ultrasound measurements with clinical criteria for bone densitometry (DEXA) referral. Clin Rheumatol. 1997;16:117-8.
14. Kala BS. Assessment of Risk for Osteoporosis
Among Postmenopausal Women. . International
Journal of Pharma and Bio Sciences.
2016;7(3):1000–4.
15. Koh LK, Sedrine, WB, Torralba TP, Kung A,
16. Rao H, Rao N. Sharma LR. A clinical study of boné mineral density using heel ultra-densitometer in Southern Maharashtra. Indian J Orthop. 2003;37:9.
17. Geusens P, Hochberg MC, van der Voort DJ, et. al.
Performance of risk indices for identifying low bone density in postmenopausal women. Mayo Clin Proc. 2002;77(7):629-37.
18. Singh T, Sharma S, Nagesh S. Socio-economic
status scales updated for 2017. Int J Res Med Sci. 2017;5:3264-7.
19. BMI Classification: Global Database on Body Mass
Index. [Internet]. WHO. 2006. Available at: http://apps.who.int/bmi/index.jsp?introPage=intro_3 .html. Accessed on 18 July 2018.
20. Muslim DAJ, Mohd EF, Sallehudin AY, Tengku
Muzaffar TMS, Ezane AM. Performance of Osteoporosis Self-Assessment Tool for Asian (OSTA) for Primary Osteoporosis in Post-menopausal Malay Women. Malaysian Orthopaedic J. 2012; 6(1): 35-9.
21. Chowdhury, B. Assessment of bone mineral density
and osteoporosis status in elderly Indian population.
International J Clin Experimental Physiol.
2014;1(3): 232-4.
22. Mishra SK, Trivedi A, Neelkanth N, Trivedi A. A camp based screening ofBMD in medical students: early detection of an iceberg phenomenon. Int J Res Med Sci. 2018;6:1273-6.
23. Chen SJ, Chen YJ, Cheng CH, Hwang HF, Chen
CY, Lin MR. Comparisons of Different Screening Tools for Identifying Fracture/Osteoporosis Risk
Among Community-Dwelling Older People.
Medicine (Baltimore). 2016;95(20):3415.
24. Crandall CJ, Larson J, Gourlay ML, Donaldson
MG, LaCroix A, Cauley JA, et al. Osteoporosis
screening in postmenopausal women 50 to 64 years old: comparison of US Preventive Services Task Force strategy and two traditional strategies in the Women's Health Initiative. J Bone Miner Res. 2014;29(7):1661-6.
25. Pecina JL, Romanovsky L, Merry SP, Kennel KA, Thacher TD. Comparison of Clinical Risk Tools for Predicting Osteoporosis in Women Ages 50-64. J Am Board Fam Med. 2016;29(2):233-9.
26. Cherian KE, Kapoor N, Shetty S, Naik D, Thomas N, Paul TV. Evaluation of Different Screening Tools for Predicting Femoral Neck Osteoporosis in Rural South Indian Postmenopausal Women. J Clin Densitom. 2018;21(1):119-24.
27. Yang Y, Wang B, Fei Q, Meng Q, Li D, Tang H et
al. Validation of an osteoporosis self-assessment tool to identify primary osteoporosis and new osteoporotic vertebral fractures in postmenopausal Chinese women in Beijing. BMC Musculoskelet Disord. 2013;14:271.
28. Panichyawat N, Tanmahasamut P. Comparison of
OSTA index and KKOS scoring system for prediction of osteoporosis in postmenopausal women who attended Siriraj Menopause Clinic. J Med Assoc Thai. 2012;95(11):1365-71.