https://dx.doi.org/10.24001/ijaems.3.5.9 ISSN: 2454-1311
Real Time Power System and Sub Synchronous
Inter Harmonics
Milan Sasmal, Biswamoy Pal, Sudip Das, Partha Das
Asst. Professor, JIS College of Engineering, W.B., India
Abstract— Real time Power system is associated with different types of abnormalities which percolate into the system thus generating various spurious signals, which ultimately results in massive breakdown of the same. In this scope of work, we have intended to design a real time power system using MATLAB (Version7.8.0.347) (R2009a) and incorporating Continuous Wavelet Transform and also we have developed a program for effective identification of sub-harmonics, generated or carried into the system due to the power system behavioral nature.
Keyword— Sub synchronous Inter harmonics, fault, continuous wavelet (CWT), power system, single phasing, ground fault.
I. INTRODUCTION
Power Quality [1,5] has regained consciousness due to certain visual effects occurring in the day to day household applications. Some of the inevitable visual effects due to sub-harmonics[2.4] being present in a system are listed as Television Receivers, Fluorescent and mercury arc lighting, Computers, Lamp Flicker, Washing Machines. These sub-harmonic components of frequency are expected to be generated from high frequency supplies been fed to arc or blast furnaces which back feeds into the system thus generating other spurious signals, which are detrimental for our household appliances and results in ageing of the same in due time.
Power Quality is of utmost concern now-a-days to endure system reliability and to cater customer needs of decreased tariff rate. In this regard identification of specialized harmonic content is of utter importance. In this work, we have developed a program using Continuous Wavelet Transform to find out sub-synchronous inter-harmonic[2,4,5] content of a real time signal obtained from industry. The program is also able to find out sub-synchronous inter harmonics of a particular signal in the different ranges of frequency which has various detrimental effects on the household appliances.
II. CIRCUIT DIAGRAM
In our scope of work we have developed a real time power system (dual feeding), using MATLAB (Version 7.8.0.347)
(R2009a) for our reliability analysis [3] purpose. The Block Diagram of the developed circuit is given below:-
MODEL 1. BLOCK DIAGRAM OF THE DEVELOPED CIRCUIT The circuit specifications are listed below:
Alternator:- Frequency 50Hz, 6*350MVA, 13.8kv, 1500MW
Load1:- 100MW
Transformer1:- 6*350MVA, 13.8/735KV
Circuit Breakers:- Transition time 5/50
Breaker resistance 0.001ohms, Snubber resistance and snubber capacitances infinity
Line: - 300 Km
3ph series RLC load:-330MVAR
Transformer 2:- 300MVA, 735/230/25KV
3ph RL load: - 30000MVA, 735KV
3 phase series compensator:- Line reactance in positive sequence 105.6ohms, series capacitance 62.8 micro Farad, the nominal capacitor voltage is taken at 2 kA r.m.s. line current, MOV protection level required to protect the capacitors at 2.5 times the nominal capacitor voltage.
III. THE DETAILED ALGORITHM OF THE
DEVELOPED PROGRAM IS GIVEN BELOW 1) x(t) is the signal to be analyzed
2) A mother wavelet like Daubechies 10 is chosen to serve as a prototype of windows in the process 3) Other windows are dilated/compressed and shifted
versions of the mother wavelet
10) The above steps are repeated now, for different values
of ‘s’
11) The value of ‘s’ is incremented up to 10.
12) This corresponds to the sampling of the time-scale plane
13) When the above process is completed for all values of
‘s’, the CWT of the signal is said to be calculated.
IV. CASE STUDY
The various case studies are listed below:
Case Study 1: Single phasing & ground fault simultaneously
Case Study 1.1: 3 phase circuit with single phasing in phase A & line to ground fault in phase A
Fig. 1: Voltage and current spectrums of Bus 1 after single phasing of Phase A and Ground fault of the same
The above spectrums of Bus B1 Vabc shows that each phase has sag, swell, notches which are visible in each phase spectrum.
The current spectrum also shows initial transient state. It seems that some sub-harmonics are present in the current spectrum. Also the current spectrum for phase A becomes zero after 5 cycles which was set by the circuit breaker to obtain single phasing of the 3 phase circuit under operating condition.
[A phase-Blue colour, B phase-Green colour, C phase-Red colour]
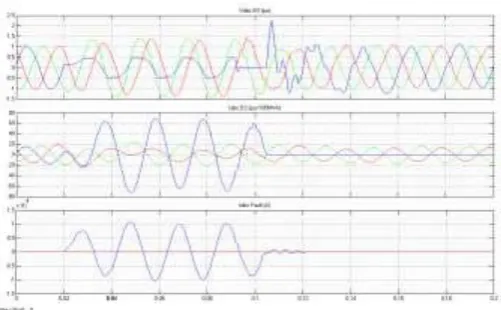
Fig. 2: Voltage, current and fault current spectrums of Bus 2after single phasing of Phase A and Ground fault of the
same
Figure 9 shows that Harmonic distortion in the voltage spectrum is much clear in the bus 2 voltage spectrum. The current spectrum also shows some notches at the tips. Due to single phasing, the magnitude of current in the phase A has become twice of the regular magnitude under balanced condition which will cause burning of the phase of the 3 phase circuit resulting in active single phase condition while running. The voltage spectrum[2] of phase A becomes zero between time instants of 0.09-0.11 sec and then again a steep rise in abnormal voltage of twice the magnitude under healthy condition is seen. But again the system goes into steady state with the aid of MOV (Metal Oxide Varister) and series compensators connected to the load end.
Thereafter the current spectrum of Bus 1 and Bus 2 was analyzed using Continuous Wavelet Transform to check whether any sub-harmonic content is present or not.
Case Study 1.2: Continuous wavelet[2,4] Transform analysis of the current spectrum of phase A, B, C of Bus 1 under single phasing of phase A and line to ground fault condition
https://dx.doi.org/10.24001/ijaems.3.5.9 ISSN: 2454-1311
Fig. 4: CWT analysis of current- spectrum of Bus 1 (Phase B)
Fig. 5: CWT analysis of current- spectrum of Bus 1 (Phase C)
It is very clear from the fig. 3 that sub-harmonics of 0.1Hz is clearly visible in the output spectrum whose amplitude is 0.4 occurring at a time instant between 1400-1510 seconds. The above figure 4 shows no such visible distortion except between time instants of 1900-2500 sec. But their magnitudes are not so significant which can be neglected in comparison to the phase A harmonic spectrum.
The figure 5 also shows no such visible distortion except between time instants of 1900-2500 sec. But their magnitudes are not so significant which can be neglected in comparison to the phase A harmonic spectrum.
Case Study 1.3: Continuous wavelet Transform analysis[2] of the current spectrum of phase A, B, C of Bus 2 under single phasing of phase A and line to ground fault condition
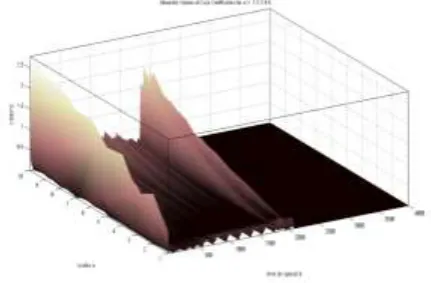
FIG. 6. CWT ANALYSIS OF CURRENT- SPECTRUM OF BUS 2 (PHASE A)
Fig. 7: CWT analysis of current- spectrum of Bus 2 (Phase B)
Fig.8: CWT analysis of current- spectrum of Bus 2 (Phase C)
It is very clear from the above fig.6 that here at the load end the distortion in current spectrum is much more severe which will percolate into the household appliances in no time, thus damaging the same. Here the 0.1Hz frequency is predominant twice, one between time instant between 500-1400 seconds, having amplitude 0.5Hz and the other between 1750-2100 seconds, having amplitude of 1.9 which is significant.
Figure 7 is seen to have harmonics of 0.1Hz frequency of amplitude value 0.5, occurring in the time instant between 1800-2300 seconds.
Figure 8 is seen to have harmonics of 0.1Hz frequency of amplitude value 0.5, occurring in the time instant between 1800-2500 seconds.
Case Study 2: Ground fault without single phasing Case Study 2.1: 3 phase circuit with only ground fault without any single phasing in phase A
Fig. 10: Voltage and current spectrums of Bus 2 under ground fault condition of phase A
Figure 10 voltage spectrum shows the presence of DC offset, which is visible between time intervals of 0.02-0.09seconds. In addition to it overvoltage and under voltages are also visible in the output frame. Current spectrum is seen to have some harmonics in the output frame but fractional harmonics is assumed to be not appearing in the output frame which will be clear after CWT[2,4] analysis of phase current. Also the use of series compensators and MOV clears the fault after a certain interval of time and renders reliable behavior of the developed power system with zero fault current under running condition.
Case Study 2.2: Continuous wavelet Transform analysis of the current spectrum of phase A, B, C of Bus 1 under line to ground fault condition of phase A
Fig. 11: CWT analysis of current- spectrum of Bus 1 (Phase A)
Fig. 12: CWT analysis of current- spectrum of Bus 1 (Phase B)
Fig. 13: CWT analysis of current- spectrum of Bus 1 (Phase C)
Figure11 shows sub-harmonics of very minute amount of amplitude between time 1700sec & 3000sec
Fig.12 shows in distortion at phase B of bus 1 except sub-harmonics of amplitude nearly 0.4 between time 1900-2400sec.
No such spurious injection in the current spectrums of A,B,C phases is seen except in Figure 13, where 0.1Hz is visible with amplitude of 0.3 occurring in the time instant of 1900-2200 seconds.
Case Study 2.3: Continuous wavelet Transform analysis of the current spectrum of phase A, B, C of Bus 2 under line to ground fault condition of phase A
https://dx.doi.org/10.24001/ijaems.3.5.9 ISSN: 2454-1311
Fig. 15: CWT analysis of current- spectrum of Bus 2 (Phase B)
Fig. 16: CWT analysis of current- spectrum of Bus 2 (Phase C)
The above fig. 14 shows that phase A has huge amount of sub-harmonics embedded into it whose lumped nature shows its peak amplitude between 1.65-2 occurring in the time instant of 1500-2000seconds. Also o.1Hz is peaking out at time interval of 2000-2500 seconds with amplitude ranging between 0.5-1.
Figure 15 shows no such infiltration of fractional harmonics in the phase current spectrum.
The response in figure 16 shows that here the sub harmonics are embedded with adjacent frequencies, yet between time instants of 1800-2200 seconds the lumped parameter repose peaks out with amplitude 0.5.
Case Study 3: Single phasing without ground fault Case study 3.1: 3 phase circuit with single phasing at phase A without any ground fault.
Fig. 17: Voltage and current spectrums of Bus 1 when single phasing at phase A
Bus B1 Vabc spectrum shows a very small distortion in magnitude of phases B & C after time 0.1secs.Swell is visible in phase B and sag in phase C after time 0.1sec. The current spectrums of each phase shows swell till 0.1secs. The current spectrum for phase A becomes zero after 5 cycles which was set by the circuit breaker to obtain single phasing of the 3 phase circuit. After phase A becomes zero, the swell only can be seen in phase B and sag in phase C.
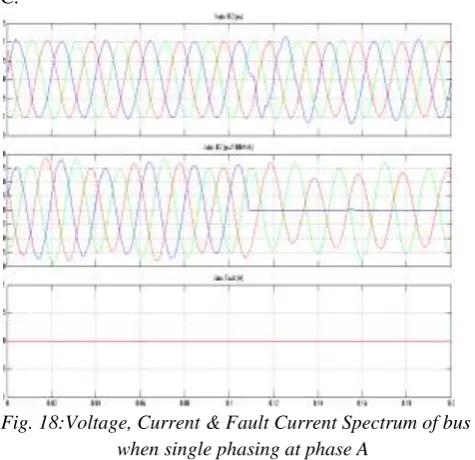
Fig. 18:Voltage, Current & Fault Current Spectrum of bus 2 when single phasing at phase A
The current waveform distortion and swell in the Iabc spectrum can be seen. Due to single phasing, the magnitude of current in the phase A has become zero after 5 cycles. Before single phasing swell can be seen in each phase and after single phasing swell in phase B and sag in phase C happen.
Fig. 19: CWT analysis of current- spectrum of Bus 1 (Phase A)
Fig. 20: CWT analysis of current- spectrum of Bus 1 (Phase B)
Fig. 20: CWT analysis of current- spectrum of Bus 1 (Phase B)
Fig. 21: CWT analysis of current- spectrum of Bus 1 (Phase C)
In fig.19 shows the phase A of bus 1 consists sub-harmonics of amplitude 0.4 in time 2200secs.Here no such heavy amount of sub-harmonics are present.
In fig. 20 No such sub-harmonics of considerable magnitude are present. Though single phasing of phase A is made but still there is no such sub-harmonics present at the bus1 of source end.
In fig. 21 No such sub-harmonics of considerable magnitude are present. Though single phasing of phase A is made but still there is no such sub-harmonics present at the bus1 of source end.
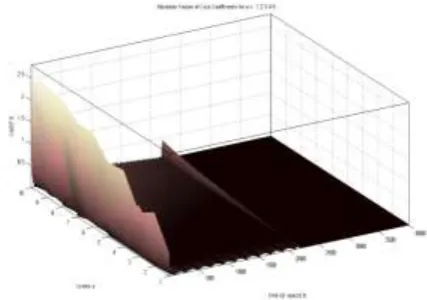
Case Study 8.3: Continuous wavelet Transform analysis of the current spectrum of phase A of Bus 2 when single phasing at phase A.
https://dx.doi.org/10.24001/ijaems.3.5.9 ISSN: 2454-1311
Fig. 23. CWT analysis of current- spectrum of Bus 2 (Phase B)
Fig. 24. CWT analysis of current- spectrum of Bus 2 (Phase C)
In fig.22 shows the phase A of bus2 consists sub-harmonics of amplitude 0.4 in time 2200secs.Here no other sub-harmonics are present.
In fig.23 no such sub-harmonics of considerable magnitude are present. In between time instant 2200-2600secs some very small magnitude of sub-harmonics can be seen. In fig.24 No such sub-harmonics of considerable magnitude are present. In between time instant 2200-2600secs some very small magnitude of sub-harmonics can be seen.
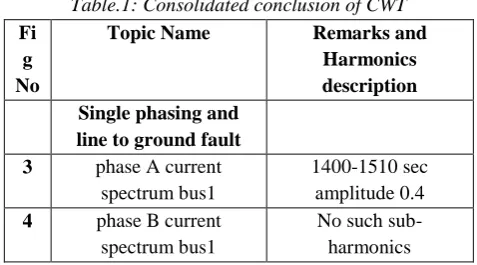
Table.1: Consolidated conclusion of CWT
Fi g No
Topic Name Remarks and
Harmonics description Single phasing and
line to ground fault 3 phase A current
spectrum bus1
1400-1510 sec amplitude 0.4 4 phase B current
spectrum bus1
No such sub-harmonics
5 phase C current spectrum bus1
No such sub-harmonics 6 phase A current
spectrum bus2
500-1400sec amplitude 0.5 1750-2100sec amplitude 1.9
7 phase B current spectrum bus2
1800-2300sec amplitude 0.5 8 phase C current
spectrum bus2
1800-2500sec amplitude 0.5 Only line to ground
fault 11 Current spectrum
phase A bus1
No such sub harmonics 12 Current spectrum
phase B bus1
No such sub harmonics 13 current spectrum phase
C bus1
1900-2200sec amplitude 0.3 14 Current spectrum
phase A bus2
1500-2000sec amplitude 1.5-2.0
2000-2500sec amplitude 0.5-1.0 15 Current spectrum
phase B bus2
No such sub harmonics 16 Current spectrum
phase C bus2
1800-2200sec amplitude 0.5 With single phasing
& without ground fault 19 phase A current
spectrum bus1
2200 sec amplitude 0.4 20 phase B current
spectrum bus1
No such sub Harmonics 21 phase C current
spectrum bus1
No such sub Harmonics 22 phase A current
spectrum bus2
2200 sec amplitude 0.4 23 phase B current
spectrum bus2
No such sub Harmonics 24 phase C current
spectrum bus2
No such sub Harmonics
V. CONCLUSION
of Sub-synchronous Inter-harmonics in Power System Signals under non-sinusoidal environment”, LCIT, National Journal of Engineering & Technology, Vol I, 2012,Special issue on proceedings of “National Conference on Advances and Challenges in
Engineering & Science”.
[3] Tse.F.C.Norman & Lai.L.L, “Research Article
-Wavelet Based Algorithm for Signal
Analysis”,Hindawi Publishing Corporation, EURASIP
Journal on Advances in Signal Processing, Volume 2007, Article ID 38916, 10 pages, doi: 10.115/2007/38916.
[4] Barros.J, Apraiz de.M & Diego.T.R, “Measurement of
Sub harmonics in Power Voltages”, Paper ID: 31.
[5] Arrilaga.J, Watson.N.R,”Power System Harmonics”,