A theoretical model to predict customer satisfaction in relation to service
quality in selected university libraries in Sri Lanka
Chaminda Jayasundara
1, Patrick Ngulube
2and Mabel K Minishi-Majanja
3Department of Information Science, University of South Africa [email protected]; [email protected]; [email protected]
Received 30 September 2009 Accepted 30 November 2009
University library administrators in Sri Lanka have begun to search for alternative ways to satisfy their clientele on the basis of service quality. This article aims at providing a theoretical model to facilitate the identification of service quality attributes and domains that may be used to predict customer satisfaction from a service quality perspective. The effectiveness of existing service quality models such as LibQUAL, SERVQUAL and SERVPREF have been questioned. In that regard, this study developed a theoretical model for academic libraries in Sri Lanka based on the disconfirmation and performance-only paradigms. These perspectives were considered by researchers to be the core mechanism to develop service quality/customer satisfaction models. The attributes and domain identification of service quality was carried out with a stratified sample of 263 participants selected from postgraduate and undergraduate students and academic staff members from the faculties of Arts in four universities in Sri Lanka. The study established that responsiveness, supportiveness, building environment, collection and access, furniture and facilities, technology, Web services and service delivery were quality domains which can be used to predict customer satisfaction. The theoretical model is unique in its domain structure compared to the existing models. The model needs to be statistically tested to make it valid and parsimonious.
Keywords: Disconfirmation, performance-only, expectancy disconfirmation, models, service quality in academic libraries, user satisfaction
1 Introduction
Gauging customer satisfaction through service quality studies has become one of the most popular marketing strategies, and it is an approach that infiltrates many academic disciplines. As a result, many commercial service quality studies have been commissioned by numerous service providers (Azar 2007; Badri, Abdulla & Al-Madani 2005) as it is critical for such service providers to prove their strength in business performance in a competitive business environment (Chowdhary & Prakash 2007; Park 2007).
Service quality, a multi-dimensional concept with multi-attributes, means different things to different people (Brady & Cronin 2001; Dabholkar 1996). Moreover, defining quality is a difficult task due to its generic nature. Even though standards for the definition of quality may be set, these standards vary from phenomenon to phenomenon, culture to culture, and across time. As long as attributes of phenomena are quantifiable and may be measured and controlled, setting standards to establish quality will not be a problem, as in the case of establishing the quality of gold on the basis of control procedures using carats. It becomes problematic when we attempt to measure and quantify qualitative attributes, such as excellence, luxury, satisfaction and delight because such aspects are quite often very subjective (Snoj 1995:96-98). Therefore, studies on service quality may not be consistent across different contexts.
2 Statement of the problem
Administrators in the libraries of the Sri Lankan universities are left to ponder ways and means of satisfying customers and providing good quality service that meets customers’ perceptions (Quality Assurance Accreditation Council 2008). The different indicators of service quality in the university library sector are not always understood. The use of customers’ expectations and/or perceptions of performance of various service quality attributes/domains are essential to determining the most effective means of predicting customer satisfaction. Even though studies on customer satisfaction pertaining to several socio-economic sectors based on quality of service are available, specific studies on predicting customer satisfaction in university libraries in Sri Lanka, based on quality of services, are limited.
1. Chaminda Jayasundara is a PhD candidate in the Department of Information Science, University of South Africa, Pretoria, and Head of E-learning Department, Central Library, University of Colombo, Sri Lanka.
2. Patrick Ngulube (PhD) is a Professor of Information Science, University of South Africa and editor-in-chief of the ESARBICA Journal: Journal of the Eastern and Southern Africa Regional Branch of the International Council on Archive.
Although adequate resources, facilities and staff are made available at university libraries in Sri Lanka, the emphasis on the delivery of quality service is lacking (Quality Assurance Accreditation Council 2007). Library administrators consider emphasis on predicting customer satisfaction in relation to service quality as very critical. This was underscored by the librarians at the University of Colombo and University of Sri Jayewardenepura, who stressed that, “if we as librarians are not thinking about our customers’ satisfaction and service quality in our libraries, we should not think of the future sustainability of our libraries to any further extent” (Quality Assurance Accreditation Council 2007). This study therefore aims to address that need by developing a theoretical model to facilitate the identification of service quality attributes and domains that may be used to predict customer satisfaction from a service quality perspective.
3 Conceptual perspectives
Researchers concur that service quality should be defined and measured from the customer’s perspective. Ghobadian, Speller and Jones (1994) and Enquist, Edvardsson and Sebhatu (2007) posit that most service quality definitions fall within the “customer-led” category, and Juran (1999:21) elaborates further by defining customer-led quality as “features of products or service” that meet customers’ needs and thereby provide customer satisfaction. The most widely accepted definition of service quality delineates the discrepancy between customers’ expectations and their perceptions of service performance. Accordingly, service quality refers to the comparison customers make between their expectations and their perceptions of the service received (Parasuraman, Zeithaml & Berry 1985). This definition is based on the expectancy disconfirmation theory (Churchill & Suprenant 1982; Parasuraman, Zeithaml & Berry 1994), which is one of the psychological theories available in the area of consumer behaviour in service marketing. This theory is also called expectancy confirmation theory (Chea & Luo 2006).
The underpinning paradigm of the expectancy disconfirmation theory is termed the “disconfirmation paradigm”. As the paradigm is based on the premise that a customer compares actual (perceived) performance with a standard (expectation), disconfirmation is the discrepancy between performance and expectation. As a result:
Disconfirmation (d) = Performance (P)–Expectation (E)
In terms of mathematical representation, disconfirmation is expressed as follows:
d = P-E ………..….(i)
Thus, confirmation occurs when performance matches expectations. If performance is better than expectations, it creates positive disconfirmation. In contrast, when performance is below standard, it creates negative disconfirmation (Cadotte, Woodruff & Jenkins 1987). Parasuraman, Zeithaml and Berry (1988:17) developed the gap model of service quality based on the disconfirmation paradigm, and defined service quality as “the degree and direction of discrepancy between consumers’ expectations and perceptions,” with regard to the service. Accordingly,
Service Quality (SQ) = Performance of service (P) – Expectation of service (E)
In a mathematical representation, it is:
SQ=P-E……………….…….(ii)
As the disconfirmation is equal to the subtraction of performance versus expectation, as depicted in formula (i) SQ = (d); it may be taken to mean that service quality is a function of disconfirmation (Hamer 2006; Lee, Lee & Yoo 2000). Mathematically, it is:
SQ = f(d) [Service quality is a function of disconfirmation]
Although early service quality researchers defined satisfaction as an antecedent of service quality, it has now been generally accepted that service quality is an antecedent of customer satisfaction (Chandrashekaran et al., 2007: 161; Dabholkar, Shepherd & Thorpe 2000: 166). Thus, it demonstrates that customer satisfaction is a function of service quality, while service quality is a function of disconfirmation. Accordingly,
SQ = f(d) [Service quality (SQ) is a function of disconfirmation(d)] (Lee, Lee & Yoo 2000; Parasuraman, Zeithaml & Berry 1985)
CS = f (SQ) [Customer satisfaction (CS) is a function of service quality (SQ)] (Iacobucci, Ostrom & Grayson 1995; Zeithaml, Berry & Parasuraman 1993).
Hence,
CS = f(d) [Customer satisfaction is a function of disconfirmation] (Khalifa & Liu 2002; Szymanski & Henard 2001).
perceived performance characteristics of the service. Since this theory focuses only on the performance of a given service or product, it is called the “performance-only paradigm”. Thus, this paradigm expounds that:
Service quality (SQ) = f(Performance (P) of the service) (Brady, Cronin & Brand 2002; Cronin & Taylor 1992). The mathematical representation of the above is:
SQ = f(P) [Service Quality is a function of Performance]
As, CS = f(SQ) [As Customer Satisfaction is a function of Service Quality…]
CS=f(P) [Customer Satisfaction is a function of Performance]
Nevertheless, in the absence of a perfect agreement, the question arises as to which of the two methodologies is supreme, that is, whether or not customer satisfaction is a function of disconfirmation or performance - only scores of service quality. In that light, the disconfirmation and performance-only paradigms based on the expectancy disconfirmation and performance theories guided this study in the context of selected university libraries in Sri Lanka. 4 University libraries in Sri Lanka and their customers
The first university library in Sri Lanka was established in 1942 at the University College in Colombo. Since then, the number has expanded to 31 libraries attached to 15 national universities, seven postgraduate institutions and nine other higher education institutes (University Grants Commission of Sri Lanka 2007).
The customer categories/user segments comprise undergraduates, postgraduates and academic staff who use university libraries for reading study materials and accessing electronic information resources. Undergraduate students use the libraries more regularly than the other categories of users, as they form the majority in the higher education sector (Dambavinna 2005). Technical staff and junior staff which comprise labourers, attendants, and binders rarely visit the libraries to fulfil their specific informational needs.
The competitive position of university libraries in Sri Lanka is complicated by the fact that, unlike many of their competitors such as the libraries attached to non - governmental agencies, foreign missions, book publishers, and so on, they are financed by the state. Some state authorities question the worthiness of allocating significant amounts of money for libraries instead of allocating those funds for development activities in the country. Therefore, in many ways, public opinion makers characterise the libraries as “white elephants,” although the people who are responsible for the libraries argue in favour of their social importance. As education is free in Sri Lanka with the exception of the postgraduate level, the value of library services is low. In developed market economies, education services are paid for directly by students, whose expectations of library services are consequently higher than those held by students paying indirectly through taxes paid by some of their guardians (Broady - Preston & Preston 1999).
However, a quality assurance scheme was introduced to the university sector in 2007, and libraries are now assessed by the Quality Assurance and Accreditation Council (QAA) of Sri Lanka. Library assessment helps university library administrators to understand what works well or poorly and to identify current strengths and weaknesses. Customer assessment can provide invaluable data to libraries for re - orienting their collections, services and activities in order to effectively meet the informational needs of their valued customers (Shi & Levy 2005). Therefore, the two authors believe that the time has come to evaluate the quality and significance of university library services from the perspective of customers. Zeithaml, Parasuraman and Berry (1990:16) suggest that:
… the only criteria that count in evaluating service quality are defined by customers. Only customers judge quality; all other judgments are essentially irrelevant. Specifically, service quality perceptions stem from how well a provider performs, that is, customers expectations about how the provider should perform.
In contrast, some researchers and practitioners may have problems with the phrase: “all other judgments are essentially irrelevant”, because professional judgments may also be relevant in evaluating service quality. Even though professional opinions are relevant and appropriate for judging service quality, if the customers are reluctant to accept these judgments, the provision of services will not be founded on customer expectations. Thus, it will damage the whole marketing chain of the library, including the continuation of improved customer loyalty and greater customer retention, because it will be ignoring customers’ expectations with regard to service delivery.
5 Service quality models for measuring customer satisfaction in libraries
two popular service quality models that are being used worldwide to measure service quality. They are SERVQUAL and SURVPREF.
The SERVQUAL model was developed by Parasuraman, Zeithaml and Berry (1988), based on the disconfirmation paradigm. The model is also referred to as the “gap model,” underscoring the expectancy disconfirmation theory. The gap model defines service quality as a function of the gap between customers’ expectations of a service and their perceptions of the performance of actual service delivery by an organisation. Based upon five domains, that is, tangibles, reliability, responsiveness, assurance and empathy, Parasuraman, Zeithaml and Berry (1988) posited that service quality could be measured by obtaining the difference between perceptions of performance and the expectations in those domains. The five domains of service quality in SERVQUAL are depicted by 22 attributes. The SERVQUAL instrument consists of two sections: one for identifying the customer’s perceptions of the performance of the 22 attributes, and the other for identifying customer expectations of the same attributes. The questionnaire was developed through comprehensive empirical psychometric testing and trials, making it applicable across a broad range of service industries (Chen, Chang & Lai 2009; Parasuraman, Zeithaml & Berry 1988). Therefore, this model is generic and can be applied in the context of any service organization to measure service quality, by modifying its domain structure as to the specific characteristics of any particular service setting.
Different modified versions of the orthodox SERVQUAL model have been used by several scholars (Filiz 2007; Nimsomboon & Nagata 2003; Sahu 2007; Sinyenyeko-Sayo 2007; Tuomi 2001) to assess the service quality of university libraries. However, the studies did not entirely rely on the generic domain structure introduced by the original SERVQUAL model. For example, Filiz (2007) used five service quality - related domains, namely, quality of library services, quality of information and library environment, reliability, quality of online catalogue system and confidence applicable to academic libraries in his study. Sahu’s (2007) study reflects six domains of service quality, that is, reliability, responsiveness, assurance, access, communications and empathy. This has brought into question the reliability of the model.
The studies referred to above demonstrate that different domain structures specific to each study are identifiable. The domains are divergent from the five collapsed domains, which the designers of SERVQUAL model identified when applied in different contexts. It is evident that due to the changing domain structures from one research project to another, a universally accepted instrument is not available for the assessment of service quality in academic libraries.
Therefore SERVQUAL may not be the best model for measuring the customer satisfaction and service quality constructs in the library and information services. Moreover, current research trends in relation to customer satisfaction in the area of service marketing suggest that SERVQUAL has not been used to measure customer satisfaction to any great extent due to its primary concern with gauging service quality in a given scenario. In that context, it is pertinent to point out that though SERVQUAL is a generic model common to all kinds of organisations, it requires customisation for use within library settings. As a result, SERVPREF and LibQUAL have emerged to fill the deficiency gaps of the SERVQUAL model.
SERVPREF is merely a subset of SERVQUAL. The rationale behind the development of this instrument was that: (i) measuring customers expected service level, prior to the service delivery, is impossible; and
(ii) measurement of expected service level after service delivery may be inaccurate, as the customers’ expectations, by then, have already been biased by the service.
Using this rationale, Cronin and Taylor (1992) proposed an alternative instrument, which used 22 questions with respondents’ perception - only scores to measure service quality instead of SERVQUAL’s disconfirmation scores. The SERVPERF instrument is therefore identical to SERVQUAL, with the exception that SERVQUAL has 44 items (22 items for expectation of service quality and 22 items for performance of service quality), while SERVPERF has 22 items addressing only actual performance. A replicated study with the new dataset also showed the superiority of the performance-only approach as a measurement of service quality (Brady, Cronin & Brand 2002; Einasto 2009).
However, the SERVPREF model has not been extensively researched in the contextual settings of libraries. The attributes nevertheless covered by both models, that is, SERVQUAL and SERVPREF, are the same and seem appropriate for libraries. White, Abels and Nitecki (1994), state that both models are flexible, and they can be modified to suit special libraries. However, according to Hernon and Nitecki (2001), SERVPREF has rarely been used in libraries, and researchers prefer SERVQUAL, which has the facility for broad application to service industries.
LibQUAL is a suite of services that libraries use to solicit, track, understand and act upon customers' opinions of service quality (LibQUAL 2008). It has been rigorously tested through a Web - based survey combined with training to help libraries assess and improve their services, change their organisational culture, and market their services. The goals of LibQUAL are to:
• Foster a culture of excellence in providing library services;
• Help libraries better understand customer perceptions of library service quality; • Collect and interpret library customer feedback systematically over time; • Provide libraries with comparable assessment information from peer institutions; • Identify best library service practices; and
• Enhance library staff members' analytical skills for interpreting and acting on data (LibQUAL+ 2008).
The original LibQUAL presents 41 statements, accompanied by a three-column rating format consisting of minimum service expectations, desired service expectations, and the perception of service performance of the library reviewed. Heath, Cook and Thompson (2001) claim that LibQUAL attributes better reflect the service quality domains of research libraries than the original SERVQUAL set of factors and domains developed across service industries. After rigorous testing of the LibQUAL protocol over a three-year period, the survey was standardised to include the following key elements (LibQUAL+2008):
• Twenty-two core items spanning 3 domains: effect of service, information control and library as place;
• Eleven additional items covering information literacy outcomes, general satisfaction with library service and library usage trends;
• General demographic items; and
• A box for open-ended comments by customers.
A related case study by Walters (2003) highlights several advantages over earlier assessment instruments. Walters (2003) finds that:
• LibQUAL is designed to elicit responses from a random sample of both library customers and non-customers; • It accounts for respondents’ minimum and desired levels of performance, rather than relying solely on their perceptions
of current conditions;
• It provides multiple benchmarks for the comparison of institutions;
• It meets established criteria for reliability and uses questions derived from in-depth interviews with library patrons; and • It identifies the various facets of perceived quality and provides an overall rating for each.
This model is also common to all forms of libraries, and thus, it is a generic model, with limited flexibility for profound customisation to a specific kind of library, for instance, the library in a given culture because of its fixed domain structure. LibQUAL’s factor structure has been changed several times to form a new generic model, which was implemented in 2003. As the conceptual formation of this model is the same as SERVQUAL, the issues pertaining to the conceptual criticisms are also applicable to this model. The theoretical and methodological formation of these models have been criticised by a number of researchers and have not been resolved to date. It is evident that researchers should keep on experimenting until an appropriate model is established.
6 Critical analysis of existing service quality models
choice by which to measure psychological paradigms because there is little evidence of customers’ actual assessments of service quality, in terms of performance minus expectation scores (Kibourne et al., 2004, cited in Ladhari 2008).
Brady and Cronin (2001) also critique the P-E concept, suggesting that service quality should be a performance-based construct and more appropriately measured with perceptions, rather than expectations. They question the validity of the
P-E specification introduced in the disconfirmation paradigm (Cronin & Taylor 1992), suggesting that this concept is a potentially misleading indicator of service quality perceptions.
There is another conceptual argument, which is also based upon the P-E concept. Buttle (1996: 11) highlights the fact that Service Quality [(SQ) = Performance (P) –Expectations (E)] is based upon disconfirmation, rather than customer attitudes. The idea behind disconfirmation is that service quality depends not on the absolute level of performance experienced, but on performance compared to expected performance. Evaluations of service quality are based on the difference between the customer’s perception of what was expected and what was experienced. Thus, there has been an extensive debate that the performance minus expectation specification is possibly a flawed and incoherent measurement of the assessment of service quality against a given backdrop (Cronin & Taylor 1992).
The concept of expectation has also been criticised by some researchers, as there is no widely accepted notion regarding the definition of expectations. “Desires”, “wants”, “what a service provider should offer”, “the level of service that the customer hopes to receive”, “adequate service”, “normative expectations” and “ideal standards” are some of the explanatory words/phrases subsumed within definitions of expectations (Ladhari 2008). As these different definitions are open to multiple interpretations, it is necessary to delineate a universal definition for the term “expectations” in modelling and evaluating service quality and customer satisfaction. While the effect of expectations on service quality levels is debatable, it is nevertheless interesting to understand what affects expectations. Thompson and Kaminski (1993) point out the psychographic factors that may lead to different service expectations. According to Clow and Vorhies (1993), expectations are only slightly affected by the passage of time prior to service consumption. However, immediately after service consumption, non-neutral episodes produce an expectation shift. Customers therefore experience positive service consumption. Negative service consumption thus generally causes customers to overstate their prior expectations. This is indirectly supported by ongoing debates about the applicability of expectations for the constructs of service quality and customer satisfaction (Cronin & Taylor 1992; Schneider & White 2004).
There is no complete and universal notion about the best paradigm for predicting customer satisfaction and/or service quality. The disconfirmation paradigm has been challenged by some researchers (Brady, Cronin & Brand 2002; Cronin & Taylor 1992; Dabholkar, Shepherd & Thrope 2000), conveying the view that the performance - only score is an ideal
modus operandi for predicting service quality and customer satisfaction. However, following an empirical investigation, Bolton and Drew (1993) cited in Robinson (1999), claim that although performance has been substantiated as a greater determinant of service quality, the disconfirmation paradigm has confirmed improved predictability, compared to the performance-only paradigm.
Available service quality and customer satisfaction models have generally been criticised for the composition and number of domains they contain. SERVQUAL and SURVPREF models consist of pre-defined domain attributes that are generic to all service organisations, and LibQUAL is also generic to all kind of libraries. Babakus and Boller (1992) suggest that service quality may be complex in some industries, and unidimensional in others. Thus, the predefined domains and attributes are not universal and are likely to require contextualisation with respect to the measurements of attributes and the industry being studied (Buttle 1996; Schneider & White 2004: 38). Hence, a closer look at these models reveals that they underrepresent the construct of customer satisfaction in relation to service quality. In other words, the models do not have a framework required for the holistic understanding of customer satisfaction in relation to service quality in a given environment as expected. The existing models are static and generic in nature and have not been specifically developed for a particular environment, for example, university libraries in Sri Lanka, commercial banks in Singapore, or life insurance companies in South Africa.
Nevertheless, it is also important to note that the literature supports both the disconfirmation and the performance - only paradigms (Buttle 1996; Cronin & Taylor 1992; Oliver 1993). Researchers (Brady, Cronin & Brand 2002; Harris et al.
2006; Zhu, Sivakumar & Parasuraman 2004) emphasise that the value of service, the physical environment in which the service is delivered and other uncontrollable factors associated with the service encounter, such as emotions and behaviour, should also be included in the assessment of service quality aimed at customer satisfaction.
Using a single indicator to denote customer satisfaction has also been questioned in relation to its validity and the reliability (Davis & Heineke 1998). If a model exercises a single measure for complex constructs, the validity and reliability of the model are considered suspect. Since the SERVQUAL, LibQUAL and SERVPREF models utilise a single measure for assessing the construct of customer satisfaction, problems pertaining to validity and reliability may arise. Therefore, as customer satisfaction is a complex phenomenon, a multi - item approach should be used in a model that measures the construct to ensure its higher reliability and validity. In order to overcome the aforementioned problem, the formation of a composite attribute that consists of some attributes denoting the construct of satisfaction can be utilised to designate the customer satisfaction attribute. Apart from the conceptual deficiencies, contextual weaknesses that include operational and functional limitations can also be identified in these measurements.
All investigators work with predetermined scales when using measurement instruments. It has been demonstrated by several authors in the fields of psychology (Allport 1961),business (DeSarbo et al., 1994)and artificial intelligence (Cronin & Taylor 1992)that scales for the measurement of perceptions are not symmetrical, and the length of each interval within the scale may not be equal. This point indicates a drawback, similar to a conversion of a Likert scale into an ordinal scale.
SERVQUAL, SERVPREF and LibQUAL measures are static, in that they do not consider the history of the service, and they fail to capture the dynamics of the changing expectations. Parasuraman, Zeithaml and Berry (1994) point out that some respondents may not possess the necessary knowledge to respond to some of the SERVQUAL and SERVPREF items and therefore record a rating of ‘four’, (the mid-point of a seven-point scale), on the perception scale. The final gap score may then indicate something other than what it should mean. Moreover, Babakus and Mangold (1992) state that despite the absence of a “don’t know option” on SERVQUAL, non-responses on the perceptions aspect are quite common. Krosnick (2000) cited in Morrison (2004) points out that when mid-points are perceived as representing neutral responses, respondents may be induced to select them to enable the quick completion of the task–a ‘satisfying’ strategy, that is, one that is merely satisfactory or that suffices. The indicated response may not therefore truly reflect the respondents’ actual expectations or perceptions.
The other apparent drawback in SERVQUAL and SERVPREF models is also related to their measurement scales of constructs. Both models use a Likert scale to measure service quality attributes and domains, while a semantic differential scale is utilised to measure overall satisfaction. Different measurement scales may, however, lead to some empirical errors because of its measurement inconsistency. Furthermore, as the SERVQUAL scales have no verbal labels for scale points two to six, Nanayakkara (2008) suggests that if a scale does not have verbal labels, respondents may overuse the extreme end-points that have verbal labels. Verbal labelling of all the scale points provides the possibility of minimizing bias and accurately capturing the respondents’ intended response.
The application of the domains of the SERVQUAL model in the library sector, poses problems because of the use of different scores, applicability, dimensionality, and lack of validity and generalisability. Nitecki and Hernon (2000) cited in Hernon and Calvert (2005:382) allude to the shortcomings of the SERVQUAL instrument as:
… given the focus on instrument development, the investigators did not pursue external validity or the generalisability of findings to the customer or broader university community. Nor did they limit the study to those statements having local relevance. Rather, they developed an instrument consistent with ones discussed in the literature review.
Carman (1990:34) found a larger number of domains than those prescribed in the SERVQUAL instrument and highlighted the multi-faceted nature of some services. He further demonstrates that the SERVQUAL scale fails to elicit the importance of all five factors in some special cases of tyre stores, placement centres and dental clinics. In the library sector, Andaleeb and Simmands (1998) cited in Cook, Heath and Thompson (2001:148), point out that “various studies in the information service sector have also demonstrated that the domains introduced in SERVQUAL have not been confirmed.” Furthermore, they argue that additional factors need to be integrated to SERVQUAL to measure some other important domains on customers’ perspectives of library service quality. Hernon and Nitecki (2001:698) stress that:
… believing that SERVQUAL does not sufficiently address local expectations and priorities, Peter Hannon and his colleagues in the United States and New Zealand developed a generic set of expectations that individual libraries could use as a guide for deciding on those statements that they might treat as priorities.
was focused on the library or service location and did not attempt to determine the relevance of statements across institutions or over time (Hernon & Nitecki 2001).
In the past five years, LibQUAL has made major inroads as an instrument of choice in evaluating the quality of library services. Some writers have cautioned against over-enthusiasm about LibQUAL (Yu et al., 2008). Shi and Levy (2005) examined a number of conceptual deficiencies of LibQUAL and Edgar (2006) questioned its fundamental assumption and research approach pertaining to user experiences. In LibQUAL, the score with the highest correlations to eight validity in-dicators should be regarded as the superiority gap score, but Roszkowski, Baky and Jones (2005:424) found that the per-ceived “score is a better predictor of satisfaction than the superiority gap score”.
Although LibQUAL is currently the most popular and widely used assessment tool in different libraries, its theories and applications in library assessment processes warrant further analysis. As previously noted, LibQUAL was introduced into the library sector as an expansion of the SERVQUAL model. Accordingly, the customers’ perceived quality of library services in LibQUAL is the customers’ judgment about their overall experiences with the services. The perceptions about the quality of service are based on the degree and direction of discrepancy between the customer’s perceptions and expectations. The underlying theory of SERVQUAL and LibQUAL appears to be the same, even though there are some modifications in its domain structure. Therefore, it is apparent that the same theoretical and methodological inconsistencies and issues identified in the literature may apply to both instruments. Yu et al., (2008:547) stress that:
[w]hile the original SERVQUAL applies only one comparison norm (E), the 1991 version of SERVQUAL and LibQUAL both apply two different norms for assessment: desired service (the level of service a customer believes can and should be delivered) and adequate service (the level of service the customer considers acceptable). The changes that LibQUAL made over SERVQUAL do not make it fundamentally (especially epistemologically) different from, nor immune to the limitations of SERVQUAL.
From the point of view of a decision making process, results based on SERVQUAL, LibQUAL and SERVPREF instruments do not show an adequate linkage between customer satisfaction and managerial decision – making because the output cannot be easily translated into implementable measures. In fact, there is no suggestion on how management can use these instruments as a strategic lever to better decide what needs to be changed, how to connect these measures to changes and goals achieved, and how customer expectations are may be updated as customers’ perceptions change over time.
Saunders (2007:24) also highlights the practical problems of using LibQUAL in the following manner:
[t]here is also tension between the need for local information and the standardized information provided by the survey. Many libraries would like to tailor the questionnaire to find out information that is specific to their library clientele or specific local problems. This is difficult to do without making the survey too long or removing some of the standardized questions.
Based on the conceptual, practical and methodological evaluations of various instruments, it may be concluded that there is no universally accepted notion of the optimal instrument to conceptualise customer satisfaction in relation to service quality. Thus, investigating and recommending other models that may predict customer satisfaction regarding services provided by university libraries is a worthwhile venture. That will ensure that measuring service quality in libraries would be based on a holistic model, which does not draw on a specific theory and/or technique but which incorporate theories and techniques from a number of assessment approaches as Kyrillidou (2002) and Nicholson (2004) pointed out.
7 Methods
Focus groups and the survey research method were used in this study because the intention of this research was to gather data regarding customer attitudes about service quality and customer satisfaction of university libraries. The foundation for the collection of data was laid by a literature survey. The literature survey analysed the existing theories, frameworks and research findings to identify the pertinent quality attributes used in past research studies in the field of service marketing in library and information services. One hundred and thirteen quality attributes were identified from the literature. The identified attributes were then discussed at focus group meetings to select attributes appropriate to the context of the university libraries in Sri Lanka. Subsequently, a questionnaire was designed, based upon the attributes identified by the focus groups, to gather data for refining the attributes and to identify pertinent quality domains to build up a theoretical model for predicting customer satisfaction. The attributes used in the survey were further refined using the Delphi technique (DT) after receipt and analysis of the responses.
Faculties of Arts at each of the selected universities. Postgraduate and undergraduate students and permanent academic staff members were used as the target population for the study. As experience is an influential factor in assessing the quality of services, only students in second, third and final year students were selected for the sample. Academic members of staff with a minimum of one year working experience at the selected universities were included in the sample. Non-academic staff members were excluded due to their low library usage (University of Colombo 2003).
Four focus groups were established from the four selected universities, that is, one focus group per university. On the question of selecting participants for a group, the authors purposively selected 10 users at each site as recommended in the literature (Asquith 1997; Morgan 1996; Mosia and Ngulube 2005). The 10 participants that were chosen consisted of six undergraduate students, two postgraduate students and two academic staff members from the Faculties of Arts in each of the universities. Approximately two-hour discussions were held for each focus group in September 2008. The main purpose of these discussions was to obtain a clear view of the most relevant quality attributes that may have an impact on customer satisfaction in the context of Sri Lankan university libraries.
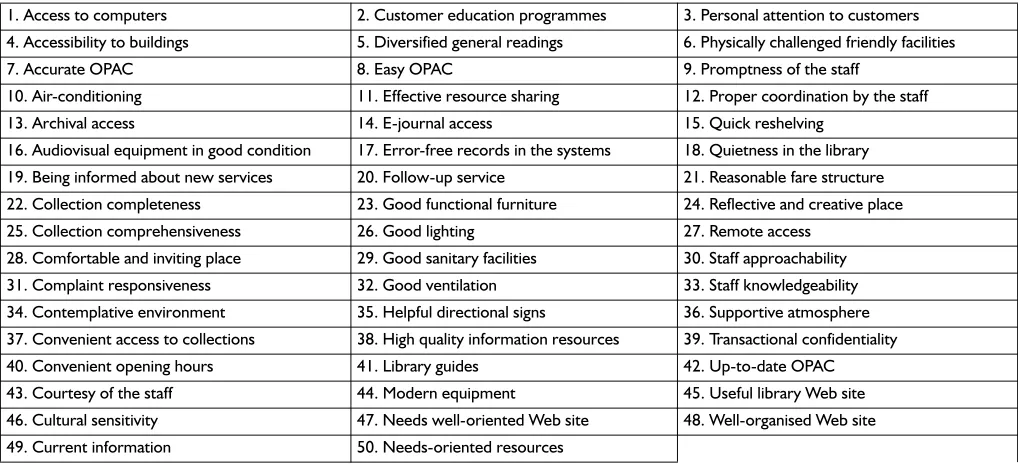
The researchers analysed the tape-recorded discussions and highlighted the key words and concepts that were directly related to the quality of library services. Accordingly, from the quality statements gathered from focus group discussions, a list of 50 attributes was developed as indicated in Table 1.
Table 1 Quality attributes identified by focus groups
1. Access to computers 2. Customer education programmes 3. Personal attention to customers 4. Accessibility to buildings 5. Diversified general readings 6. Physically challenged friendly facilities 7. Accurate OPAC 8. Easy OPAC 9. Promptness of the staff
10. Air-conditioning 11. Effective resource sharing 12. Proper coordination by the staff 13. Archival access 14. E-journal access 15. Quick reshelving
16. Audiovisual equipment in good condition 17. Error-free records in the systems 18. Quietness in the library 19. Being informed about new services 20. Follow-up service 21. Reasonable fare structure 22. Collection completeness 23. Good functional furniture 24. Reflective and creative place 25. Collection comprehensiveness 26. Good lighting 27. Remote access
28. Comfortable and inviting place 29. Good sanitary facilities 30. Staff approachability 31. Complaint responsiveness 32. Good ventilation 33. Staff knowledgeability 34. Contemplative environment 35. Helpful directional signs 36. Supportive atmosphere 37. Convenient access to collections 38. High quality information resources 39. Transactional confidentiality 40. Convenient opening hours 41. Library guides 42. Up-to-date OPAC 43. Courtesy of the staff 44. Modern equipment 45. Useful library Web site 46. Cultural sensitivity 47. Needs well-oriented Web site 48. Well-organised Web site 49. Current information 50. Needs-oriented resources
The focus groups further recognised the linkage between customer satisfaction and service quality and recommended that libraries should identify specific quality attributes to promote customer satisfaction. The focus group discussions were followed by an exploratory survey to refine the 50 quality attributes established by the focus groups and to identify the quality domains to employ in developing the theoretical model for predicting customer satisfaction.
7.1 Exploratory survey: testing the quality attributes identified by the qualitative study
A structured questionnaire based upon multidimensional scaling, which is a combination of Likert, numerical and categorical scales (Cooper & Schindler 2006), was used. The questionnaire was pre-tested by a panel of experts, who further refined the identified quality attributes. The instrument was distributed to a proportional stratified sample of academic staff members, undergraduate and postgraduate students in the Faculties of Arts at all four selected universities. The method of “five subjects for one attribute” was used for the determination of sample size (Hair, Anderson & Black 1995 cited in Okoroafo 1997). The method of five subjects for one attribute denotes that the sample size should be five times as large as the number of total attributes identified. Thus, 250 customers were selected based on the 50 attributes in Table 1. Nevertheless, to minimize the problem of non-responses, a 5% additional contingency rate was added to the total sample. Thus, the number of customers in the sample became 263.
five-point Likert scale, values 3 and above symbolise “important” and below 3 symbolise the “unimportant”. As a result, ten attributes were suppressed because they were considered unimportant by the customers based on the Likert scale. Thus, the total attributes used were 40. The response was considered to be sufficient when compared to the rule of “five subjects for one attribute” (Hair et al., 1995 cited in Okoroafo 1997). Having 242 respondents exceeded the requirement of 200 for 40 attributes and that made it possible to conduct the factor analysis technique.
7.2 Exploratory Factor Analysis (EFA)
In order to determine the appropriateness of factor analysis with the data, the Kaiser-Meyer-Olkin (KMO) test of 0.6 (see Kaiser 1994) was used as the cut-off point. The cut-off point for factor loading is arbitrary, and its magnitude also varies from research to research. Thus, this study used 0.5 as the standard cut-off point.
By applying the Principal Component Analysis (PCA) and Varimax rotation to the refined 40 attributes, the SPSS program produced 11 factors with Eigenvalues greater than 1.0 and KMO statistics of 0.7. The eleven-factor solution explained 67.2% of variance, which is deemed to be a satisfactory solution by social science standards (Hair et al., 1998). However, the efficacy of the solution was highly questionable. Some factors loaded less than 0.5 and offered no explanatory value. More importantly, the entire factor solution that was produced was meaningless. Specifically, the generated factors consisted of a mixed array of attributes. For instance, factor one was composed of courtesy of staff, personal attention, information about new services, good sanitary facilities and audio visual equipment in good condition, which were difficult to label as a domain. Thus, it was apparent that all factors caused attributes to be loaded together, which did not make sense conceptually, and some factors produced only one or two attributes. Under these circumstances, the factor structure produced cannot be used as domains in the main study due to its illogical and irrational constitution.
To overcome the origination of a meaningless factor solution, the Delphi technique (DT) was used to group the attributes into conceptually logical factors (Dalkey 1969). A panel of experts was used for this purpose. This process does not guarantee a content valid scale, but it serves as a basic exploratory tool to acquire and summarise the most conformed and conformable opinions of experts (Hsieh, Chin & Wu 2006:216). These conceptual factors were then tested to ensure that conceptually constructed factors represent the statistically developed factors. This approach has been recommended by Rosen and Surprenant (1998) as a means of identifying actual rather than a perceived factor grouping.
7.3 Attribute grouping by customers
A separate grouping method was then employed to categorise the quality attributes into conceptual domains on customers’ perspectives. The customers (n=32) who invited for the focus group discussions were required to match attributes with quality domains defined by the panel of experts to determine whether the quality attributes and pertinent domains could be correctly understood by the customers. The purpose of the Delphi technique was therefore to determine the conceptual unambiguousness and simplicity of the attributes generated by focus groups in order to include them in the new model. This method provided support for construct validity because it allowed the customers to remove the attributes that were conceptually inconsistent, irrelevant and particularly low on face validity. As a starting point in analysing the responses, attributes were screened based on the agreement index of p=0.66. The results presented an agreement index of 0.90 (90%). According to Johnson and Gustafsson (2000), the prescribed agreement index is 80%, which is the most effective cut-off level to determine whether content analysis is reliable.
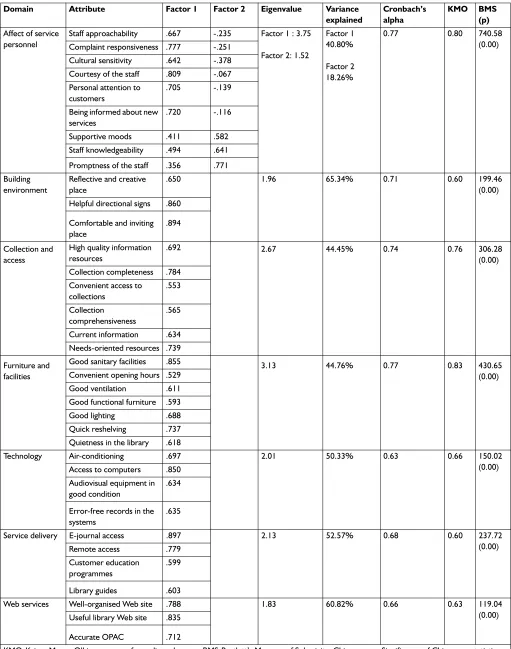
These conceptually identified domains were further tested by the factor analysis technique to determine whether or not these conceptual domains were statistically correct. Accordingly, seven domains, that is, affect of service personnel, building environment, collection and access, furniture and facilities, technology, service delivery and Web services were statistically tested to confirm them as potential domains of service quality.
Table 2 Exploratory factor analysis for quality domains
Domain Attribute Factor 1 Factor 2 Eigenvalue Variance
explained
Cronbach’s alpha
KMO BMS
(p)
Affect of service personnel
Staff approachability .667 -.235 Factor 1 : 3.75
Factor 2: 1.52
Factor 1 40.80%
Factor 2 18.26%
0.77 0.80 740.58 (0.00) Complaint responsiveness .777 -.251
Cultural sensitivity .642 -.378 Courtesy of the staff .809 -.067 Personal attention to
customers
.705 -.139
Being informed about new services
.720 -.116
Supportive moods .411 .582 Staff knowledgeability .494 .641 Promptness of the staff .356 .771 Building
environment
Reflective and creative place
.650 1.96 65.34% 0.71 0.60 199.46
(0.00) Helpful directional signs .860
Comfortable and inviting place
.894
Collection and access
High quality information resources
.692 2.67 44.45% 0.74 0.76 306.28
(0.00) Collection completeness .784
Convenient access to collections
.553
Collection comprehensiveness
.565
Current information .634 Needs-oriented resources .739
Furniture and facilities
Good sanitary facilities .855 3.13 44.76% 0.77 0.83 430.65 (0.00) Convenient opening hours .529
Good ventilation .611 Good functional furniture .593 Good lighting .688 Quick reshelving .737 Quietness in the library .618
Technology Air-conditioning .697 2.01 50.33% 0.63 0.66 150.02 (0.00) Access to computers .850
Audiovisual equipment in good condition
.634
Error-free records in the systems
.635
Service delivery E-journal access .897 2.13 52.57% 0.68 0.60 237.72 (0.00) Remote access .779
Customer education programmes
.599
Library guides .603
Web services Well-organised Web site .788 1.83 60.82% 0.66 0.63 119.04 (0.00) Useful library Web site .835
Accurate OPAC .712
KMO-Kaiser-Meyer-Olkin measure of sampling adequacy, BMS-Bartlett’s Measure of Sphericity: Chi square, p-Significance of Chi square statistics Key:
Only factor loading 0.5 are highlighted
8 Results and discussion
The principal purpose of factor analysis was to reach “a more parsimonious conceptual understanding of a set of measured attributes by determining the number and nature of common factors needed to account for the pattern of correlations among the measured variables” and “to identify a set of latent constructs underlying a battery of measured variables” (Fabrigar et al., 1999:274-275). Thus, factor analysis was used in this study to statistically confirm the domain structure of service quality that was conceptually identified by the customers as a result of Delphi technique.
KMO measure of sampling adequacy was computed to quantify the degree of inter-correlations among the attributes. This test measures sampling adequacy by comparing the magnitude of the calculated correlation coefficients to the magnitude of the partial correlation coefficients. The KMO ranges from 0 to 1. The KMO values for this study were more than 0.6, which indicates that the data were adequate for EFA (Tabachnick & Fidel 2001). BMS was used to assess the ad-equacy of the sample size and the quality of the correlation matrix. BMS should be significant in order to proceed with factor analysis. The BMS results were significant in all domains as specified in Table 2. All factors whose eigenvalue was greater than one were retained in the factor solution. If a factor has a low eigenvalue, then its contribution to the explanation of variances in the attributes is limited. A higher value which is greater than one indicates a higher number of the best possible attributes in the relevant factor. In that light, Table 2 demonstrates that building environment, technology, service delivery and Web services explain better formation of domains with pertinent attributes compared to the other factors. The reliability of the domains in the model was assessed by the Cronbach’s alpha reliability scores of 0.63 and above as indicated in Table 2. That means that the domains used for the model are reliable. Higher Cronbach’s alpha values indicate greater reliability.
The domain named “affect of service personal” identified by the respondents was transformed into two new domains because it loaded onto two factors as depicted in Table 2. The results suggested that the customers are likely to see higher responsiveness from the library personnel, while they receive support at their end. Accordingly, two factors, that is, responsiveness and supportiveness emerged from EFA. It is apparent that the domain structure, except the “affect of service”, identified by the customers and experts was statistically confirmed by EFA. It is evident that the adjusted domains for the construct of service quality are responsiveness, supportiveness, building environment, collection and access, furniture and facilities, technology, service delivery and Web services.
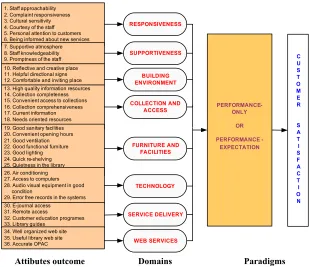
The results of the review of the literature and the factor analysis provided a justification for the theoretical model that depicts the domains that are likely to influence customer satisfaction. This theoretical model is the basis for generating the research hypotheses to be empirically tested by another study. The eight domains identified in Table 2 are depicted in the theoretical model in Figure 1. This shows the results of the factor analysis in terms of domain name and the attributes loaded onto each domain.
1. Staff approachability 2. Complaint responsiveness 3. Cultural sensitivity 4. Courtesy of the staff 5. Personal attention to customers 6. Being informed about new services 7. Supportive atmosphere 8. Staff knowledgeability 9. Promptness of the staff 10. Reflective and creative place 11. Helpful directional signs 12. Comfortable and inviting place 13. High quality information resources 14. Collection completeness 15. Convenient access to collections 16. Collection comprehensiveness 17. Current information 18. Needs oriented resources 19. Good sanitary facilities 20. Convenient opening hours 21. Good ventilation 22. Good functional furniture 23. Good lighting 24. Quick re-shelving 25. Quietness in the library 26. Air conditioning 27. Access to computers 28. Audio visual equipment in good condition
29. Error free records in the systems 30. E-journal access
31. Remote access
32. Customer education programes 33. Library guides
34. Well organized web site 35. Useful library web site 36. Accurate OPAC
SUPPORTIVENESS RESPONSIVENESS BUILDING ENVIRONMENT COLLECTION AND ACCESS FURNITURE AND FACILITIES TECHNOLOGY SERVICE DELIVERY WEB SERVICES PERFORMANCE-ONLY OR PERFORMANCE -EXPECTATION C U S T O M E R S A T I S F A C T I O N
Figure 1 A theoretical model to predict customer satisfaction
As a result of a literature review of service quality and customer satisfaction and the factor analysis conducted to identify the relevant domains, this theoretical model was developed (Cook, Heath & Thompson 2001; Tuomi 2001; Moon 2006; Filiz 2007; Calvert & Hernon 1997; Harwood & Bydder (1998). The re-conceptualisation depicted in Figure 1 contains eight domains and as stated previously, the literature does not address all these eight components in one model. This theoretical model presumes hypotheses that need to be empirically tested to establish the most parsimony model that can be used to predict customer satisfaction.
Based upon the literature, which suggests that service quality is a function of customer satisfaction, H1 and H2were derived.
H1: Customer satisfaction is related to the performance scores for the eight quality domains
H2: Customer satisfaction is related to the gap scores (performance-expectation) for the eight quality domains After testing the hypotheses, some domains may be discarded due to some statistical non-significance. Therefore, it is difficult to confirm the domain structure and to compare this theoretical model with the other empirically tested and validated models such as SERVQUAL, SERVPREF and LibQUAL. However, it is important to note that the eight factors in this model do not conform to the structures of LibQUAL, SURVPREF and SERVQUAL. Likewise, many studies in a variety of libraries in different cultures have failed to substantiate the domains established by these models (Karatepe, Ya-vas & Babakus 2006; Payne-Palacio & Theis 2005; Raajpoot 2004). On the other hand, some attributes are unique to the Sri Lanka, for example, supportive atmosphere, quick re-shelving of library materials, comprehensiveness of the collection, access to archives, a place for reflection and creativity and lighting, and they cannot be found in LibQUAL. Though there are some similarities of naming the domains with the domains of LibQUAL, the underling attributes of these domains are entirely different from LibQUAL. Thus, it is important to emphasise that the domains defined by this theoretical model do not conform to the three domain structure of the LibQUAL and five domain structures of the SERVQUAL and SURVPREF models. Thus, the uniqueness of this model is evident in the following features:
1. The model presents a holistic structure of the inherent dynamism of the customer satisfaction concept in relation to service quality in university libraries in Sri Lanka.
2. It integrates prevailing literature in the area of library and information sciences and service marketing into the aspects of quality attributes, and incorporates facet of the complexity of the constructs.
According to Schembri and Sandberg (2002) dominant service quality instruments have failed to capture the real customer perspectives of service quality. There is a need to shift away from the traditional measurement of service quality and to look at service quality in a different light. Thus the phenomenological approach used in this study enabled the authors to investigate variations of service quality and customer satisfaction as experienced by different library customers. The end results of this research design translated into a frame of an alternative library service quality specific to Sri Lankan universities.
This study should be beneficial to library administrators to understand the expectations of their customers on the services rendered by their libraries. Though there are very few empirical studies based on a variety of methods, models and techniques on quality in the field of university libraries, the available data proved to be significant and interesting from the standpoint of academic libraries. In surveying the literature, it was noted that the majority of the research in the field of service quality in university libraries have utilised LibQUAL instrument rather than exploring the other avenues to ascertain alternative means of gauging customer satisfaction.
From a methodological perspective, most researchers have used EFA with Varimax factor rotation to reduce the attributes and to identify the domains. However, in this study, EFA demonstrated a significant shortcoming, which was the distorted factor loading, as demonstrated in some other research studies (Segars & Grover 1993). DT and EFA were helpful to identify statistically significant factors, when the PCA generated extraneous factor solutions. Hence, the distinctiveness of the factors can be affected by these meaningless factor solutions, and the researcher might lack any sound evidence or theoretical explanation on which to base an interpretation (Sureshchndar, Rajendran & Anantharaman 2002). The way we dealt with data analysis shows the methodological novelty of this study.
10 Conclusions and recommendations
This research focused on the quality drivers of the construct of customer satisfaction, based on a cross-sectional analysis at a single point in time. Most of the library customers had very high expectations from the quality of service of their libraries. Furthermore, based upon the expectations of the customers, this model provides a frame of reference for university libraries to assess their performance against the eight quality domains and thirty six related attributes concerned with customer satisfaction. Therefore, these quality domains and attributes must be considered by service providers and policymakers in university libraries in order to harness the process of enhancing customer satisfaction. The model may be used to predict customer satisfaction employing the performance-only or disconfirmation paradigm as depicted in Figure 1. In the long run, library administrators should periodically examine how these domains perform in the context of the needs of library users.
Acknowledgements
This article is based on a doctoral study at the University of South Africa. Any correspondence may be directed to the first author at [email protected] OR [email protected].
References
Allport, G. 1961. Pattern and growth in personality. New York: Holt, Rinehart & Winston.
Asquith, J.A.L. 1997. The effects of group size on the outcome of focus group sessions. Management Research News, 20(12):1-15.
Azar, O.H. 2007. Incentives and service quality in the restaurant industry: the tipping-service puzzle. MPRA. [Online]. http:// mpra.ub.uni-muenchen.de/4457/1/MPRA_paper_4457.pdf. (Accessed 10 February 2008).
Babakus, E. & Boller, G.W. 1992. An empirical assessment of the SERVQUAL scale. Journal of Business Research, 24(3):253-268. Babakus, E. & Mangold, W.G. 1992. Adapting the SERVQUAL scale to hospital services: an empirical investigation. Health
Ser-vices Research, 26(6):767–786.
Badri, M.A., Abdulla, M & Al-Madani, A. 2005. Information technology center service quality assessment and application of SERVQUAL. International Journal of Quality and Reliability Management, 22(8):819-848.
Brady, M.K. & Cronin, J.J. 2001. Some new thoughts on conceptualizing perceived service quality: a hierarchical approach. Journal of Marketing, 65(3):34-49.
Brady, M.K., Cronin, J.J. & Brand, R.R. 2002. Performance-only measurement of service quality: a replication and extension. Journal of Business Research, 55(1):17-31.
Broady - Preston, J. & Preston, H. 1999. Demonstrating quality in academic libraries. New Library World, 100(3):124-129. Buttle, F. 1996. SERVQUAL: review, critique, research agenda. European Journal of Marketing, 30(1):8-32.
Cadotte, E.R., Woodruff, R.B. & Jenkins, R.L. 1987. Expectations and norms in models of consumer satisfaction. Journal of Marketing Research, 24(3):305-314.
Calvert, P.J. & Hernon, P. 1997. Surveying service quality within university libraries. Journal of Academic Librarianship, 23:408-415. Carman, J.M. 1990. Consumer perceptions of service quality: an assessment of SERVQUAL dimensions. Journal of Retailing,
66(1):33-56.
Chandrashekaran, M., Rotte, K., Tax, S.S. & Grewal, R. 2007. Satisfaction strength and customer loyalty. Journal of Marketing Research, 44(1):153-63.
Chea, S. & Luo, M.M. 2006. E-service customer retention: the roles of negative affectivity and perceived switching costs. Journal of Information Science and Technology, [Online]. http://www.sophea.info/portal/
LinkClick.aspx?fileticket=Q1RTJtowI4c%3D&tabid=54&mid=377. (Accessed 24 November 2009).
Chen, K., Chang, C. & Lai, C. 2009. Service quality gaps of business customers in the shipping industry. Transport Research, 45:222-237.
Chowdhray, N. & Prakash, M. 2007. Prioritizing service quality dimensions. Managing Service Quality, 17(5):493-509.
Churchill, G.A. & Surprenant, C. 1982. An investigation into the determinants of customer satisfaction. Journal of Marketing Research, 19(4):491-504.
Clow, K.E. & Vorhies, D.W. 1993. Building a competitive advantage for service firms: measurement of consumer expectations of service quality. Journal of Services Marketing, 7(1):22-32.
Cook, C., Heath, F.M. & Thompson, B. 2001. Users’ hierarchical perspectives on library service quality: a ‘‘LibQUAL+’’ study. College and Research Libraries, 62:147-153.
Cooper, D.R. & Schindler, P.S. 2006. Business research methods. 9th ed. Singapore: McGraw Hill.
Cronin, J.J., Brady, M.K. & Hult, T.M. 2000. Assessing the effects of service quality, value and customer satisfaction on consumer behavioural intensions in service environments. Journal of Retailing, 76(2):193-218.
Cronin, J.J. & Taylor, S.A. 1992. Measuring service quality: a re-examination and extension. Journal of Marketing, 56(3):55-68. Dabholkar, P.A. 1996. Consumer evaluation of new technology-based self-service operations: an investigation of alternative
models. International Journal of Research in Marketing, 13(1):29-41.
Dabholkar, P.A., Shepherd, C.D. & Thorpe, D.I. 2000. A comprehensive framework for service quality: an investigation of critical conceptual and measurement issues through a longitudinal study. Journal of Retailing, 76(2):139-173.
Dalkey, D.N. 1969. An experimental study on group opinion: the delphi method. Futures, 69: 408-426.
Dambavinna, K. 2005. Delinquent readers: a study of the problems of mutilation, theft and non return of library materials in university libraries in Sri Lanka. MLS thesis. University of Colombo, Colombo.
DeSarbo, W.S., Huff, L., Rolandelli, M.M. & Jungwhan, C. 1994. On the measurement of perceived service quality: a conjoint analysis approach. In: Rust, R.T. & Oliver, R.L. (eds). Service quality: new directions in theory and practice. Thousand Oaks: Sage, pp. 201-22.
Edgar, W.B. 2006. Questioning LibQUAL+TM: expanding its assessment of academic library effectiveness. Portal: Libraries and the Academy, 6(4):445–465.
Einasto, O. 2009. Using service quality monitoring to support library management decisions: a case study from Estonia. International Information & Library Review, 41:12-20.
Enquist, B., Edvardsson, B. & Sebhatu, SP. 2007. Values-based service quality for sustainable business. Managing Service Quality, 17(4):385-403.
Fabrigar, L.R., Wegener, D.T., MacCallum, R.C. & Strahan, E.J. 1999. Evaluating the use of factor analysis in psychological re-search. Psychological Methods, 4:272-299.
Filiz, Z. 2007. Service quality of university library: a survey amongst students at Osmangazi University and Anadolu. [Online]. http://eidergisi.istanbul.edu.tr/sayi5/iueis5m1.pdf. (Accessed 23 March 2008).
Ghobadian, A., Speller, S. & Jones, M. 1994. Service quality: concepts and models. International Journal of Quality and Reliability Management, 11(9):43-66.
Hair, J.F., Anderson, R.E., Tatham, R.L. & Black, W.C. 1998. Multivariate data analysis 5thed. Englewood Cliffs: Prentice-Hall. Hamer, L.O. 2006. A confirmation perspectives on perceived service quality. Journal of Service Marketing, 20(4):219-232.
Harris, K.E., Grewal, D., Bernhardt, K.L. & Mohr, L.A. 2006. Consumer responses to service recovery strategies: the moderating role of online versus offline environment. Journal of Business Research, 59(4):425-431.
Harwood, N. & Bydder J. 1998. Student expectations of, and satisfaction with, the university library. Journal of Academic Librarianship, 24(2):161-171.
Hattie, J. 1984. An empirical study of various indices for determining unidimensionality. Multivariate Behavioural Research, 19(1):49-78.
Hernon, P. & Calvert, P.J. 2005. E-service quality in libraries: exploring its features and dimensions. Library & Information Science Research, 27:377-404.
Hernon, P. & Nitecki, D.A. 2001. Service quality: a concept not fully explored. Library Trends, 49(4):687-708.
Hofman, P. & Worsfold, E. 1996. Specification for resource description methods Part 2: selection criteria for quality controlled information gateways, Work Package 3 of Telemetrics for Research project DESIRE (RE 1004). [Online]. http:// www.ukoln.ac.uk/metadata/desire/quality/quality.pdf (Accessed 12 March 2008).
Hsieh, L.F., Chin, J.B. & Wu, M.C. 2006. Performance evaluation for university electronic libraries in Taiwan. The Electronic Library, 24(2):212–224.
Iacobucci, D., Ostrom, A. & Grayson, K. 1995. Distinguishing service quality and customer satisfaction: the voice of the customer. Journal of Consumer Psychology, 4(3):277-303.
Johnson, M.D. & Gustafsson, A. 2000. Improving customer satisfaction, loyalty and profit. an integrated measurement and management system. San Francisco: Jossey-Bass.
Juran, J.M. 1999. How to think about quality. In: Juran, J.M. & Godfrey, A.B. (eds). Juran’s quality handbook. 5th ed. New York, NY: McGraw-Hill, pp. 21-23.
Kaiser, H.F. 1994. An index of factorial simplicity. Psychometrica, 39:31-36.
Karatepe, O.M., Yavas, U. & Babakus, E. 2005. Measuring service quality of banks: scale development and validation. Journal of Retailing and Consumer Services, 12(5):373-383.
Khalifa, M. & Liu, V. 2002. Satisfaction with Internet-based services: the role of expectations and desires. International Journal of Electronic Commerce, 7(2):31-50.
Kyrillidou, M. 2002. From input and output measures to quality and outcome measures, or, from the user in the life of the library to the library in the life of the user. Journal of Academic Librarianship, 28(1):42-46.
Ladhari, R. 2008. Alternative measures of service quality: a review. Managing Service Quality, 18(1):65-86.
Lee, H., Lee, Y. & Yoo, D. 2000. The determinants of perceived service quality and its relationship with satisfaction. Journal of Services Marketing, 14(3):217-231.
LibQUAL+. 2008. Defining and promoting library service quality. [Online] http://www.libqual.org/. (Accessed 18 January 2008). Moon, A.E. 2006. LibQUAL+™ at Rhodes University library: an overview of the first South African implementation. In Quality
assurance in higher education. Available: http://eprints.ru.ac.za/234/01/Paper_A-Moon-v5.pdf(Accessed on 03 March, 2008). Morgan, D.L. 1996. Focus groups. Annual Review of Sociology, 22:129-156.
Morrison, L. 2004. Measuring service quality: a review and critique of research using SERVQUAL. International Journal of Market Research, 46(4):479-497.
Mosia, L.N. & Ngulube, P. 2005. Managing the collective intelligence of local communities for the sustainable utilisation of estuaries in the Eastern Cape, South Africa. South African Journal of Library and Information Science, 71(2):175-186.
Nanayakkara, L. 2008. A comparative study on marketing of reader services in academic libraries in Asia: with special reference to India, Malaysia, Thailand and Sri Lanka. MLS thesis. University of Colombo, Colombo.
Nicholson, S. 2004. A conceptual framework for the holistic measurement and cumulative evaluation of library services. Journal of Documentation, 60(2):164-182.
Nimsomboon, N. & Nagata, H. 2003. Assessment of library service quality at Thammasat University. [Online]. http:// www.kc.tsukuba.ac.jp/div-comm/pdf/report0403.pdf. (Accessed 23 February 2008).
Okoroafo, S.C. 1997. Strategic and performance issues associated with mode of entry substitution patterns. International Marketing Review, 14(1):20-38.