Lincoln
University
Digital
Thesis
Copyright
Statement
The digital copy of this thesis is protected by the Copyright Act 1994 (New Zealand).
This thesis may be consulted by you, provided you comply with the provisions of the Act
and the following conditions of use:
you will use the copy only for the purposes of research or private study
you will recognise the author's right to be identified as the author of the thesis and
due acknowledgement will be made to the author where appropriate
you will obtain the author's permission before publishing any material from the
thesis.
THEIR APPLICATION
A thesis
submitted in partial fulfilment
of the requirements for the Degree of
Doctor of Philosophy
at
Lincoln University
NEW ZEALAND
by
J. M. Ataria
Lincoln University
Abstract of a thesis submitted in partial fulfilment of the
requirements for the Degree of Doctor of Philosophy
The development of biological effect based tests in eels and mice and their application
by J.M. Ataria
Abstract
Risk assessment methodologies that can distinguish between adverse and acceptable chemical induced biological effects will provide powerful tools for environmental agencies to use in conjunction with standardised technologies to manage chemical contamination effectively. To advance this technology in New Zealand, the following research describes a step-wise approach to develop and establish a suite of biological effect tests in the indigenous shortfinned eel (Anguilla australis) and the laboratory mouse (C57BU6 strain).
Mice were exposed to polyaromatic hydrocarbons (PAHs) directly (via intraperitoneal [ip.] injection to benzo[a]pyrene [B[a]P or benz(a)anthracene [BA]), or indirectly (via clean soil spiked with B[a]P or BA and to soil from contaminated sites). Mice treated with multiple ip. doses of B[a]P (1 OOmg/kg) had significantly increased liver microsomal ethoxyresorufin O-deethylase (EROD) activity and cytochrome P450 concentration (P450 content), and hepatic-somatic index (HSI) compared to control. In contrast, EROD activity following ip. exposure to BA (1 OOmg/kg) was 1 0-15-fold less than for B[a]P, suggesting a higher affinity of B[a]P to the Ah receptor.
were similar.
Eels were exposed to one of a range of compounds (B[a]P, Aroclor 1254, 17~-estradiol [E2], 4-nonylphenol [4-NP], or chlorpyrifos [CP]) via ip. injection, or caged at sites that were potentially contaminated. Liver microsomal EROD activity of eels treated with multiple doses of B[a]P (1 and 1 Omg/kg) and Aroclor 1254 (10 and 1 OOmg/kg) was significantly increased compared to the controls. Total P450 levels followed similar trends to EROD activity, but were not statistically significant. The induction of eel plasma vitellogenin (Vtg) following multiple ip. doses of E2 (1 OOmg/kg) was marked in ip. experiment 1. However, a reduction in Vtg induction following an identical E2 exposure in ip. experiment 2 suggests that other cues such as seasonal changes, and or, sexually immature dimorphism may be involved. A small increase in plasma Vtg concentration was measured following exposure to 4-NP but this was not significant. Plasma acetylcholinesterase (AChE) activity of eel was slightly inhibited following ip. exposure to CP, but brain AChE was not affected by this or any other test compound. Similarly liver glutathione S-transferase (GST) did not respond to any
treatments.
Eels caged at a potentially impacted site on the Heathcote river showed significantly greater levels of EROD activity compared to an upstream site on the Heathcote river. While trends in the other biomarker responses were apparent in the eels caged at the potentially impacted Heathcote site, none were significant. Similarly, no significant differences between other potentially impacted and pristine sites were observed for any of the other biomarkers tested.
The sensitivity of EROD activity to a range of compounds when exposed in the laboratory and field was demonstrated in both animal models. While mixed responses were observed for the other biomarkers, it is clear that further research is required to determine their suitability as a monitoring tool in these two test species.
Ethical Statement
The New Zealand Animal Welfare Act (1999) requires a researcher to gain authorisation from an
approved Animal Ethics Committee (AEC) to conduct any animal experiment where:
• "A vertebrate animal is kept in a state of captivity or is dependent on human intervention for its care and sustenance."
• "Any manipulation of the animal that involves interfering with its normal physiological, behavioral, or anatomical integrity by deliberately exposing it to any parasite, micro-organism, drug, chemical, biological product, radiation, or electrical stimulation."
Comprehensive AEC applications for all animal research described in this thesis were submitted to the Landcare Research AEC for approval. In addition to detailing the experimental rationale, protocol, and outcomes, considerable emphasis was spent describing personnel experience expertise in animal handling and husbandry, and the appropriateness and humanness of anaesthetisation and sacrificial techniques. The Landcare Research AEC approval number for the mouse research is 98/1/1. Similarly, the approval numbers for research involving shortfinned eels are 99/6/1 and 00/1/1.
Furthermore, approval for the eel research was also sought from Tangata Whenua (Maori tribe of
Acknowledgements
I te timatatanga ko te pu
Na te pu ko te more ko te weu
Na te weu ko te aka ko rea
Na te rea ko te wao nui
Na te wao nui ko te kuni
Na te kuni ko te whe
TIhei mauri ora
Ko te mihi tuatahi maku ki to matou kaihanga Maori. Nana te wairua 0 nga mea katoa i tuku. Nana ana taua wairua i tango. No reira kia whai korororia ki tona ingoa tapu mo ake tonu atu.
Ka huri nga whakaaro ki nga tini aitua 0 te wa, ko te hunga wairua kua takahia te huarahi ki tua i te arai. Na koutou te ihi te mana me te kakano 0 nga moemoea i whakato. Ahakoa, kua mate atu
koutou, ka ora mai ko tatou. No reira haere haere hoki atu ra.
Ka hoki mai nga whakaaro ki a tatou, ko te hunga whatumanawa e to ana i te ao marama. Tana koutou tena tatou.
Ki toku whanau. He mihi nui he mihi aroha ki a koutou mo 0 koutou tautoko, 0 koutou awhina i runga i tenei wero teitei. I rongo ahau i te katoa 0 0 koutou whakaaro pai no reira ... na tatou tanei
mahi i mahia, a, ma tatou ana te kororia.
Ko oku kaiwhakahaere matua, Dr Ravi Gooneratne, Dr Charles Eason, ratou ko nga kaiwhakahaere tuarua (Dr Kathryn O'Halloran, Dr Louis Tremblay) ko toku kaiakopono Maori (Rauru Kirikiri). Na te kaha 0 ta koutou awhina me ta koutou wero mai toku hinengaro i oho ake. Kaore ahau kia
warewaretia. No reira, tena koutou.
Ahakoa, he poto tanei mihi ki a koutou, na te aroha.
E waihotia e au te mihi mutunga mo aku hoa maha. Tau ka koutou, tau ka! Ka puta mai ana tanei tangata i te whitinga 0 te ra. Ahakoa, kua ahua huna ahau i anei tau e toru. I tuku tonu mai 0
koutou whakaaro pai. Ka mau te wehi!
No reira ka hoki ahau ki te korero 0 a tatou tipuna Maori, a, "Na koutou katoa i whakakakahau te
kahohu ... he taniko taku"
Apiti hono tatai hono. Ko te hunga mate ki te hunga mate. Apiti hono tatai hono. Ko te hunga ora
ki te hunga ora. Tiha mauri ora.
In what has been a significant undertaking, this thesis owes much to the intellectual input, logistical assistance, and personal support of a large number of people and organisations.
Firstly, I would like to pay my respects to my ancestors who have passed through the veil between this world and the next, and whose aspirations, love and support are intricately woven into the
events that have guided me along this path. To my immediate family and my extended family, all of whom have helped shape this thesis in their own unique ways. Words cannot adequately describe my gratitude to you all. Your support, inspiration, patience and understanding will be remembered long after this thesis becomes relegated to door-stopper status.
To my academic supervisors, Drs Ravi Gooneratne and Charles Eason, I express my humble thanks. This PhD programme has been, at times, a difficult road. Your guidance and encouragement, particularly towards the end of this thesis, is greatly acknowledged. To my co-advisors, Drs Kathryn O'Halioran and Louis Tremblaywhose continual input on intellectual, logistical, and personal issues have helped raise this Titanic of an idea from the realms of conceptuality and into a literary epic. Also to Rauru Kirikiri and Dr Oliver Sutherland, for providing the environment and the inspiration to strive for academic excellence while remaining true to my taha Maori. My sincere thanks to you all.
Other key people and organisations who have figured in this research are:
Clem Smith for all the time, and effort that he willingly gave in order to supply me with sufficient eels to carry out this research;
Kelly Davis (eel fisherman, Te Tai Araiteuru Customary Fisheries representative, iwi spokesperson); The Eel Management Committees (Eel MAC1 and 2);
Te Runanga 0 Ngai Tahu.
Your enthusiasm and supportive of this project is appreciated.
To those people who have assisted me with the technical issues:
Drs John Lewis and Peter Elder (antibody production and ELISA development and trouble shooting); Dr Jim Morton (FPLC research);
Manaaki Whenua Animal Facility staff;
Les Brown (assistance with microsome preparations, and tissue sampling days); Ray Webster and Wendy Ruscoe (assistance with the statistiCS);
Dr Mike van den Heuvel (plasma 17~-estradiol analysis);
Malcolm Main and Dr Adrian Meredith (Environment Canterbury), Ken Couling, Chris Rance and Robert Watts (Christchurch City CounCil), Trevor Michington and Ken Fox (Waimakariri District CounCil) (assisted in the selection of appropriate field sites for the
in situ
eel exposures);The Landcare library staff (who dealt with my constant barrage of article requests).
A huge vote of thanks to you all.
I would also like to acknowledge my friends, especially within Te Ahikaaroa kapa haka and Lincoln University. Your collective ability to restore a sense of reality and calm to my life, especially in the face of periodic self-perceived prophecies of impending doom, helped keep the dream afloat. I hope that one day I can return the favour. Kia ora koutou katoa
Finally I would like to acknowledge the TOapapa POtaiao Maori Fellowship Scheme, Manaaki Whenua -Landcare Research, and the Maori Education Trust for providing me with financial support during the course of this research. In a discipline that is under represented by Maori, your efforts to encourage greater Maori participation are to be applauded.
Table of Contents
Chapter 1 INTRODUCTION ... 1
1.1 Background . . . .. 1
1.2 Ecotoxicology. . . .. 3
1.3 Research Objectives ... 3
1.3.1 Broad Research Objectives ... 4
1.3.2 Specific Research Objectives ... 4
Chapter 2 LITERATURE REVIEW ... 6
2.1 State of the New Zealand Environment . . . .. 6
2.2 Biological Effects Based Testing. . . .. 9
2.2.1 Classical environmental tests . . . .. 9
2.2.2 Ecotoxicological tests . . . .. 10
2.2.3 Biomarkers. . . .. 10
2.2.4 Implementation of biomarker technologies . . . .. 13
2.3 Biomarkers of the Biotransformation Pathways . . . .. 15
2.3.1 Phase I biotransformation reactions . . . .. 15
2.3.1.1 Cytochrome P450 ... 15
2.3.2 Phase II biotransformation reactions and glutathione-S-transferase ... 19
2.3.2.1 Glutathione S-transferases ... 19
2.4 Biomarkers of the Endocrine System ... 23
2.4.1.1 Vitellogenin ... 26
2.5 Biomarkers of Nervous System Function ... 30
2.5.1 Teleost nervous function and acetylcholinesterases ... 30
2.5.1.1 Effects of organophosphates on acetylcholinesterases . . . .. 31
2.6 The Use of Animals in Environmental Research .. . . .. 32
2.6.1 C57BU6 Mice . . . .. 33
2.6.2 Shortfinned Eels .. .. . . .. .. . .. .. . . .. . .. . . . .. .. .. .. .. . .. ... 34
Chapter 3 MATERIALS AND METHODS ... 38
3.1 Animal Care and Anaesthesia Protocols . . . .. 38
3.1.1 C57BU6 mouse husbandry ... 38
3.1.2 Mouse anaesthesia ... :. 39
3.1.3 Shortfinned eel husbandry ... 39
3.1.4 Shortfinned eel anaesthesia . . . .. 41
3.2 Tissue Collection . . . .. 42
3.2.1 Dissection and storage of mouse liver ... . .. 42
3.2.2 Isolation of eel plasma ... 42
3.2.3 Dissection and storage of eel brain ... 42
3.2.4 Dissection and storage of eel liver tissue . . . .. 43
3.3 Hepatic Cytochrome P450 . . . .. 43
3.3.1 Preparation of hepatic microsomes ... 43
3.3.2 Total cytochrome P450 concentration ... 44
3.3.3 Measurement of 7-ethoxyresorufin O-deethylase (EROD) activity. . . .. 46
3.3.3.2 Protein standard curve for EROO assay ... . . . .. 48
3.3.3.3 EROO assay protocol ... 48
3.3.3.4 Calculation of specific EROO activity. . . .. 49
3.4 Glutathione-S-transferase (GST) Assay ... 50
3.4.1 Preparation of the post-mitochondrial (S-9) fraction . . . .. 50
3.4.2 Assay protocol ... 50
3.4.3 Calculation of GST activity ... , 52
3.5 Vitellogenin (Vtg) ELISA ... 53
3.5.1 Induction of vitellogenin synthesis ... 54
3.5.2 Purification of vitellogenin . . . .. 54
3.5.3 Characterisation of purified vitellogenin ... ;. 55
3.5.4 Production of anti-eel vitellogenin polyclonal antibodies ... 56
3.5.5 Characterisation of primary antibodies - Western blot analysis ... 56
3.5.6 Characterisation of polyclonal antibodies - Immunoelectrophoresis. . . .. 56
3.5.7 ELISA assay - Vitellogenin standard curve. . . .. 57
3.5.8 ELISA assay - Assay protocol ... 58
3.5.9 Calculation of minimum limit of detection (LOO) . . . .. 58
3.5.10 ELISA assay - Calculation of Vtg concentration . . . .. 59
3.6 Acetylcholinesterase (AChE) Activity Assay ... 59
3.6.1 Sample preparation ... 60
3.6.2 Assay protocol ... 60
3.6.3 Calculation of AChE activity. . . .. 61
3.7.1 BSA standard curves ... 62
3.7.2 Assay protocol ... 62
3.7.3 Calculation of protein concentration. . . .. . ... 63
3.8 Water Parameter Measurements ... , 63
3.9 Chemical Residue Analyses ... 65
3.9.1 Polyaromatic hydrocarbon, organochlorine, and 17-~ estradiol analyses ... 65
3.10 Statistical Analyses ... 65
PART I MONITORING TERRESTRIAL POLLUTION: The Laboratory Mouse as a Test Species ... " ... " .... 67
Chapter 4 ASSAY DEVELOPMENT ... 69
4.1 7-Ethoxyresorufin O-Deethylase Activity ... :. 70
4.1.1 Methods. . . .. 70
4.1.2 Results. . . .. 71
4.2 Total Cytochrome P450 Concentration ... 71
4.2.1 Method ... , 71
4.2.2 Results. . . .. 71
4.3 Conclusions . . . .. 72
Chapter 5 INTRAPERITONEAL INJECTIONS OF POLYAROMATIC HYDROCARBON COMPOUNDS ... 73
5.1 Introduction. . . .. 73
5.2 Methods. . . .. 75
5.2.1 Experimental design . . . .. 75
5.2.2.1 Liver microsomal EROD activity ... 76
5.2.2.2 Liver microsomal P450 concentration ... 76
5.2.2.3 HSI ... 76
5.2.2.4 Carcass PAH residues. . . . .. 76
5.2.3 Statistical analyses . . . .. 77
5.3 Results. . . .. 77
5.3.1 Liver microsomal EROD activity . . . .. 77
5.3.2 Liver microsomal P450 concentration ... , 77
5.3.3 Hepatic somatic index ... 78
5.3.4 Carcass Residues ... 81
5.4 Conclusions ... :. 81
Chapter 6 POL YAROMATIC HYDROCARBON SPIKED SOIL EXPERIMENT. . . .. 84
6.1 Introduction. . . .. 84
6.2 Methods . . . .. 84
6.2.1 Experimental design . . . .. 84
6.2.1.1 Soil preparation ... . . . .. 84
6.2.1.2 Preliminary experiment ... 85
6.2.1.3 Spiked soil experiment ... 85
6.2.2 Biomarker analyses ... 86
6.2.2.1 Liver microsomal EROD activity ... 86
6.2.2.2 Liver microsomal P450 content . . . .. 86
6.2.2.3 HSI ... 86
6.3 Results. . . . .. 87
6.3.1 Soil characterisation . . . .. 87
6.3.2 Preliminary experiment . . . .. 87
6.3.3 Spiked soil experiment .. . . .. 88
6.3.3.1 Liver microsomal EROD activity ... 88
6.3.3.2 Liver total P450 content ... ~. . . .. 88
6.3.3.3 HSI ... 88
6.3.3.4 PAH residue analysis ... 88
6.4 Conclusions . . . .. 90
Chapter 7 EX SITU EXPOSURE TO SOIL FROM CONTAMINATED SITES ... . . .. 93
7.1 Introduction ... ;. 93
7.2 Methods . . . .. 94
7.2.1 Contaminated site soil collection and particle size characterisation . . . .. 94
7.2.2 Animal exposure experiment ... 95
7.2.3 Biomarker analyses ... 95
7.2.3.1 Liver microsomal EROD activity ... 95
7.2.3.2 Liver microsomal P450 content. . . .. 95
7.2.3.3 HSI ... 95
7.2.3.4 Carcass PAH residues ... 95
7.2.3.5 Soil PAH and total petroleum hydrocarbons (TPH) residues. . . . . .. 96
7.2.4 Statistical analyses. . . .. 96
7.3.2 Biomarker responses ... 97
7.3.2.1 Liver microsomal EROD activity ... 97
7.3.2.2 Liver microsomal P450 content ... 97
7.3.2.3 HSI ... 97
7.3.3 Polyaromatic hydrocarbon residues ... 99
7.3.3.1 Soil ... 99
7.3.3.2 Mouse carcasses . . . .. 100
7.4 Conclusions ... 101
Chapter 8 MICE AS A BIOMARKER RESEARCH MODEL CONCLUSIONS ... . . . .. 106
8.1 Conclusions . . . .. 107
8.2 Future Research ... ; 109
PART II AQUATIC POLLUTION: The Shortfinned Eel as a Test Species ... 110
Chapter 9 ASSAY DEVELOPMENT. . . .. 112
9.1 Cytochrome P450 Biomarkers. . . .. 112
9.1.1 Methods. . . .. 112
9.1.1.1 Source of animals and tissues. . . .. 112
9.1.1.2 EROD assay ... 112
9.1.1.3 Cytochrome P450 content ... 113
9.1.2 Results. . . .. 113
9.1.2.1 ERODassay ... 113
9.1.2.2 Hepatic microsome cytochrome P450 content ... 113
9.1.3 Conclusions... . . .. 114
9.2.1 Method. . . .. 114
9.2.2 Results... . . . .. 115
9.2.3 Conclusion... . . . .. 115
9.3 Acetylcholinesterase (AChE) Assay ... 115
9.3.1 Method. . . .. 115
9.3.2 Results. . . .. 115
9.3.3 Conclusion... 116
9.4 Vitellogenin ELISA. . . .. 116
9.4.1 Method. . . .. 117
9.4.1.1 Induction of Vtg synthesis . . . .. 117
9.4.1.2 Purification of plasma Vtg ... : 117
9.4.1.3 Characterisation of isolated proteins by PAGE ... . . .. 117
9.4.1.4 Anti-eel vitellogenin antibody production . . . .. 117
9.4.1.5 Characterisation of primary antibodies by Western blot analysis .. 117
9.4.1.6 Characterisation of primary antibodies by immunoelectrophoresis. 117 9.4.1.7 Development of the ELISA for eel Vtg ... " 117 9.4.2 Results. . . .. 118
9.4.2.1 Purification of plasma Vtg ... 118
9.4.2.2 Characterisation of isolated proteins by SDS-PAGE . . . .. 118
9.4.2.3 Anti-eel Vtg antibody production ... 119
9.4.2.4 Characterisation of primary antibodies. . . .. 120
9.4.2.5 Development of the ELISA for eel Vtg . . . .. . .. .. .. .. . . .. . .. .. 124
Chapter 10 INTRAPERITONEAL INJECTION OF TEST COMPOUNDS ... 128
10.1 Introduction ... , 128
1 0.1.1 17~-estradiol... 128
10.1.2 4-Nonylphenol ... 129
10.1.3 Chlorpyrifos ... 129
10.1.4 Benzo[a]pyrene ... 130
10.1.5 Aroclor 1254 ... 131
10.2 Methods. . . .. 132
10.2.1 Experimental design . . . .. 132
10.2.2 Water analysis ... 134
10.2.3 Biomarker analyses ... ; 134
10.2.3.1 Liver microsomal EROD activity and P450 content . . . .. 134
10.2.3.2 Liver cytosolic GST activity ... 135
10.2.3.3 Plasma and brain AChE activity ... 135
10.2.3.4 Plasma Vtg concentration ... 135
10.2.4 Carcass PAH, OC, and metal residue analysis ... 135
10.2.5 Statistical analysis ... 135
10.3 Results. . . .. 136
10.3.1 Water analysis ... 136
.10.3.2 Intraperitoneal exposures-experiment 1 (E2, 4-NP, CP, or vehicle) ... 136
10.3.2.1 EROD activity ... 136
10.3.2.2 P450 content . . . .. 136
10.3.2.4 GST . . . .. 137
10.3.2.5 Vtg Concentration ... 137
10.3.2.6 AChE activity. . . .. . . .. . . . .. .. .. .. .. .. ... 140
10.3.3 Intraperitoneal exposures-experiment 2 (B[a]P, Aroclor 1254, E2 + Aroclor 1254, E2) ... 141
10.3.3.1 EROD activity ... 141
10.3.3.2 P450 content . . . .. 141
10.3.3.3 HSI ... 141
10.3.3.4 GST . . . .. 141
10.3.3.5 Vtg Concentration ... 141
10.3.3.6 AChE activity ... ~ 142
10.3.4 Plasma E2, and carcass PAH, and OC residue levels ... 145
10.4 Discussion. . . .. 147
10.4.1 Water-chemical and physical parameters. . . .. 147
10.4.2 EROD, P450 content, and HSI values.. . . .. . . . .. .. .. .. . .. .. .. .. ... 147
10.4.2.1 B[a]P Exposure ... 147
10.4.2.2 Aroclor 1254 exposures. . . . .. 148
10.4.2.3 Combined Aroclor 1254 and E2, and E2 exposures. . . .. 150
10.4.2.4 E2, 4-NP and CP exposures .. . . .. 150
10.4.3 GST Activity ... 151
10.4.3.1 CP exposures ... 151
10.4.3.2 B[a]P, Aroclor 1254 exposures ... 151
10.4.4 Plasma Vtg concentrations . . . .. 153
10.4.4.1 E2 exposures. . . .. 153
10.4.4.2 4-NP exposures . . . .. 155
10.4.4.3 CP exposures ... 155
10.4.4.4 Aroclor 1254, combined E2 and Aroclor 1254, and B[a]P exposures ... 156
10.4.5 AChE activity ... 157
10.4.5.1 CP exposures ... 157
10.4.6 General Conclusions ... 158
Chapter 11 IN SITU CAGE EXPOSURE AT CONTAMINATED SITES. . . .. 162
11.1 Introduction ... ", 162 11.1.1 Field sites: The Halswell River ... . . . .. 163
11.1.2 Field sites: The Heathcote River . . . .. 164
11.1.3 Field Sites: Southbrook Stream ... 164
11.2 Methods . . . .. 166
11.2.1 Preliminary caging trials ... . . . .. 166
11.2.2 Experimental design . . . .. 166
11.2.3 Weather and water parameter measurements . . . .. 166
11.2.4 Biomarker analyses ... 167
11.2.4.1 Liver microsomal EROD activity and P450 content . . . .. 167
11.2.4.2 Liver GST activity ... 167
11.2.4.3 Plasma and brain AChE activity ... 167
11.2.5 Carcass and sediment PAH, and OC residue analysis ... 168
11.2.6 Statistical analysis ... 168
11.3 Results ... " 168 11.3.1 Preliminary caging trials ... 168
11.3.2 Weather and water parameters ... 168
11.3.3 Field site exposures ... . . . .. 169
11.3.3.1 EROD activity . . . .. . . .. . .. .. . . .. . .. . . .... 169
11.3.3.2 P450 content ... , 170
11.3.3.3 HSI ... 170
11.3.3.4 GST . . . .. 170
11.3.3.5 Vtg Concentration ... ; 170
11.3.3.6 AChE activity .. .. . .. .. . .. .. .. .. . . . .. .. .. . .. .. .. . . . .... 170
11.4 Conclusions. . . . .. 174
11.4.0.1 Preliminary caging trial ... 174
11.4.1 Field exposures ... 174
11.4.1.1 Water parameter status at field sites and local weather patterns . 174 11.4.1.2 EROD activity, P450 content, and HSI ... 175
11.4.1.3 GST activity . . . .. 175
11.4.1.4 Plasma Vtg ... 176
11.4.1.5 AChE activity ... '" 177 11.4.2 Overall conclusions ... 178
12.1 Conclusions ... , 180
Chapter 13 GENERAL CONCLUSIONS ... , ... , 184
13.1 The Mouse and Eel Experiments . . . .. 184
13.2 Future Research ... 185
13.3 Concluding Remarks ... , 187
REFERENCES ... 188
Appendix I CHEMICAL LIST ... . . .. 237
Appendix II BUFFERS AND SOLUTIONS. . . .. 240
11.1 Cytochrome P450 Assays. . . .. 240
11.1.1 Part 1: Liver perfusion buffer ... 240
11.1.11 Part 2: Hepatic microsome preparation ... ; 240
11.1.111 Part 3: Spectral analysis of hepatic cytochrome P450 content. . . .. 241
II.I.IV Part 4: 7-Ethoxyresorufin O-deethylase (EROD) activity assay ... . . .. 241
II. LV Part 5: Fluorescamine assay ... 241
11.11 Glutathione S-transferase activity assay . . . .. 242
11.111 Vitellogenin ELISA development ... 242
11.111.1 Part 1: Fast protein liquid chromatography (FPLC) ... 242
11.111.11 Part 2: Polyacrylamide gel electrophoresis - Reducing Conditions ... 243
11.111.111 Part 2: Western blot analysis - Reducing conditions ... 244
II.III.IV Part 3: Immunoelectrophoresis. . . .. 245
II.III.V Part 4: Enzyme-linked immunosorbant (ELISA) assay. . . .. 246
I 1.1 V Brain and Plasma Acetylcholinesterase Activity ... 248
II.VI Calibration Solutions for Water Quality Probe. . . .. 249
I LVII Concentrated Acids and Bases for Adjusting pH . . . .. 249
II.VII.I Hydrochloric acid (5N) ... 249
II.VII.II Sulphuric acid (5M) . . . .. 249
II.VII.III Sodium hydroxide (5N) . . . .. 250
Appendix III CALCULATION OF SPECIFIC ETHOXYRESORUFIN ACTIVITY ... 251
111.1 Calculation of Resorufin Standard Curve ... 251
111.11 Derivation of the Conversion Factor ... 251
111.111 Convertion of Sample ~Fluoresence/well to ~pmoles of Resorufin/well . . . .. 251
II I. IV Calculation of Well Protein Concentration (fluorescamine assay) . . . .. 252
II LV Calculation of Specific Activity ... ; 253
Appendix IV Chemical Residue Analyses ... 254
IV.I Polyaromatic hydrocarbon and organochlorine analyses ... 254
IV.l.1 Mouse Carcasses. . . .. 254
IV.l.1I Soil... 254
IV.1.11 Sediment ... 254
IV.1.1I1 Eel Carcasses ... 254
IV.II Plasma 17-~ estradiol analyses ... , 254
Appendix V BEDDING SUBSTRATE: EFFECTS ON CYTOCHROME P450 RESPONSES 255
V.I Biomarker responses. . . . .. 255
Appendix VI SPIKED SOIL EXPERIMENT ... 256
Appendix VII CALCULATING AN IPo DOSE FOR CHLORPYRIFOS EXPOSURES 0 0 0 0 0 0 0 258
List of Figures
Figure 2.1: Factors influencing biomarker responses ... , 14
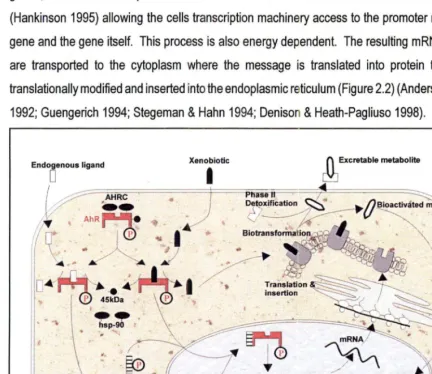
Figure 2.2: P4501 A protein induction ... . . . . .. 18
Figure 2.3: GST subunit induction ... 22
Figure 2.4: Multi-hormone control of vitellogenesis ... 26
Figure 2.5: Vitellogenin induction ... 28
Figure 2.6: Female C56BU6 mouse ... 34
Figure 2.7: The shortfinned eel (Anguilla australis) ... 37
Figure 3.1: Schematic representation of the fluorescamine reaction ... 47
Figure 3.2: The plate layout for the EROD and fluorescamine protein assays . . . .. 49
Figure 3.3: Schematic representation of the GST reaction pathway ... 52
Figure 3.4: The plate layout for the GST and AChE activity assays. . . .. 53
Figure 3.5: The plate layout of Vtg assay . . . .. 59
Figure 3.6: Schematic representation of AChE hydrolysis of ATChl ... 60
Figure 3.7: Schematic representation of the Bradford reaction ... 61
Flow Diagram 1: A schematic overview of the mouse experiments. . . . .. 68
Figure 4.1: Dithionite incubation time on the absorption spectra of mouse microsomes. . . . .. 72
Figure 5.1: Molecular structures of the PAH test compounds. . . .. 74
Figure 5.2: Ip. exposure: mouse hepatic microsomal EROD activity ... 78
Figure 5.3: Ip. exposure: mouse total hepatic microsomal cytochrome P450 content . . . .. 79
Figure 5.5: Ip. exposure: mouse carcass residue levels. . . .. 81
Figure 6.1: Spike soil exposure: soil S[a]P and SA concentration ... 89
Figure 7.1: Contaminated soil exposure: hepatic microsomal EROO activity ... , 98
Figure 7.2: Contaminated soil exposure: mouse total hepatic microsomal P450 content. . . .. 98
Figure 7.3: Contaminated soil exposure: HSI . . . .. 99
Flow Oiagram 2: A schematic overview of the eel experiments. . . . .. 111
Figure 9.1: Absorption difference spectra of eel microsomes. ... 114
Figure 9.2: FPLC absorption profile of plasma from E2 treated and control eels ... 118
Figure 9.3: SOS-PAGE analysis of FPLC purified protein ... 119
Figure 9.4: SOS-PAGE and Western analysis of purified eel Vtg and plasma. . . .. 120
Figure 9.5: Western analysis of purified eel Vtg plasma ... ; 121
Figure 9.6: ELISA to investigate the parallelism between purified eel Vtg and plasma ... 122
Figure 9.7: Immunoelectrophoresis gel stained with coomassie blue stain ... 123
Figure 9.8: The binding specificity of adsorbed primary antiserum. . . . .. 124
Figure 9.9: Optimisation of the Vtg ELISA conditions . . . .. 125
Figure 10.1: Molecular structures of the test compounds. ... 132
Figure 10.2: Analysis of water parameters . . . .. 137
Figure 10.3: Ip. experiment 1: eel hepatic microsomal EROO activity ... 138
Figure 10.4: Ip. experiment 1: eel hepatic GST activity ... 139
Figure 10.5: Ip. experiment 1: eel plasma Vtg concentration ... . . . .. 139
Figure 10.6: Ip. experiment 1: eel specific plasma and brain AChE activity ... 140
Figure 10.7: Ip. experiment 2: eel hepatic microsomal EROO activity ... 143
Figure 10.9: Ip. experiment 2: eel plasma Vtg concentration ... . . . .. 144
Figure 10.10: Ip. experiment 2: eel specific plasma and brain AChE activity ... '" .. 145
Figure 10.11: Plasma E2 and Vtg concentration following E2 exposure ... 146
Figure 11.1: Field site locations ... 165
Figure 11.2: Daily rainfall and air temperatures during the field experiment. . . . .. 169
Figure 11.3: Field exposure: eel hepatic microsomal EROD activity ... 171
Figure 11.4: Field exposure: eel hepatic GST activity ... 172
Figure 11.5: Field exposure: eel plasma Vtg concentration ... 172
Figure 11.6: Field exposure: specific eel brain and plasma AChE activity . . . .. 173
Figure 111.1: Calculation of the conversion factor (~fluoresence/min to ~pmoles of resorufin formed/min) ... , 251
Figure 111.11: Conversion of ~fluoresence/min to ~pmoles resorufin/min . . . .. 252
Figure 111.111: Calculation of protein concentration in sample and internal reference wells ... 253
Figure IILlV: Calculation of specific activity ... 253
Figure V.I: Cytochrome P450 responses after housing on steel mesh flooring or clean soil.. 255
Figure VLI: Hepatic EROD activity following exposure to soil spiked with S[a]P or SA. ... .. 256
Figure VI.II: Hepatic P450 concentration following exposure to soil spiked with S[a]P or SA. 257
List of Tables
Table 2.1: The nature and source of chemical contamination in New Zealand ... 7
Table 2.2: Toxic effects that can be elicited by P450 ... , 17
Table 2.3: Classes of compounds which have exhibited estrogenic activity. ... 27
Table 3.1: Generation of BSA standards ... 62
Table 4.1: Optimum assay conditions. . . . .. 71
Table 5.1: Experimental dosing and sampling regime. . . . .. 76
Table 6.1: Experimental dosing and sampling regime. . . . .. 86
Table 6.2: Soil characteristics of control soil. . . .. 87
Table 7.1: Soil characteristics of MP soils ... 97
Table 7.2: Contaminated soil exposure: MP soil PAH and TPH residues ... 101
Table 7.3: Contaminated soil exposure: PW soil PAH and TPH residues ... 102
Table 7.4: New Zealand soil acceptance criteria ... 106
Table 9.1: Optimum EROD assay conditions . . . .. 113
Table 9.2: Optimum GST assay conditions ... 115
Table 9.3: Optimum AChE assay conditions ... 116
Table 10.1: The stock concentration (High and Low) for each test compound. ... 133
Table 10.2: Dosing and sampling design for the ip. experiments. . . .. 134
Table 10.3: Proposed mechanisms of Ah receptor mediated antiestrogenicity ... 157
Table 10.4: Summary of biomarker responses following ip. injections . . . .. 159
Table VIILlI: Selected water parameter measurements at the Heathcote caging sites. .... 260
List of Equations
Equation 3.1: Beer-Lambert Law ... 46
Equation 3.2: Calculation of total cytochrome P450 concentration. ... . . . .. 46
Equation 3.3: Calculation of resorufin concentration. . . . .. 48
Equation 3.4: Calculation ,of AChE activity. ... 61
List of Abbreviations
Abbreviations for commonly quoted chemicals used in this research, along with their full chemical name, are listed in Appendix I.
Text Abbreviation a ~NF
e
J1 TT 4-NP 7 -ethoxyresorufin ACh AChE Ah AhR AHH AHRC ANDVA ANZCCART APED ARE ARNT ATChl BA BLD BSA Full Namealpha GST isoform
~-Napthoflavone
theta GST isoform
mu GST isoform
pi GST isoform
4-Nonylphenol
7 -Ethoxy-3H-phenoxazin-3-one
Acetycholine
Acetylcholinesterase
Aryl hydrocarbon
Aryl hydrocarbon receptor
Aryl hydrocarbon hydroxylase
Aryl hydrocarbon receptor complex
Analysis of variance
Australian and New Zealand Council for the Care of Animals in Research
Alkylphenol polyethoxylate
Antioxidant response element
Aryl hydrocarbon receptor nuclear translocater
Acetylthiocholine iodide
1,2 Benz(a)anthracene Below limit of detection
BuChE Butyryl cholinesterase
B[a]P 3,4 Benzo[a]pyrene
C57BU6 C57 Black mice
CDNB 1-Chloro-2,4-dinitrobenzene
CO Carbon monoxide
CP Chlorpyrifos
DCNB 1-Chloro 2,4-dinitrobenzene
DDE p,p'-Dichlorodiphenyldich loroethylene
DDT p, p'-Dich lorodiphenyltrich loroethane
DES Diethylstilbestrol
DMSO Dimethyl sufoxide
DNA Deoxyribonucleic acid
DO Dissolved oxygen
DTNB 5,5'-Dithio-bis(2-nitrobenzoic acid)
DTT Dithiothreitol
E2 17~ estradiol
EDC Endocrine disrupting chemical
ELISA Enzyme-linked immunosorbant assay
ERE Estrogen responsive element
EROD 7 -Ethoxyresorufin O-deethylase
FAD Flavin adenine dinucleotide
Fe2+ Ferrous iron
Fe3+
Ferric iron
FMN Flavin mononucleotide
FPLC Fast protein liquid chromatography
GH Growth hormone
Glu Glutamic acid
GnRH Gonadotropin-releasing hormone
GSH Glutathione
GST Glutathione S-transferase
GTH Pituitary gonadotropin
GtHI Gonadotropin I
GtHIl Gonadotropin II
HepG2 Human hepatoma cell line
HSI Hepatic somatic index
hsp90 Heat shock protein 90
IARC International Agency for Research on Cancer
IgG Immunoglobin-G
im. Intra muscular injection
ip. Intraperitoneal injection
KCI Potassium chloride
LC Lethal concentration (mg/ml)
LD Lethal dose (mg/kg)
LOD Limit of detection
LOED Lowest observed effect dose
Lys Lysine
MfE Ministry for the Environment
MQ Milli Q reagent grade water ultra-pure water
mRNA Messenger ribonucleic acid
MRST Ministry of Research Science and Technology
MS222 Tricaine methanesulphate
NADPH Nicotinamide adenine dinucleotide phosphate
NH3 Ammonia
NH4+ Ammonium
NRC National Research Council
O2 Oxygen
OECD Organisation for Economic Co-operation and Development
OP Organophosphate
OPD O-phenylene diamine
P4S0 Cytochrome P4S0
PAGE Polyacrylamide gel electrphoresis
PAH Polyaromatic hydrocarbon
PCB Polychlorinated biphenyl
PCB-10S 2,3,3'4,4'-Pentachlorobiphenyl
PCB-1S6 2,3,3' ,4,4' ,S-Hexachlorobiphenyl
PCB-169 3,3' ,4,4' ,S,S'-Hexachlorobiphenyl
PCDD Polychlorinated p-dibenzo dioxin
PCDF Polychlorinated p-dibenzo furans
PDVF Polyvinylidene difluOiide
pKa Ionisation constant
PMSF Phenylmethylsulfonyl fluoride
PVP Polyvinyl pyrolidine
RMA Resource Management Act (1991)
S-9 Post mitochondrial fraction
SDS Sodium doecyl sulphate
SDS-PAGE Sodium doecylsulphate polyacrylamide gel electrophoresis
TEMED NNN'N'Tetramethylethyllenediamine
T3 & T4 Thyroid hormones
TCDD 2,3,7,8 Tetrachloro-dibenzo-p-dioxin
TDE p,p'-Dichlorodiphenyldichloroethane
TPH Total petroleum hydrocarbons
Vtg Vitellogenin
1.1
Background
Chapter 1
INTRODUCTION
"Ko te toto 0 te tangata
He kai
Ko te oranga 0 te tangata
He whenua"
Food supplies the
blood of humankind
Our well-being is reliant
on the land
(Maori Proverb, Brougham & Reed 1963)
chart economic health. A similar commitment to the environment is not as forthcoming. High on the agendas of many countries is a concern for the state of the worlds environment due to current industrial, agricultural and urban practices combined with the effects of a growing world population. However, maintaining or improving the current state of the environment is proving very difficult due
to the inherent complex nature of environmental processes, the extent of environmental damage at the local or global levels, and the underlying social and economic considerations (United Nations Development Programme et al. 2000).
The wide-spread acclaim of landmark publications like 'Silent Spring' (Carson 1962) and more recently 'Our Stolen Future' (Colborn et al. 1997) have propelled the issue of world-wide environmental damage resulting from chemical pollution into the critical spotlight of scientific, political
and public forums. Chemicals have played an integral role in human society for thousands of years. The usefulness and indispensable value that they have in modern society can be illustrated by the estimated 10 million natural and synthesised chemicals that have been used by humans (Zelikoff 1997). Furthermore, approximately 70,000 of these are used on a regular basis, while 200-1000 new compounds are thought to be synthesised annually (Connell et al. 1999). However, the unintended results of over-enthusiastic and indiscriminate use of chemicals during industrialisation, and intensified application and utilisation of natural resources by agriculture, forestry, mining, and urbanisation have been counter-productive and have resulted in a wide range of adverse environmental effects (Francis 1994). In the past, chemical damage to the environment has largely been identified retrospectively and in response to acute and localised events such as industrial accidents (Seveso and Bhopal), oil spills (Amoco Cadiz and Exxon Valdez) and chemical pollution of the Great Lakes of North America. Generally these events have been measured in terms of
1.2 Ecotoxicology
The increase in scientific effort that was directed towards understanding the nature and extent of chemical impacts on the environment began shortly after the Second World War. The field of toxicology expanded from studying the impacts of human exposure to chemicals to studies related to the impacts of chemicals on the environment, the latter becoming known as 'Environmental Toxicology'. The major tools available to environmental toxicologists were detection of toxic residues in the environment or in individual organisms and testing for the toxicity of chemicals on a selected number of animals other than man. However, to predict the impact of pollutants on wildlife species, populations, and whole ecosystems a much more multi-disciplinary approach was needed {Forbes
& Forbes 1994}. In the 1960's, convergence of a number of scientific disciplines to address these issues denoted the genesis of a new branch of science. The term 'ecotoxicology' was first coined by Professor Truhaut in 1969 {Zelikoff 1997; Connell et al. 1999}. He described the essence of this scientific field as the study of the environment {ecology} combined with the study of the effects of
chemicals on individual living organisms {toxicology}. Amongst the array of ecotoxicological techniques that have been developed, biological effects based tests at the organism level have risen to prominence in the last decade. The principle underlying these tests relies on measurable changes in physiological, biochemical, and/or molecular structure or function that occur in an individual after a period of exposure to a sub-lethal or lethal concentration of chemical contaminant/so
In contrast to other countries the application of ecotoxicology and its related techniques in New Zealand, such as biological effects tests to understand pollution effects, is in its infancy. However, there is an increasing acceptance of the value of ecotoxicology and the potential it offers which also
coincides with efforts to collate existing New Zealand specific data and generate new high quality environmental data. Through continued effort in these areas, it is envisioned that the significant information gap regarding the state and current impacts of chemicals in New Zealand can be addressed.
1.3 Research Objectives
testing framework.
1.3.1 Broad Research Objectives
To investigate the utility and sensitivity of selected biological effects based tests in two animal models (the shortfinned eel and laboratory mouse), to sub-lethal chemical exposures via a series
of laboratory and field based experiments.
1.3.2 Specific Research Objectives
A. To optimise the following assays:
i) A spectrophotometric assay to determine total hepatic microsomal cytochrome P450 concentration (P450 content) in eels and mice.
ii) A biochemical assay to measure hepatic microsomal cytochrome P450
1A1P4501A1 activity (EROD activity) in eels and mice respectively. Pooled liver tissue will be used to optimise the assay parameters; protein and substrate concentration, pH , and temperature, in each test species.
iii) A biochemical assay to measure serum and brain acetylcholinesterase (AChE) and hepatic S-9 fraction glutathione-S-transferase (GST) activity in eels.
B. To develop an enzyme linked immunosorbant assay (ELISA) that is specific for eel vitellogenin (Vtg) by:
i) Inducing the production of Vtg in eels via intraperitoneal (ip.) administration of pharmacological doses of the female sex steroid 17~-estradiol (E2). Plasma will be collected and the Vtg purified by chromatographic techniques. The isolated Vtg protein was characterised by gel electrophoresis.
ii) The isolated Vtg protein will be used to raise polyclonal antibodies in rabbits, which was used to develop an ELISA to measure eel Vtg.
iii) Optimise the ELISA
C. To measure biomarker responses in eels and mice exposed to selected chemical contaminants under controlled laboratory conditions
the laboratory exposure experiments.
ii) Measure biomarker responses in eels and mice following ip. administration of selected chemical compounds that are also present in the environment.
iii) Determine the actual and temporal responses of mouse liver EROD activity and the P450 content following exposure, via an ecologically relevant route, to sub-lethal
doses (ecologically relevant high and low doses), of one of two organic test compounds.
D. Application of the test species and selected biomarkers to:
i) ex situ exposures in mice (EROD activity and P450 content) that are exposed to soil from 'real' sites contaminated with organic compounds.
Chapter 2
LITERATURE REVIEW
2.1
State of the New Zealand Environment
New Zealand's 'clean green' environmental reputation is heavily marketed overseas to sustain growing tourism, agricultural, and horticultural industries. However, comments made in an Organisation for Economic Co-operation and Development (OECD) commissioned report refute these claims because of a paucity of high quality, centralised, and standardised environmental data (Taylor et al. 1997). Despite innovative environmental legislation (Resource Management Act [RMA] 1991; Fisheries Act 1996), and a commitment to international declarations (Rio Declaration 1992), the need to consolidate and strengthen the knowledge base with respect to the New Zealand environment, has been identified as a key issue underpinning future economic growth in New Zealand [Ministry of Research Science and Technology (MRST) 1995, 1996]. To facilitate this vision, the Environment 2010 Strategy (E201 0) was developed (MRST 1995) which in turn was aided by the release of significant government funds in the form of the 'Green Package' in 1996.
Table 2.1: The nature and source of chemical contamination in New Zealand
Sector Activity Chemicals of Concern (major groups)
Industrial Chemical manufacturing acids/alkalis, heavy metals, non-metals (boron, arsenic,
(paint, pesticide and pharmaceutical sulphides, chlorides), solvents (toluene, benzene),
manufacturing and use) organochlorines (dichlorodiphenyl trichloroethane [DDT],
dieldrin), other organic compounds (phenols, carbamates, organochlorines, creosote)
Petrochemical, gas, coal and energy (oil hydrocarbons (petrol, diesel, polyaromatic hydrocarbons
refineries, fuel storage tanks, bitumen [PAHs], tars), phenols, phthalates, alkyl phenol
production, power stations, oil refining, ethoxylates, acid/alkalis, metals, asbestos, fuel and coal
gasworks) products, cyanide and sulphur compounds, other organic
and inorganic chemicals
Transport sector (fuel depots, service hydrocarbons, asbestos, polychlorinated biphenyls
stations, automotive repair shops, railway (PCBs), pesticides, metals, acids, solvents yards, airports)
Waste disposal (Ieachates from landfills inorganics, gases (methane), cyanides, phenol, PCBs,
and waste dumps) acids
Urban Sewage (domestic, some industrial) numerous (including endocrine disruptors)
Storm-water run-off (oil products, dust PAHs, heavy metals, organics, inorganics
from vehicle exhausts, industrial chemicals)
Pesticides (animal poisons; insecticides, organochlorines, organophosphates, carbamates,
herbicides, fungicides) ammonia, hydrogen sulphide, cadmium
Agricultural Fertiliser residues organochlorines
Storage areas and dumps organochlorines
Sewage (animal poisons, insecticides, organochlorines, organophosphates, carbamates,
herbicides, fungicides and antihelmetic ammonia, hydrogen sulphide, cadmium
pesticides)
Forestry Pulp and paper, timber treatment, forestry resin acids, chlorinated organics, dioxins, copper,
operations chromium, arsenic, pentachlorophenol (PCP), chlordane
Table sourced from Macintyre et al. 1989; Williamson 1991; Sinner 1992; Worley Consultants Ltd 1992; Hickey 1995;
Aislabie et al. 1997; Auckland Regional Council 1995; Taylor et al. 1997; Jones 1998; MfE 1998; Timperly & Kuschel
2000.
were within a factor of 10 of body burdens that have been shown to cause reproductive and immune
effects in laboratory animals (Smith & Lopipero 2001). Similarly cancer risk estimates for the New
Zealand population that have been based on other human or animals studies suggest that there is
a high potential risk of environmental exposure to carcinogenic chemicals (Smith & Lopipero 2001).
Chemical inputs onto the land from agricultural activities are much less well characterised despite
the wide use and high application rates of pesticides (Macintyre et al. 1989). It is estimated that there could be as many as 1,000 ineffective chemical storage areas and dump sites containing
unwanted pesticides and herbicides and a further 1,000 private and farm landfills in existence (MfE
1992b In Taylor et al. 1997). In addition, the existence of up to several thousand contaminated sheep and cattle dips are also having an unknown impact on the environment. Environmental data
does exist for organochlorine compounds which were used heavily in agricultural applications
between 1940 and 1970. Although organochlorine compounds were banned in 1989, their
environmental persistence (parent compounds and metabolites) combined with the historical use
of specific organochlorine compounds in agriculture have resulted in high soil concentrations and
detectable levels in products grown or raised on these soils.
Ironically, chemical pollution in the aquatic environment is usually a consequence of land based
activities. In New Zealand, the agricultural sector utilises over half of the available land area and is
the predominant industry in the middle and lower catchments of stream and rivers. Non-point source
chemical inputs (paddock run-off) from this sector is postulated to be the leading source of pollution
to rivers, lakes and streams (Taylor et al. 1997). However, there is little information available that quantifies the extent and impact of agricultural pollution. In contrast, urban pressures on water
quality have been better characterised. It is estimated that chemical contamination from sewage
disposal, and storm-water run-off, ranks second and third respectively behind agricultural pollution
(Sinner 1992). Urban chemical pollution is particularly prevalent around estuaries, harbours and river
mouths where over 80% of the New Zealand population live. Sewage from households and
workplaces discharge vast amounts of human excreta, detergents and other substances (500 million
tonnes produced annually) into one of the more than 220 sewage treatment facilities nationwide
(Taylor et al. 1997). Treatment plants differ in the degree of treatment (primary, secondary, and tertiary) and treatment efficacy at periods of peak loadings, when treatment capabilities may be
exceeded, resulting in sub standard discharges into rivers, estuaries and the ocean. Industrial
discharges into sewers is location dependent and range from 0% to 35%. However, most major
1997). Pollution from storm-water run-off is problematic for three reasons. Firstly, storm-water
run-off is channelled into gutters and drainage pipes before discharging, untreated, through outfall
pipes into streams, rivers, lakes and coastal water (Taylor et al. 1997). Secondly, storm-water
run-off contains a cocktail of contaminants from roadways, construction and industrial sites
(Williamson 1991, Auckland Regional Council 1995). Thirdly, stormwater infiltration into many
sewage systems through faulty pipework, or illegal connections can overload sewage systems and
significantly reduce the efficiency of treatment facilities (Taylor et al. 1997).
2.2
Biological Effects Based Testing
2.2.1 Classical environmental tests
To more accurately characterise chemical contamination in New Zealand, the MfE was given the
responsibility (under the auspices of the E2010 strategy) to develop and implement a range of
national environmental performance indicators. Classically, methods of monitoring chemical
contamination on the environment have focused on residue analysis of environmental media and
tissue samples. This analytical approach can demonstrate the presence or absence of a wide range
of contaminants, with high selectivity and sensitivity. Risk assessors and environmental managers
then relate individual contaminant concentration to toxicity data derived from laboratory animal
exposure to singular chemicals, to predict adverse health effects (Peakall & Walker 1994). However,
this approach alone does not reveal the full biological significance of chemical concentrations
measured in environmental samples (Shugart et al. 1992). In addition, chemical residue analysis
only offers a snapshot in time and space, and therefore may not be able to affectively detect the
presence of chemical contaminants that do not bioaccumulate and/or are rapidly metabolised and
excreted. Furthermore, to measure chemical residues in environmental matrices is difficult and
requires specialist equipment and knowledge. Therefore, to fully assess complex mixtures of
contaminants a significant effort and financial outlay is required making the monitoring of temporal
and spatial concentrations of contaminants by means of chemical analysis logistically and financially
difficult. Residue analysis of environmental matrices alone is unable to answer the question of how
much of the chemical is available to the biological receptor (bioavailability). Depending on the
chemical, environmental matrix and biological receptor the amount of chemical that is available can
vary by orders of magnitude (Kendall et al. 1996). Residue analYSis of tissue samples does provide
be metabolised by the organism, while the relationship between tissue concentration and toxic effect
is often complex and not well understood (Shugart et al. 1992; Kendall et al. 1996).
2.2.2 Ecotoxicological tests
While residue analysis methodology forms the foundation of most environmental monitoring in New
Zealand, it is accepted that there is a lack of data and standardised tests linking the entry of
chemicals into the environment with the biological fate and biological impacts of these chemicals
(Taylor et al. 1997). In order to address these concerns, the main areas of scientific investigation have focussed on: a) the continuation of toxicity tests to investigate toxicological effects of individual
chemicals to fulfil regulatory and registration requirements, b) the entry, distribution and fate of
pollutants in the environment, (entry, movement, storage and transformation), and c) the effects of
pollutants on living organisms (at the level of the individual animal or at the population level) (Sol be
1993; Forbes & Forbes 1994; Walker et al. 1996).
In recent times, considerable research effort has been directed towards understanding the biological
effects of chemical exposure. Population monitoring as a means of measuring the effects of
pollutants on living organisms can provide the ultimate indicator of undesirable ecological effects.
At this level, it may be possible to detect changes in the numbers of individuals, species occurrence,
reproductive capacity, and gene frequency (eg. resistance of insects to insecticides) and correlate
these to community or ecosystem effects (e.g. soil nitrification) that are attributable to pollution.
However, its value as a early warning system is limited because at this stage irreversible damage
(organism death or impaired function) may have already occurred (Mayer et al. 1992) thus making it difficult to establish causality (Shugart 1993). In addition, population responses are also influenced
by natural variation in wild populations and imprecision in field sampling techniques making them
equivocal indicators of effect (McCarthy & Shugart 1990).
2.2.3 Biomarkers
Biological effects testing at the organism level and below, although not a new concept
(Kloepper-Sams & Owens 1993; PeakaIl1994), has recently been an area of intense research activity and
critical evaluation, especially with respect to their functional value to ecological risk assessment
(Weeks 1995; Holdway 1996; McCarty & Munkittrick 1996). Ascribed the term "biomarkers", a
succinct definition for these biological effects based tests is still the cause of much debate. In 1987
the National Research Council (NRC) proposed, with an emphasis on human health, the following
samples following chemical exposure" (Schlenk 1999). In 1990, Adams modified this definition to
encompass characteristics of organisms, populations, or communities that respond in measurable
fashion to changes in the environment (Adams 1990). This definition was altered further by
Depledge (Depledge 1993; Depledge et al. 1994) who added behavioural responses and included ecotoxicological concepts such as latency and genetic diversity. Following on from the NRC
definition, three classes of biomarker have been defined. The first called 'biomarker of exposure'
estimates the internal dose or bioavailability of a chemical or its metabolite in an organism via a
response to the initial interaction of the chemical contaminantls and the target cell, or molecule
(Schlenk 1999). The second class is called 'biomarkers of effect'. The fundamental concept of
these biomarkers follows the hypothesis that adverse environmental effects are preceded by the
induction of cellular defence or adaptation responses at the sub-organism level. However, if the
capacity of these mechanisms are exceeded then higher level damage will occur. Whether this
damage is reversible or irreversible depends on the nature of the damage and capacity of the
damaged system. Irreversible damage can result in further impairment at higher levels depending
on the developmental, reproductive, nutritional status of the organism (Brewster-et al. 1992; Schlenk 1999). The third class, biomarkers of susceptibility, differs from the previous two classes in that they
do not represent stages along the dose-effect continuum but are conditions that increase the rate
of transition between these steps (Brewster et al. 1992; Barrett et al. 1997). Therefore, biomarkers of susceptibility can be defined as indicators of the mechanistic processes that cause variability
among the compartment in the continuum between exposure and effect (Brewster et al. 1992; Travis 1993; Timbrell et al. 1994; Barrett et al. 1997).
Biomarkers have also been classified according to their specificity. Nonspecific biomarkers are
indicative of a nonspecific response to stress and include any measure that is altered by exposure
to a variety of stressors, and therefore can integrate the simultaneous impacts of multiple toxicants
or environmental factors on the organism. Well known examples of these biomarker types include
physiological responses (Handy & Depledge 1999), histopathological responses (Hinton et al. 1992)
stress proteins (Lewis et al. 1999), and deoxyribonucleic acid (DNA) damage (Garte 1994; Shugart 2000). In contrast, specific biomarkers can involve the quantification of specific enzymes or
biomolecules in a tissue and they can indicate exposure to a specific chemical or a related group of
compounds (Shugart et al. 1992). Examples of these include the inhibition of AChE by carbamates
and organophosphates (OP) where the degree of inhibition is closely related to tissue exposure
(Mineau 1998), and metallothionein proteins which are induced by exposure to heavy metals
For the purposes of my research I have subscribed to the definition of a biomarker as a biological
indicator of change, an early, sensitive, quantifiable measure of altered function in an organism in
response to an environmental stressor such as chemical contaminants (Kloepper-Sams & Owens
1993).
In human and veterinary medicine, and clinical toxicology, the concept of biomarkers has been in
existence for many years. The ideology of routine clinical tests is generally understood to be a
method where measurements that occur outside a range of well established 'normal values'
(background) can be interpreted as an indicator of serious higher level health effects
(Kloepper-Sams & Owens 1993). This model of biomarker application in human health, veterinary toxicology
and drug testing underlays the vision for the future implementation of biomarkers in environmental
health management. However, the increasing emphasis towards establishing causative links with
higher order and more ecologically relevant effects appears to be the greatest challenge facing
researchers (Clements 1994; Summers et al. 1997; Mineau 1998; De Coen 2000).
The application of biomarker techniques can provide useful information about the bioavailability of
bioactive compounds. In some instances, a biomarker response can confer evidence that an
organism has been exposed to toxicants at levels that exceed normal detoxification capacity
inducing responses at a higher level of biological organisation (Kloepper-Sams & Owens 1993).
However, for many biomarkers, a causative link has yet to be established. So, while population
stresses will be preceded by a biochemical response, all biochemical responses may not result in
population stress. In addition, some biomarkers can respond rapidly and with a high degree of
sensitivity to chemical contaminants, or classes of contaminants. Together, these can form the basis
of an 'early warning system' of potential long term effects (McCarthy & Shugart 1990; Peaka1l1994;
Bucheli & Fent 1995). In addition, they can provide evidence of exposure to compounds that do not
bioaccumulate or are rapidly metabolised and eliminated (Fossi et al. 1994; McCarthy & Shugart 1990). The inherent nature of biomarkers also reflects the capability of integrating exposure to an
entire range of contaminants present in the environment (McCarthy & Shugart 1990; Peaka1l1994;
Kloepper-Sams & Owens 1993) through cumulative, synergistic, or antagonistic effects of a complex
mixture of contaminants on biological systems (Walker 1998). Furthermore, spatial and temporal
2.2.4 Implementation of biomarker technologies
Like with other monitoring technologies, careful consideration of the scientific limitations, financial, and logistical ideals will aid in the effectual implementation of biomarker technologies. For example, the biomarker should be easy and inexpensive to measure. Many simple biomarker technologies are currently available and there is an increasing emphasis towards creating novel biomarkers or adapting existing technologies to user friendly "low tech" tools. Ideally, the technology should be capable of processing a large number of samples, or individuals, quickly and easily but more importantly the response should be repeatable. The biomarker should also be sensitive enough to respond to sub-lethal or environmentally relevant concentrations of the chemical compound/s of concern. Where possible, biomarker selection should be based on the known toxicological mechanism of action of the contaminant, thus maximising the probability of signalling a response. The measured response should be dose or time-dependent so that the magnitude of the exposure
or effect can be verified and measured (Shugart 1993; Mayer et al. 1992). It is also important to understand the kinetics of the biomarker response as this will influence the sampling regime and biomarkers employed for a specific study (Shugart 1993). Not all of these criteria need to be fulfilled for a biomarker to be useful but they will assist in biomarker selection, study planning, implementation and data interpretation.
All biomarkers demonstrate variability. Variability of response can be divided into two categories; those due to endogenous factors such as genetic heterogeneity, diversity of age and size classes and those due to exogenous factors like methodological variability (sample collection and storage, errors in assay analysis and instrumentation, reagent purity), and chemical and environmental
ENDOGENOUS FACTORS
I Species I
Biomarker
Expression
---ITemperature
I
~
EXOGENOUS FACTORS
~
Assayi Methodology
~
~
/:"----~
c::
c.eason Reproductivestage
Xenoblotlcs
Figure 2.1: Factors influencing biomarker responses and possible interactions among factors. (Adapted from Bucheli & Fent 1 H95; Van Der Kraak 1998).
Biomarker technologies can be incorporated into a range of in vitro and in vivo experimental
frameworks depending on the experimental objectives. In vivo experiments can vary according to
the following exposure regimes:
1. Artificial laboratory exposures that control exogenous variation (temperature, light, humidity,
nutritional status) and in some instances endogenous variation (age, sex, genetic stock).
Xenobiotic exposure routes can be environmentally relevant (water bourne exposures, soil
exposures) or they can be non relevant (intraperitoneal injections). In these instances the
chemical is always added to the experimental system.
2. Laboratory controlled conditions where organisms are exposed to environmental matrices
that have been derived from contaminated sites and which contain complex mixtures of
chemicals/effluent (ex situ).
3. In situ contaminated site exposures where organisms are caged or housed (endogenous variation controlled).
4. Field sampling using animals that have been livin~1 at the contaminated site (endogenous
and exogenous variation not controlled).
Despite the wealth of information that laboratory models have yielded through identification and
of chemical mixtures and complex effluents as well as progressing to the more realistic in situ
exposure studies (McBee & Bickham 1990). However, the greater the realism of exposure and ecological relevance the greater the variation in the biomarker responses are likely to be. Logistical effort and financial cost also tend to increase with increasing environmental relevance.
2.3
Biomarkers of the Biotransformation Pathways
The biotransformation pathway represents the process where foreign compounds that are constantly being absorbed by organisms, particularly lipophilic compounds, are converted into products which are readily excreted. The reactions catalysed by xenobiotic-biotransforming enzymes are generally divided into two classes termed Phase I and Phase II reactions (Eaton & Klaassen 1996). Animal studies of the metabolism pathways can provide useful information about the capacity of individuals of different species to metabolise xenobiotics and their susceptibility to these compounds (Stegeman
& Kloepper-Sams 1987). The measurement of detoxifying enzymes in animals as indicators of environmental contamination has both practical and conceptual appeal. Firstly, these enzyme are usually measured in hepatic tissue. Secondly, the constituative levels of these enzymes are high enough to measure. Thirdly, these enzyme systems can be induced by a variety of environmental contaminants and finally, the induction of these enzyme systems by specific environmental contaminants may significantly alter susceptibility to repeated exposure (Lubet et al. 1990a).
2.3.1 Phase I biotransformation reactions
Phase I reactions mostly involve hydrolysis, reduction, and oxidation where a functional group (-OH,
-NH2' -SH, or -COOH) is introduced or exposed on the xenobiotic resulting in a small increase in hydrophilicity. The functional groups exposed by phase I reactions are often the active site for a phase II reaction. Among the Phase I enzymes, the P450 superfamily of enzymes has the greatest catalytic versatility and number of xenobiotics it detoxifies, or activates to reactive intermediates (Parkinson 1996).
2.3.1.1 Cytochrome P450


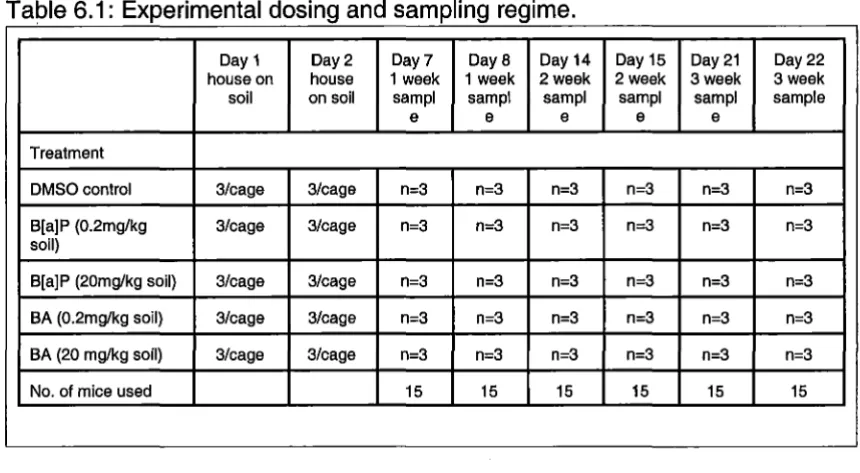
![Figure 6.1: Soil B[a]P and BA concentration (mean +SD) at week 0, following exposure of mice (n=2) to soil spiked B[a]P 1, 2, and 3 or BA](https://thumb-us.123doks.com/thumbv2/123dok_us/9650631.1492897/122.526.53.473.144.688/figure-soil-concentration-mean-week-following-exposure-spiked.webp)
