R E S E A R C H A R T I C L E
Open Access
Impact of caste on the neurodevelopment of
young children from birth to 36 months of age: a
birth cohort study in Chitwan Valley, Nepal
Rajendra Prasad Parajuli
1,2, Takeo Fujiwara
1*, Masahiro Umezaki
2and Chiho Watanabe
2Abstract
Background:Caste, a proxy of socioeconomic position, can influence the neurodevelopment of children through several pathways, including exposure to toxic elements. Studies from developing countries where caste is represented by prevailing caste groups and people are highly exposed to toxic elements can provide useful insights into the mechanisms of neurodevelopmental inequities among children. This study aims to investigate the impact of caste on the neurodevelopment of children from birth to 36 months of age in Chitwan Valley, Nepal, where people are exposed to high levels of arsenic (As) and lead (Pb).
Methods:Participants (N = 94) were mother-infant pairs from the Chitwan district in Nepal. The neurodevelopment of the infants was assessed using the Brazelton Neonatal Behavioral Assessment Scale, Third Edition, (NBAS III) at birth and the Bayley Scales of Infant Development, Second Edition, (BSID II) at ages 6, 24, and 36 months. Caste was categorized based on surname, which, in Nepal generally refers to one of four caste groups. We also measured the concentrations of As and Pb in cord blood.
Results:Caste was positively associated with the state regulation cluster score of the NBAS III at birth after adjustment for covariates (p for trend < 0.01). Adding cord blood As levels attenuated the association (p for trend = 0.12). With regard to neurodevelopment at six months of age, the third-ranked caste group scored higher than the first-ranked caste group on the Mental Development Index (MDI) of the BSID II (coefficient = 3.7; 95% confidence interval (CI) = 1.3 to 6.0). This difference remained significant after adjustment for cord blood As levels and other covariates was made (coefficient = 3.9; 95% CI = 1.2 to 6.7). The remaining clusters of the NBAS III and BSID II at 6, 24, and 36 months were not significantly associated with caste group.
Conclusions:Caste was positively associated with the state regulation cluster score of NBAS III at birth. This association was partially mediated by cord blood As levels. However, the negative impact of caste on
neurodevelopment disappeared as the children grew. Furthermore, an inverse association between caste and MDI at six months of age was observed. Additional studies are needed to elucidate the mechanism of how caste affects neurodevelopment.
Keywords:Nepal, Caste system, Socioeconomic position, Child development, Toxic elements, Essential elements
* Correspondence:fujiwara-tk@ncchd.go.jp 1
Department of Social Medicine, National Research Institute for Child Health and Development, 2-10-1 Okura, Setagaya-ku, 157-8535 Tokyo, Japan Full list of author information is available at the end of the article
Background
Exposure to socioeconomic disadvantage during pregnancy and early childhood impairs neurodevelopment in children [1,2]. Despite evidence indicating that the association be-tween socioeconomic position (SEP) and the neurodeve-lopment of newborns and young children [3-9], the results of epidemiological studies on the association of SEP with later neurodevelopment have been inconsistent [6,7,10].
For example, in the Port Pirie prospective cohort study, Tong et al. [7] reported a 0.8–2.0 unit increment in children’s cognitive scores per ten-unit increment in their SEP scores, while in a Bolivian cohort, Ruiz-Castell et al. [10] could not detect an association between SEP and cognitive development. Such discrepancies may have been caused by differential representation of actual SEP by the assessment indicators used. In the Bolivian cohort, most of the participating families did not have any mem-bers with permanent jobs (rather, they held temporary, short-term jobs); thus, parents’ occupation (which was used as a proxy of SEP) likely did not reflect actual social or economic level. However, although SEP was evaluated by a similar indicator (i.e., parents’ occupation) in the Port Pirie cohort, the fact that they held professional (permanent) occupations may have reflected their actual social or economic level. Other studies have considered family income, education, and occupation as proxies of SEP [6,11-13]. However, the use of these proxies might not exactly represent SEP as such, because each proxy measures a different aspect of SEP [14]. Considering these disadvantages of SEP measurement, caste group might be a good indicator of SEP. To the best of our knowledge, no previous studies have evaluated the effect of caste group on neurodevelopment in young children.
Caste refers to a person’s status within the structure of society. In Nepal, the caste system still forms an important pillar of the social hierarchy [15], even though it was offi-cially abolished by law in 1964 [16]. The Hindu caste structure segregates people into four caste groups on the bases of ritual purity and occupation, namely Brahmin,
Chetri,Vaishya, andShudra. TheBrahmins—who taught, interpreted religious customs and rules, and administered the Hindu religion—were at the top of the hierarchy. They were followed by the Chetri, who were considered the rulers and warriors of society. Next in the hierarchy were the Vaishya, who were farmers and merchants. At the lowest level were the Shudra,who were laborers made to serve those belonging to the upper three castes [17].
We hypothesized that caste group is associated with neurodevelopment in young children through exposure to toxic elements during pregnancy. Toxic elements, such as lead (Pb) or arsenic (As), are harmful to neurodevelop-ment because they can induce oxidative stress and the production of free radicals, resulting in neuronal apoptosis [18,19]. We targeted Chitwan Valley in lowland Nepal
because this district is exposed to high levels of As via high-level As contamination [20]. In addition, Pb exposure is high in this district because the region is situated at the junction between two main highways from Kathmandu and East-West Highway; this location serves as a major artery for a number of vehicles that emit Pb into the en-vironment via leaded gasoline [21]. Further, this district is well recognized as a central immigration target among many caste groups from different parts of the country [22]. Thus, it was hypothesized that the association be-tween neurodevelopment and caste group via exposure to toxic elements would be more visible in the Chitwan dis-trict versus others in Nepal. The objectives of the present study were to investigate the impact of caste on neurode-velopment scores from birth to three years of age, and to investigate whether it is driven by exposure to toxic ele-ments during pregnancy in the Chitwan District.
Methods Study sample
The eligibility criteria to be met for participation in the present study were as follows: living in the Chitwan Valley for at least two years, full term pregnancy (i.e., more than 37 weeks of gestation) at a specified hospital visit, aged 18–40 years, per vaginamdelivery, singleton birth, and no reports of diabetes, hypertension or pre-eclampsia. Two hundred pregnant mothers were approached from September to October 2008 in the Bharatpur General Hospital of the Chitwan district. Among them, 119 were eligible to participate in the study. Eligible mothers were informed of the background and objectives of the study, what they would experience during the study process, the potential benefits they might experience and poten-tial (although unexpected) risks. One hundred women (84%) signed a letter of informed consent and partici-pated. The study protocol was approved by the Ethical Committee of the Graduate School of Medicine at the University of Tokyo (approval no. 2244) and that of the Bharatpur General Hospital, Chitwan, Nepal.
Neurodevelopmental indicators
The third edition of the Brazelton Neonatal Behavioral Assessment Scale (NBAS III) [23] was used to assess neurodevelopment at birth. The NBAS III has frequently been used in the field of neurotoxicology [24,25]. Details regarding NBAS III assessments and research findings from this cohort have been published previously [26]. NBAS III clusters were composed of 7 dimensions: habitu-ation, orienthabitu-ation, motor system, state organizhabitu-ation, state regulation, autonomic stability, and abnormal reflex.
neurotoxicology [28,29]. The BSID II provides three neurodevelopmental clusters: Mental Development Index (MDI), Psychomotor Development Index (PDI), and Behavioral Rating Scale (BRS). The MDI reflects an in-fant’s level of cognitive function, language, and per-sonal and social development. The PDI reflects gross and fine motor function, and the BRS is a record of the examiner’s impression of the infant’s neurobehavioral integrity.
The BSID II test was conducted in the infants’ homes and administered within four weeks of the target age (i.e., at age 6, 24 or 36 months ± one month). The infant’s age in number of days at the time of testing was also recorded. Single rater (RPP) conducted both the NBAS III and BSID II assessment.
Caste groups
During the interview process, the complete name, detailed home address, and mobile or home phone number of the parents was collected to enable the collection of prospect-ive follow-up data. There is no single widely accepted def-inition or classification of each caste group [30]. Thus, we classified participants into the four ancient caste groups according to occupational specialization (i.e., Brahmin
[priest],Chetri[warrior],Vaishya[trader and farmer], and
Shudra [laborer]) [31]. These groupings are widely ac-cepted despite the formal abolition of the caste system. In the present study, the classification was based on the sur-name of the father of the cohort baby (see Table 1 for de-tails). However, in cases of confusing surnames, phone conversations were held with parents to ascertain their caste groups. The rank of the caste group was placed in the following order:Brahmin, Chetri,Vaishya,and Shudra
were ranked first, second, third, and fourth respectively.
Measurements of cord blood toxic elements levels To assess the levels of toxic elements, cord blood was collected from the placenta by midwives following common
aseptic procedures. Cord blood (10 mL) was collected into a trace-metal–free cryovial that contained ethylene diamine tetra-acetic acid (EDTA) as an anticoagulant. Cord blood samples were stored in a standard freezer (-20°C) for less than one month, then kept frozen with dry ice during transport to a laboratory in Tokyo where they were stored in a deep freezer (-78°C) until analyzed. Detailed methods regarding the measurement of cord blood As and Pb levels in this cohort have been published previously [26].
Covariates
The height and weight of mothers were recorded before delivery. Body weight was measured to the nearest 0.1 kg using a portable digital scale (Model BF-046 WH; Tanita, Tokyo, Japan). Height was measured to the nearest 0.1 cm. Body mass index (BMI) was calculated by divid-ing weight (kg) by height squared (m2). The birth weights of the newborns were obtained from hospital records. Height and weight were also taken at 6, 24, and 36 months of age using the same devices and methods.
The following information was collected during hospital face-to-face interviews via a structured questionnaire: mother’s age, mother’s parity, baby’s gender, gestational age, time and date of delivery, mother’s level of educa-tion, annual family income, mother’s smoking status during pregnancy, and mother’s status of alcohol intake during pregnancy. A single rater (RPP) visited the home of each mother-infant pair approximately 6 and 36 months after delivery and evaluated the postnatal home envir-onment on the Home Observation for Measurement of Environment scale (HOME) [32].
Statistical analyses
The distribution of all variables were examined for normal-ity. Cord blood levels of toxic elements and annual family income were log transformed. Associations between caste group and demographics, birth outcomes, and prenatal and postnatal environmental variables were analyzed by linear trend tests.
Using a bivariate model, the individual associations between caste group and each NBAS III cluster score were analyzed. Multivariate analyses were conducted and adjusted for mother’s age [33], parity [29], family in-come [34], mother’s level of education [29,35], mother’s BMI before giving birth [36], gestational age [36] and infant’s age at the time of the NBAS III assessment (Model 1). Further, As levels were adjusted (Model 2). For ages 6, 24, and 36 months, multiple regression models of each BSID II cluster, MDI, PDI, and BRS were adjusted for maternal age, maternal education, log-transformed in-come, parity, maternal BMI, birth weight, concurrent age at BSID assessment, infant weight, and HOME score (Model 1) and log As levels was further adjusted (Model 2). The 6-month-old HOME score was adjusted to create the Table 1 Categorization of caste groups according to
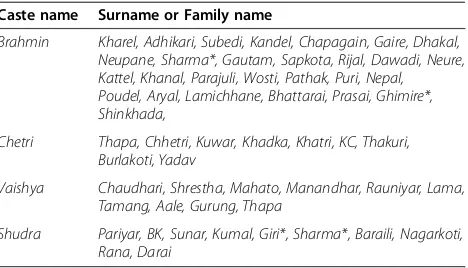
surname
Caste name Surname or Family name
Brahmin Kharel, Adhikari, Subedi, Kandel, Chapagain, Gaire, Dhakal, Neupane, Sharma*, Gautam, Sapkota, Rijal, Dawadi, Neure, Kattel, Khanal, Parajuli, Wosti, Pathak, Puri, Nepal, Poudel, Aryal, Lamichhane, Bhattarai, Prasai, Ghimire*, Shinkhada,
Chetri Thapa, Chhetri, Kuwar, Khadka, Khatri, KC, Thakuri, Burlakoti, Yadav
Vaishya Chaudhari, Shrestha, Mahato, Manandhar, Rauniyar, Lama, Tamang, Aale, Gurung, Thapa
Shudra Pariyar, BK, Sunar, Kumal, Giri*, Sharma*, Baraili, Nagarkoti, Rana, Darai
model for 24-months-old since the 6-month score can represent the home environment for up to three years. Trend tests for neurodevelopment indicators were also performed by caste group. Statistical significance was determined with a criterion level set atp< 0.05. All ana-lyses were performed with a statistical software package (Stata version 11.0).
Results
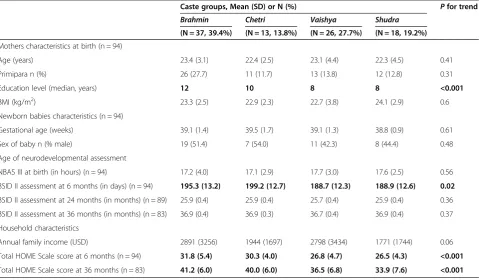
Table 2 summarizes the characteristics of mother-infant pairs at birth and at 6, 24, and 36 months after birth. The maternal, household, and newborn characteristics of this cohort have been published previously [26]. The mothers’level of education showed a linear trend in terms of caste (i.e., more education among higher-ranked caste,
p < 0.001). Infants’ages during the six-month BSID II assessment also varied by caste rank (p= 0.02). Evalu-ation using the BSID II began in areas distant from the Chitwan Valley, where predominantly lower-caste parents reside. Thus, babies’ages at BSID II assessment were lower among lower-caste groups. The HOME scores were con-sistently higher among high-ranked caste groups than low-ranked caste groups at ages 6 and 36 months (p< 0.001).
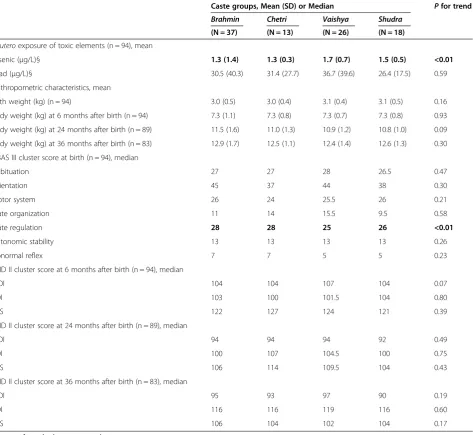
Table 3 summarizes the distribution of cord blood Pb and As levels, and birth outcomes according to caste group at birth and 6, 24, and 36 months after birth. Higher cord blood levels of As were found among lower-ranked
caste groups (p< 0.01), but Pb was not significantly associ-ated with caste (p= 0.59). Birth weight and body weight at ages 6, 24, and 36 months did not differ by caste group. Among the NBAS III clusters, the newborns’regulation of state cluster score (as evaluated by the NBAS III) was more elevated in higher-caste groups (p< 0.01). The remaining clusters of the NBAS III were not associated with caste group. Scores on the BSID II indices (i.e., MDI, PDI, and BRS) did not differ by caste group at ages 6, 24, or 36 months.
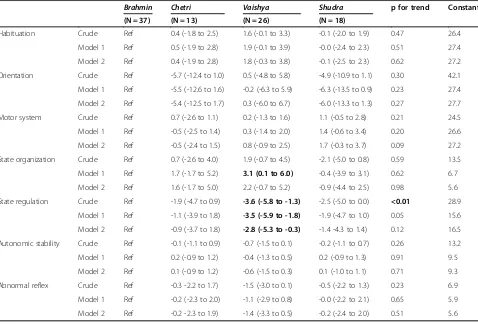
Table 4 shows the coefficients of NBAS III clusters at birth by caste group with reference toBrahmin, the first-ranked caste group. In Model 1—which was adjusted for maternal age and education, log-transformed income, ma-ternal BMI, age at NBAS III assessment, parity, and birth weight—the state regulation cluster score forVaishya(i.e., the third-ranked caste group) was lower than the score for
Brahmin(coefficient =–3.6; 95% CI =–5.8 to–1.3). While attenuated, the association remained significant in Model 2 when including log As as a covariate, (coefficient =–2.8; 95% CI =–5.3 to–0.3). Although the trend was significant in Model 1, it became insignificant in Model 2, suggesting that cord blood As levels mediated the association be-tween caste group and state regulation score at birth. Interestingly, significantly higher scores in the state organization cluster were found among the third-ranked caste group in Model 1, however, the corresponding
Table 2 Characteristics of participants in a birth cohort study: at birth, 6, 24 and 36 months after birth
Caste groups, Mean (SD) or N (%) Pfor trend
Brahmin Chetri Vaishya Shudra
(N = 37, 39.4%) (N = 13, 13.8%) (N = 26, 27.7%) (N = 18, 19.2%)
Mothers characteristics at birth (n = 94)
Age (years) 23.4 (3.1) 22.4 (2.5) 23.1 (4.4) 22.3 (4.5) 0.41
Primipara n (%) 26 (27.7) 11 (11.7) 13 (13.8) 12 (12.8) 0.31
Education level (median, years) 12 10 8 8 <0.001
BMI (kg/m2) 23.3 (2.5) 22.9 (2.3) 22.7 (3.8) 24.1 (2.9) 0.6
Newborn babies characteristics (n = 94)
Gestational age (weeks) 39.1 (1.4) 39.5 (1.7) 39.1 (1.3) 38.8 (0.9) 0.61
Sex of baby n (% male) 19 (51.4) 7 (54.0) 11 (42.3) 8 (44.4) 0.48
Age of neurodevelopmental assessment
NBAS III at birth (in hours) (n = 94) 17.2 (4.0) 17.1 (2.9) 17.7 (3.0) 17.6 (2.5) 0.56
BSID II assessment at 6 months (in days) (n = 94) 195.3 (13.2) 199.2 (12.7) 188.7 (12.3) 188.9 (12.6) 0.02
BSID II assessment at 24 months (in months) (n = 89) 25.9 (0.4) 25.9 (0.4) 25.7 (0.4) 25.9 (0.4) 0.36
BSID II assessment at 36 months (in months) (n = 83) 36.9 (0.4) 36.9 (0.3) 36.7 (0.4) 36.9 (0.4) 0.37
Household characteristics
Annual family income (USD) 2891 (3256) 1944 (1697) 2798 (3434) 1771 (1744) 0.06
Total HOME Scale score at 6 months (n = 94) 31.8 (5.4) 30.3 (4.0) 26.8 (4.7) 26.5 (4.3) <0.001
Total HOME Scale score at 36 months (n = 83) 41.2 (6.0) 40.0 (6.0) 36.5 (6.8) 33.9 (7.6) <0.001
association was not significant in Model 2. The remaining NBAS III cluster scores were not associated with caste group.
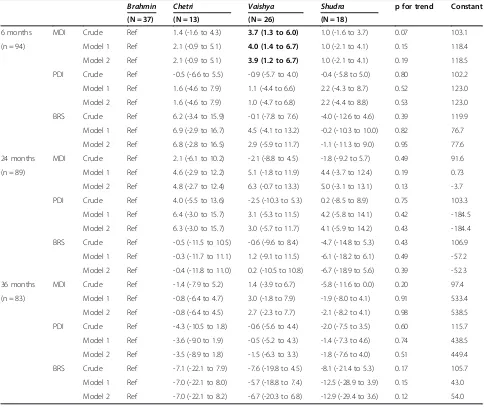
Table 5 shows the coefficients of the BSID II index scores at 6, 24 and 36 months after birth by caste group, again, with reference to Brahmin, the first-ranked caste group. In the crude model, Vaishya (the third-ranked caste group) showed higher MDI scores at six months of age (coefficient = 3.7; 95% CI = 1.3 to 6.0) thanBrahmin. This association remained significant after adjustment for covariates (Model 1, coefficient = 4.0; 95% CI = 1.4 to 6.7) and covariates plus log-transformed As levels
(Model 2, coefficient = 3.9; 95% CI = 1.2 to 6.7). However, the trend in MDI scores by caste at six months of age was not significant (p= 0.15 for Model 1 and p= 0.19 for Model 2). The remaining BSID II cluster scores were not associated with caste group at ages 6, 24, and 36 months.
Discussion
Caste was positively associated with one cluster of neuro-developmental indicators at birth, namely state regulation as measured by the NBAS III. It was not, however, associ-ated with BSID II scores at ages 6, 24, or 36 months, excluding MDI at 6 months. The positive association Table 3 Distribution of birth outcome variables by caste groups in a birth cohort study: at birth, 6, 24 and 36 months after birth
Caste groups, Mean (SD) or Median Pfor trend Brahmin Chetri Vaishya Shudra
(N = 37) (N = 13) (N = 26) (N = 18)
In uteroexposure of toxic elements (n = 94), mean
Arsenic (μg/L)§ 1.3 (1.4) 1.3 (0.3) 1.7 (0.7) 1.5 (0.5) <0.01
Lead (μg/L)§ 30.5 (40.3) 31.4 (27.7) 36.7 (39.6) 26.4 (17.5) 0.59
Anthropometric characteristics, mean
Birth weight (kg) (n = 94) 3.0 (0.5) 3.0 (0.4) 3.1 (0.4) 3.1 (0.5) 0.16
Body weight (kg) at 6 months after birth (n = 94) 7.3 (1.1) 7.3 (0.8) 7.3 (0.7) 7.3 (0.8) 0.93
Body weight (kg) at 24 months after birth (n = 89) 11.5 (1.6) 11.0 (1.3) 10.9 (1.2) 10.8 (1.0) 0.09
Body weight (kg) at 36 months after birth (n = 83) 12.9 (1.7) 12.5 (1.1) 12.4 (1.4) 12.6 (1.3) 0.30
NBAS III cluster score at birth (n = 94), median
Habituation 27 27 28 26.5 0.47
Orientation 45 37 44 38 0.30
Motor system 26 24 25.5 26 0.21
State organization 11 14 15.5 9.5 0.58
State regulation 28 28 25 26 <0.01
Autonomic stability 13 13 13 13 0.26
Abnormal reflex 7 7 5 5 0.23
BSID II cluster score at 6 months after birth (n = 94), median
MDI 104 104 107 104 0.07
PDI 103 100 101.5 104 0.80
BRS 122 127 124 121 0.39
BSID II cluster score at 24 months after birth (n = 89), median
MDI 94 94 94 92 0.49
PDI 100 107 104.5 100 0.75
BRS 106 114 109.5 104 0.43
BSID II cluster score at 36 months after birth (n = 83), median
MDI 95 93 97 90 0.19
PDI 116 116 119 116 0.60
BRS 106 104 102 104 0.17
§Log transformed values were tested. Bold signifies p < 0.05.
between caste group and state regulation at birth was par-tially mediated by cord blood As levels. Interestingly, the third-ranked caste group showed significantly higher MDI scores than the highest-ranked caste group.
To the best of our knowledge, this is the first study that has evaluated the effects of caste on neurodevelop-ment in younger children. In 1964, King Mahendra abol-ished caste system laws, declaring that as a nation Nepal opposed this form of population categorization. However, it is interesting that nearly 50 years after this abolition, the caste groups still show prominent association with neuro-development at birth. Thus, caste-related health disparities might still be prevalent in Nepal.
Similar to earlier studies [3-5,7,8,37-39], newborns in lower caste groups showed less optimal neurodevelop-ment at birth. This trend was partially mediated by cord blood As levels, suggesting that in utero exposure to As could drive the occurrence of lower-state regulation scores among lower-caste groups. The present study also showed that cord blood As levels were harmful to NBAS III state regulation cluster scores among the sample as a whole [26]. We also found that theVaishyacaste group showed
higher cord blood levels of As than the Brahmin caste group. Since people from the Vaishya caste group are traditionally engaged in agricultural and outdoor activities, they may be more likely to be exposed to As.
The BSID II cluster scores did not differ across the caste groups at ages 6, 24, or 36 months. As suggested by Henn and colleagues, attenuation of this effect during the postnatal period may be one reason for this [40]. For example, urinary excretion of most of the As burden from the infant’s body may have occurred since decreased urin-ary As concentrations were also reported during the first four months after birth (80μg/L during the first two days of life to <30μg/L at four months of age) [41]. Hence, the harm induced by cord blood As levels on the neurodeve-lopment of infants might not persist until six months of age. Furthermore, the neuroplasticity of the immature brain may contribute to the attenuated effect of cord blood As over time [42].
Interestingly, infants from the Vaishya caste group achieved higher scores than those from the highest caste (Brahmin) on the MDI index of the BSID II scale at six months of age. Since those categorized asVaishyamembers Table 4 Coefficient and 95% confidence interval of social status or caste group with NBAS III clusters at birth using multivariate regression model (n = 94)
Brahmin Chetri Vaishya Shudra p for trend Constant (N = 37) (N = 13) (N = 26) (N = 18)
Habituation Crude Ref 0.4 (-1.8 to 2.5) 1.6 (-0.1 to 3.3) -0.1 (-2.0 to 1.9) 0.47 26.4
Model 1 Ref 0.5 (-1.9 to 2.8) 1.9 (-0.1 to 3.9) -0.0 (-2.4 to 2.3) 0.51 27.4
Model 2 Ref 0.4 (-1.9 to 2.8) 1.8 (-0.3 to 3.8) -0.1 (-2.5 to 2.3) 0.62 27.2
Orientation Crude Ref -5.7 (-12.4 to 1.0) 0.5 (-4.8 to 5.8) -4.9 (-10.9 to 1.1) 0.30 42.1
Model 1 Ref -5.5 (-12.6 to 1.6) -0.2 (-6.3 to 5.9) -6.3 (-13.5 to 0.9) 0.23 27.4
Model 2 Ref -5.4 (-12.5 to 1.7) 0.3 (-6.0 to 6.7) -6.0 (-13.3 to 1.3) 0.27 27.7
Motor system Crude Ref 0.7 (-2.6 to 1.1) 0.2 (-1.3 to 1.6) 1.1 (-0.5 to 2.8) 0.21 24.5
Model 1 Ref -0.5 (-2.5 to 1.4) 0.3 (-1.4 to 2.0) 1.4 (-0.6 to 3.4) 0.20 26.6
Model 2 Ref -0.5 (-2.4 to 1.5) 0.8 (-0.9 to 2.5) 1.7 (-0.3 to 3.7) 0.09 27.2
State organization Crude Ref 0.7 (-2.6 to 4.0) 1.9 (-0.7 to 4.5) -2.1 (-5.0 to 0.8) 0.59 13.5
Model 1 Ref 1.7 (-1.7 to 5.2) 3.1 (0.1 to 6.0) -0.4 (-3.9 to 3.1) 0.62 6.7
Model 2 Ref 1.6 (-1.7 to 5.0) 2.2 (-0.7 to 5.2) -0.9 (-4.4 to 2.5) 0.98 5.6
State regulation Crude Ref -1.9 (-4.7 to 0.9) -3.6 (-5.8 to -1.3) -2.5 (-5.0 to 0.0) <0.01 28.9
Model 1 Ref -1.1 (-3.9 to 1.8) -3.5 (-5.9 to -1.8) -1.9 (-4.7 to 1.0) 0.05 15.6
Model 2 Ref -0.9 (-3.7 to 1.8) -2.8 (-5.3 to -0.3) -1.4 -4.3 to 1.4) 0.12 16.5
Autonomic stability Crude Ref -0.1 (-1.1 to 0.9) -0.7 (-1.5 to 0.1) -0.2 (-1.1 to 0.7) 0.26 13.2
Model 1 Ref 0.2 (-0.9 to 1.2) -0.4 (-1.3 to 0.5) 0.2 (-0.9 to 1.3) 0.91 9.5
Model 2 Ref 0.1 (-0.9 to 1.2) -0.6 (-1.5 to 0.3) 0.1 (-1.0 to 1.1) 0.71 9.3
Abnormal reflex Crude Ref -0.3 -2.2 to 1.7) -1.5 (-3.0 to 0.1) -0.5 (-2.2 to 1.3) 0.23 6.9
Model 1 Ref -0.2 (-2.3 to 2.0) -1.1 (-2.9 to 0.8) -0.0 (-2.2 to 2.1) 0.65 5.9
Model 2 Ref -0.2 -2.3 to 1.9) -1.4 (-3.3 to 0.5) -0.2 (-2.4 to 2.0) 0.51 5.6
Bold signifies p < 0.05.
are merchants and agricultural workers, their infants may benefit from an environmentally enriched setting due to community visits to their houses and shops. Such an atmosphere might induce a level of neural stimulation etiologically relevant to neurodevelopment and learning, ultimately evident as higher MDI scores at six months of age. Alternatively, the higher MDI scores at six months of
age among Vaishya members might be due to chance
since we made 10 comparisons (7 from NBAS III and 3 from BSID II) that revealed a negative association between cord blood As levels and the NBAS III state regulation cluster. This negative association may be plausible because it was measured close to the time of birth.
The current study has some limitations, which should be considered. First, the small sample size and hospital-based sampling technique limit the generalizability of the findings. As such, associations alternative to those pre-sented here may have been missed due to this lack of stat-istical power. Second, the classification of caste groups was based on family names. Although we can categorize caste precisely forBrahmin andChetri,similar surnames and controversial classifications between Vaishya and
Shudra might have caused occasional misclassification of caste groups. Third, postnatal As and Pb exposure was not measured, including levels in breast milk, drinking water, or other foods digested during the study period. Table 5 Coefficients of caste group on MDI, PDI and BRS scores of BSID II at 6, 24, and 36 months using multivariate regression model
Brahmin Chetri Vaishya Shudra p for trend Constant (N = 37) (N = 13) (N = 26) (N = 18)
6 months MDI Crude Ref 1.4 (-1.6 to 4.3) 3.7 (1.3 to 6.0) 1.0 (-1.6 to 3.7) 0.07 103.1
(n = 94) Model 1 Ref 2.1 (-0.9 to 5.1) 4.0 (1.4 to 6.7) 1.0 (-2.1 to 4.1) 0.15 118.4
Model 2 Ref 2.1 (-0.9 to 5.1) 3.9 (1.2 to 6.7) 1.0 (-2.1 to 4.1) 0.19 118.5
PDI Crude Ref -0.5 (-6.6 to 5.5) -0.9 (-5.7 to 4.0) -0.4 (-5.8 to 5.0) 0.80 102.2
Model 1 Ref 1.6 (-4.6 to 7.9) 1.1 (-4.4 to 6.6) 2.2 (-4.3 to 8.7) 0.52 123.0
Model 2 Ref 1.6 (-4.6 to 7.9) 1.0 (-4.7 to 6.8) 2.2 (-4.4 to 8.8) 0.53 123.0
BRS Crude Ref 6.2 (-3.4 to 15.9) -0.1 (-7.8 to 7.6) -4.0 (-12.6 to 4.6) 0.39 119.9
Model 1 Ref 6.9 (-2.9 to 16.7) 4.5 (-4.1 to 13.2) -0.2 (-10.3 to 10.0) 0.82 76.7
Model 2 Ref 6.8 (-2.8 to 16.5) 2.9 (-5.9 to 11.7) -1.1 (-11.3 to 9.0) 0.95 77.6
24 months MDI Crude Ref 2.1 (-6.1 to 10.2) -2.1 (-8.8 to 4.5) -1.8 (-9.2 to 5.7) 0.49 91.6
(n = 89) Model 1 Ref 4.6 (-2.9 to 12.2) 5.1 (-1.8 to 11.9) 4.4 (-3.7 to 12.4) 0.19 0.73
Model 2 Ref 4.8 (-2.7 to 12.4) 6.3 (-0.7 to 13.3) 5.0 (-3.1 to 13.1) 0.13 -3.7
PDI Crude Ref 4.0 (-5.5 to 13.6) -2.5 (-10.3 to 5.3) 0.2 (-8.5 to 8.9) 0.75 103.3
Model 1 Ref 6.4 (-3.0 to 15.7) 3.1 (-5.3 to 11.5) 4.2 (-5.8 to 14.1) 0.42 -184.5
Model 2 Ref 6.3 (-3.0 to 15.7) 3.0 (-5.7 to 11.7) 4.1 (-5.9 to 14.2) 0.43 -184.4
BRS Crude Ref -0.5 (-11.5 to 10.5) -0.6 (-9.6 to 8.4) -4.7 (-14.8 to 5.3) 0.43 106.9
Model 1 Ref -0.3 (-11.7 to 11.1) 1.2 (-9.1 to 11.5) -6.1 (-18.2 to 6.1) 0.49 -57.2
Model 2 Ref -0.4 (-11.8 to 11.0) 0.2 (-10.5 to 10.8) -6.7 (-18.9 to 5.6) 0.39 -52.3
36 months MDI Crude Ref -1.4 (-7.9 to 5.2) 1.4 (-3.9 to 6.7) -5.8 (-11.6 to 0.0) 0.20 97.4
(n = 83) Model 1 Ref -0.8 (-6.4 to 4.7) 3.0 (-1.8 to 7.9) -1.9 (-8.0 to 4.1) 0.91 533.4
Model 2 Ref -0.8 (-6.4 to 4.5) 2.7 (-2.3 to 7.7) -2.1 (-8.2 to 4.1) 0.98 538.5
PDI Crude Ref -4.3 (-10.5 to 1.8) -0.6 (-5.6 to 4.4) -2.0 (-7.5 to 3.5) 0.60 115.7
Model 1 Ref -3.6 (-9.0 to 1.9) -0.5 (-5.2 to 4.3) -1.4 (-7.3 to 4.6) 0.74 438.5
Model 2 Ref -3.5 (-8.9 to 1.8) -1.5 (-6.3 to 3.3) -1.8 (-7.6 to 4.0) 0.51 449.4
BRS Crude Ref -7.1 (-22.1 to 7.9) -7.6 (-19.8 to 4.5) -8.1 (-21.4 to 5.3) 0.17 105.7
Model 1 Ref -7.0 (-22.1 to 8.0) -5.7 (-18.8 to 7.4) -12.5 (-28.9 to 3.9) 0.15 43.0
Model 2 Ref -7.0 (-22.1 to 8.2) -6.7 (-20.3 to 6.8) -12.9 (-29.4 to 3.6) 0.12 54.0
Bold signifies p < 0.05.
MDI: mental development index, PDI: psychomotor development index, BRS: behavioral rating scale.
Fourth, we did not assess breastfeeding status, although previous studies in Nepal reported that ever-breastfed rate was more than 99% regardless of SEP [43,44]. Fifth, additional confounds, such as history of asphyxia at birth, iodine status, and significant illness in early infancy, were not measured. Sixth, the Nepali translated version of the BSID II was not standardized in Nepal; thus, the findings in this study may not be generalizable to this specific region. Overall, this study has a number of strengths. The sample is the first longitudinal birth cohort from Nepal about which considerable information was collected re-garding cord blood levels of toxic elements and potential confounds. Moreover, the NBAS III and BSID II were ad-ministered by a single investigator within the participants’ homes, increasing inter-rater reliability and diminishing underperformance effects by infants attributable to being assessed in an unfamiliar environment.
Collectively, these findings indicate that health educa-tion and awareness should be developed and implemented by local governmental health institutions among lower-ranked caste groups, especially amongVaishyamembers, in order to educate them with regard to the detrimental effects of As exposure on neurodevelopment.
Conclusions
Using a birth cohort study in Chitwan Valley, Nepal, re-vealed that caste was positively associated with NBAS III state regulation scores at birth, possibly mediated by cord blood As levels. Contrarily, BSID II scores at ages 6, 24, and 36 months were not associated with caste group. Finally, an inverse association between caste and MDI at six months was also observed. Further studies are needed to replicate the associations documented herein between caste and neurodevelopment at birth and their mediation by cord blood As levels. Most importantly, health policy recommendations should include measures to reduce exposure to As in Chitwan Valley, Nepal, espe-cially among lower-ranked caste groups.
Abbreviations
SEP:Socioeconomic position; Pb: Lead; As: Arsenic; EDTA: Ethylene diamine tetra-acetic acid; BMI: Body mass index; NBAS III: Neonatal behavioral assessment scale, third edition; BSID-II: Bayley scales of infant development, second edition; MDI: Mental development index; PDI: Psychomotor development index; BRS: Behavioral rating scale; HOME: Home observation for measurement of environment.
Competing interests
We hereby disclose that the authors have no conflicts of interest, financial or otherwise.
Authors’contributions
RPP collected, analyzed, and interpreted the data and wrote the first draft; TF conceived study hypothesis, interpreted data, and finalized the manuscript; and MU and CW critically revised the manuscript. All authors read and approved the final manuscript.
Acknowledgments
This study was funded in part by a Grant-in-Aid for Scientific Research by the Ministry of Education, Culture, Sports, Science and Technology and the Japan Society for the Promotion of Science (KAKENHI project no: 30292725) and a Grant-in-aid for Scientific Research on Innovative Areas, Ministry of Education, Culture, Sports, Science and Technology KAKENHI (21119003).
Special thanks to all the participants, especially the mothers, who
participated in the study. We express our gratitude to Dr. Keshav Raj Bhurtel, Dr. Hana Furusawa, and Mr. Ping Ser Han for their support during this research.
Author details
1Department of Social Medicine, National Research Institute for Child Health and Development, 2-10-1 Okura, Setagaya-ku, 157-8535 Tokyo, Japan. 2Department of Human Ecology, Graduate School of Medicine, University of Tokyo, 7-3-1 Hongo, Bunkyo–ku, 113-0033 Tokyo, Japan.
Received: 1 April 2013 Accepted: 13 February 2014 Published: 27 February 2014
References
1. Ekeus C, Lindstrom K, Lindblad F, Rasmussen F, Hjern A:Preterm birth, social disadvantage, and cognitive competence in Swedish 18- to 19-year-old men.Pediatrics2010,125(1):e67–e73.
2. Rauh VA, Whyatt RM, Garfinkel R, Andrews H, Hoepner L, Reyes A, Diaz D, Camann D, Perera FP:Developmental effects of exposure to
environmental tobacco smoke and material hardship among inner-city children.Neurotoxicol Teratol2004,26(3):373–385.
3. Bellinger DC:Lead neurotoxicity and socioeconomic status: conceptual and analytical issues.Neurotoxicology2008,29(5):828–832.
4. Nulman I, Sgro M, Barrera M, Chitayat D, Cairney J, Koren G:Long-term neurodevelopment of children exposed in utero to ciclosporin after maternal renal transplant.Paediatr Drugs2010,12(2):113–122. 5. Charkaluk ML, Truffert P, Fily A, Ancel PY, Pierrat V:Neurodevelopment of
children born very preterm and free of severe disabilities: the Nord-Pas de Calais Epipage cohort study.Acta Paediatr2010,99(5):684–689. 6. Vrijheid M, Martinez D, Aguilera I, Bustamante M, Ballester F, Estarlich M,
Fernandez-Somoano A, Guxens M, Lertxundi N, Martinez MD, Tardon A, Sunyer J:INMA Project: Indoor air pollution from gas cooking and infant neurodevelopment.Epidemiology2012,23(1):23–32.
7. Tong S, Baghurst P, Vimpani G, McMichael A:Socioeconomic position, maternal IQ, home environment, and cognitive development.J Pediatr 2007,151(3):284–288. 288 e281.
8. Lovasi GS, Quinn JW, Rauh VA, Perera FP, Andrews HF, Garfinkel R, Hoepner L, Whyatt R, Rundle A:Chlorpyrifos exposure and urban residential environment characteristics as determinants of early childhood neurodevelopment.Am J Public Health2011,101(1):63–70.
9. Drews-Botsch C, Schieve LA, Kable J, Coles C:Socioeconomic differences and the impact of being small for gestational age on neurodevelopment among preschool-aged children.Rev Environ Health2011,26(3):221–229. 10. Ruiz-Castell M, Paco P, Barbieri FL, Duprey JL, Forns J, Carsin AE, Freydier R,
Casiot C, Sunyer J, Gardon J:Child neurodevelopment in a Bolivian mining city.Environ Res2012,112:147–154.
11. Alton GY, Robertson CMT, Sauve R, Divekar A, Nettel-Aguirre A, Selzer S, Joffe AR, Rebeyka IM, Ross DB, Western Canadian Complex Pediatric Therapies Project Follow-Up Group:Early childhood health, growth, and neurodevelopmental outcomes after complete repair of total anomalous pulmonary venous connection at 6 weeks or younger.J Thorac Cardiovasc Surg2007,133(4):905–911.
12. Shonkoff JP, Boyce WT, McEwen BS:Neuroscience, molecular biology, and the childhood roots of health disparities: building a new framework for health promotion and disease prevention.JAMA2009,301(21):2252–2259. 13. Youngstrom E, LaKind JS, Kenworthy L, Lipkin PH, Goodman M, Squibb K,
Mattison DR, Anthony BJ, Anthony LG:Advancing the selection of neurodevelopmental measures in epidemiological studies of environmental chemical exposure and health effects.Int J Environ Res Public Health2010,7(1):229–268.
14. Lynch J, Kaplan G:Social Epidemiology.New York: Oxford University Press; 2000.
16. United Nations High Commissioner for Human Rights:CORE DOCUMENT FORMING PART OF THE REPORTS OF STATES PARTIES, NEPAL.New York: United Nation; 1994.
17. Rameshor D:Administrative Culture in Nepal: Does it Reflect the Dominant Socio-cultural Values of Nepal?.Bergen, Norway: University of Bergen; 2005. 18. Chetty CS, Vemuri MC, Reddy GR, Suresh C:Protective effect of
17-beta-estradiol in human neurocellular models of lead exposure. Neurotoxicology2007,28(2):396–401.
19. Yen CC, Ho TJ, Wu CC, Chang CF, Su CC, Chen YW, Jinn TR, Lu TH, Cheng PW, Su YC, Liu SH, Huang CF:Inorganic arsenic causes cell apoptosis in mouse cerebrum through an oxidative stress-regulated signaling pathway.Arch toxicol2011,85(6):565–575.
20. Pokhrel D, Bhandari BS, Viraraghavan T:Arsenic contamination of groundwater in the Terai region of Nepal: an overview of health concerns and treatment options.Environ Int2009,35(1):157–161. 21. Shrestha HD:Heavy metals pollution in the environment of Kathmandu.
Les Ulis, France: EDP sciences; 2003.
22. Bohra P, Massey DS:Processes of Internal and International Migration from Chitwan, Nepal.Int Migr Rev2009,43(3):621–651.
23. Brazelton T, Nugent JK:Neonatal behavioral assessment scale.3rd edition. London: Mac Keith Press; 1995.
24. Engel SM, Berkowitz GS, Barr DB, Teitelbaum SL, Siskind J, Meisel SJ, Wetmur JG, Wolff MS:Prenatal organophosphate metabolite and organochlorine levels and performance on the Brazelton Neonatal Behavioral Assessment Scale in a multiethnic pregnancy cohort.Am J Epidemiol 2007,165(12):1397–1404.
25. Sagiv SK, Nugent JK, Brazelton TB, Choi AL, Tolbert PE, Altshul LM, Korrick SA:Prenatal organochlorine exposure and measures of behavior in infancy using the Neonatal Behavioral Assessment Scale (NBAS). Environ Health Perspect2008,116(5):666–673.
26. Parajuli RP, Fujiwara T, Umezaki M, Watanabe C:Association of cord blood levels of lead, arsenic, and zinc with neurodevelopmental indicators in newborns: a birth cohort study in Chitwan Valley, Nepal.Environ Res 2013,121:45–51.
27. Bayley N:Bayley Scales of Infant Development (2nd ed.).San Antonio, TX: Psychological Corporation; 1993.
28. Torres-Sanchez L, Schnaas L, Cebrian ME, Hernandez Mdel C, Valencia EO, Garcia Hernandez RM, Lopez-Carrillo L:Prenatal dichlorodiphenyldichloroethylene (DDE) exposure and neurodevelopment: a follow-up from 12 to 30 months of age.Neurotoxicology2009,30(6):1162–1165.
29. Jedrychowski W, Perera FP, Jankowski J, Maugeri U, Mrozek-Budzyn D, Mroz E, Flak E, Skarupa A, Edwards S, Lisowska-Miszczyk I:Early wheezing phenotypes and cognitive development of 3-yr-olds. Community-recruited birth cohort study.Pediatr Allergy Immunol2010,21(3):550–556. 30. Shrestha NR:Country Studies: Nepal [The Caste System Section in Chapter 2 -Nepal: The Society and Its Environment].Washington DC: Library of Congress; 1991.
31. Subedi M:Caste System: Theories and Practices in Nepal.Himalayan J Sociol Anthropol2011,4:134–159.
32. Caldwell BM, Bradley RH:Home Observation for Measurement of the Environment.Little, Rock: University of Arkansas; 1984.
33. Tian LL, Zhao YC, Wang XC, Gu JL, Sun ZJ, Zhang YL, Wang JX:Effects of gestational cadmium exposure on pregnancy outcome and development in the offspring at age 4.5 years.Biol Trace Elem Res2009,
132(1-3):51–59.
34. Black MM, Hess CR, Berenson-Howard J:Toddlers from low-income families have below normal mental, motor, and behavior scores on the revised Bayley scales.J Appl Dev Psychol2000,21(6):655–666.
35. Janssen AJ, der Sanden MW N-v, Akkermans RP, Oostendorp RA, Kollee LA:
Influence of behaviour and risk factors on motor performance in preterm infants at age 2 to 3 years.Dev Med Child Neurol2008,
50(12):926–931.
36. Tofail F, Vahter M, Hamadani JD, Nermell B, Huda SN, Yunus M, Rahman M, Grantham-McGregor SM:Effect of arsenic exposure during pregnancy on infant development at 7 months in rural Matlab, Bangladesh.Environ Health Perspect2009,117(2):288–293.
37. Wehby GL, Prater K, McCarthy AM, Castilla EE, Murray JC:The impact of maternal smoking during pregnancy on early child neurodevelopment. J Hum Cap2011,5(2):207–254.
38. Julvez J, Fortuny J, Mendez M, Torrent M, Ribas-Fito N, Sunyer J:Maternal use of folic acid supplements during pregnancy and four-year-old
neurodevelopment in a population-based birth cohort.Paediatr Perinat Epidemiol2009,23(3):199–206.
39. Walch E, Chaudhary T, Herold B, Obladen M:Parental bilingualism is associated with slower cognitive development in very low birth weight infants.Early Hum Dev2009,85(7):449–454.
40. Claus Henn B, Schnaas L, Ettinger AS, Schwartz J, Lamadrid-Figueroa H, Hernández-Avila M, Amarasiriwardena C, Hu H, Bellinger DC, Wright RO, Téllez-Rojo MM:Associations of early childhood manganese and lead coexposure with neurodevelopment.Environ Health Perspect2012,
120(1):126–131.
41. Concha G, Vogler G, Nermell B, Vahter M:Low-level arsenic excretion in breast milk of native Andean women exposed to high levels of arsenic in the drinking water.Int Arch Occup Environ Health1998,71(1):42–46. 42. Bulas D, Glass P:Neonatal ECMO: neuroimaging and neurodevelopmental
outcome.Semin Perinatol2005,29(1):58–65.
43. Panday S, Tiwari K, Serarath U, Agho KE, Dibley MJ, South Asia Infant Feeding Research Network (SAIFRN):Determinants of infant and young child feeding practices in Nepal: secondary data analysis of
demographic and health survey 2006.Food Nutr Bull2010,31(2):334–351. 44. Ulak M, Chandyo RK, Mellander L, Shrestha PS, Strand TA:Infant feeding
practices in Bhaktapur, Nepal: a cross-sectional, health facility based survey.Int Breastfeed J2012,7(1):1.
doi:10.1186/1471-2431-14-56
Cite this article as:Parajuliet al.:Impact of caste on the
neurodevelopment of young children from birth to 36 months of age: a birth cohort study in Chitwan Valley, Nepal.BMC Pediatrics201414:56.
Submit your next manuscript to BioMed Central and take full advantage of:
• Convenient online submission
• Thorough peer review
• No space constraints or color figure charges
• Immediate publication on acceptance
• Inclusion in PubMed, CAS, Scopus and Google Scholar
• Research which is freely available for redistribution