Cosurim: A program for automated
computation of composition of core, rim
and surface of protein data bank files and
its applications
PARTH SARTHI SEN GUPTA¥1+
1Department of Biotechnology, The University of Burdwan, Golapbag, Burdwan, West Bengal-713104, India
RIFAT NAWAZ UL ISLAM¥2+
2Department of Zoology, The University of Burdwan, Golapbag, Burdwan, West Bengal-713104, India
SABA YASMEEN3
3Department of Botany and Microbiology, Acharya Nagarjuna University, Nagarjuna Nagar, Guntur, Andhra Pradesh-522510, India
SAHINI BANERJEE4
4Department of Biotechnology, Institute of Genetic Engineering, Kolkata, West Bengal-700128, India
Dr. AMAL K BANDYOPADHYAY1*
1Department of Biotechnology, The University of Burdwan, Golapbag, Burdwan, West Bengal-713104, India [email protected]
Abstract: Primary structure of protein is composed of polar and non-polar amino acids, whose distributions pattern along the sequence is not well understood. However, when this extended form of the sequence is kept in aqueous solution, the non-polar constituents form the compact hydrophobic core, keeping the polar residues in the contact of bulk water in the surface of the protein that eventually takes a globular shape. This hydrophobic collapse is an entropy driven and spontaneous process. While residues in the surface are stabilized by hydrogen bonding with bulk water, the core residues are largely stabilized by Van der Waals interactions. It seems, the process of compact core formation is apparently not unique in that the core of the protein may contain isolated charged and or polar side chains and the surface may harbour hydrophobic patches. Further, between the core and the surface, there may exist a rim region, whose composition is yet to be verified. The fact that manual determination of compositions involving a large dataset of x-ray structures would be highly labour intensive, time consuming and error prone, automation in these aspects would be very useful. In this end, our software, Cosurim (available at https://sourceforge.net/projects/cosurim/) is capable of determination of composition in core-surface or core-rim-surface format, for any number of protein structures with any number of chains in them. Analyses involving orthologous proteins that are adapted under diverse environmental conditions show that although core has strong preference for bulky hydrophobic residues, polar and charged residues are also present. Same is true for surface region. Interestingly, analysis of RNase H1 using core-rim-surface mode of the program show the rim has the lowest content of all classes, indicated discontinuity between the core and the surface. Taken together, Cosurim is a fully automated program for analysis of a single or a database of protein structures for absolute and normalized compositions of core, rim and surface and find applications in structural biology and bioinformatics.
Keywords: Core; Surface; Rim; Composition; Automated; Program
1. Introduction
bonding among themselves, which were otherwise hydrogen bonded with water in its extended conformation of primary structure. This phenomenon induces the formation of secondary structure in the core [5]. The residues compositions and their distribution along the sequence, play crucial role in the compactness, stability, communication among surface residues and volume of the core. Core or surface of protein may not be absolutely composed by hydrophobic or hydrophilic residues respectively. Apart from the non-polar residues, there may exist certain level of polar and charged residues in the core, whose composition needed to be verified for orthologous proteins functioning under diverse environmental conditions. The polar composition of a typical core of globular protein may vary greatly in cases, where protein sequence is dominated by more of hydrophilic than hydrophobic residues. Such proteins are found under the halophilic situations, wherein the cytoplasm of the organism harbour saturated saline solution [6]. Similarly, in the surface, hydrophobic patches and hydrophobic part are known to exist [7]. In the orthologous situation, how these residues and their classes compositions, in the core and surface, would vary, need detailed investigation. For a given protein, the core and surface residues can be computed using procedures that implement Richard and Lee analytical procedure [8, 9, 10]. Relative accessibility is computed, which then categories based on the relative accessibility value. If the accessibility is less than 20, it is broadly considered as core residue, otherwise as surface [11]. However, if a moderately large database is intended to be processed, manual procedure will be very time consuming and error prone. Further, core and surface may not be attached to each other directly but may have separation by a region identified as rim. Little is known about the composition of such a rim region. Similarly, computation of statistical comparison of core and surface for orthologous protein structures are rarely done. The paucity of such investigations may have stemmed from the fact that fully automated procedure that is capable of analyzing a large database of crystal structures is truly lacking.
In this work, we present a fully automated procedure that can analyze a large database of crystal structures with variable number of chains in them, for the results of absolute and normalized compositions of the core, surface and rim of any number of x-ray structures with any number of chains in them. The study also highlights, results of analysis on functionally identical proteins for the core, rim and the surface and their possible implication.
2. Methodology
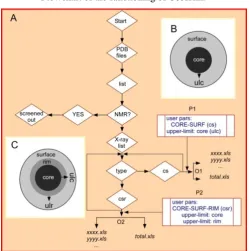
A detailed flow-chart of the functioning of the program, Cosurim, is presented in Fig. 1. Upon start of the program, it looks for Protein Data Bank (PDB) files in the present directory. If PDB(s) are present, it makes a list and then checks if they were of NMR type. If “yes”, the program screens them out. Before analyzing remaining x-ray files, it looks for user parameters: cs or csr, for the determination of the mode of analysis. Size of different regions (core and surface for cs mode; core, rim and surface for csr mode) are adjusted by the user parameters like ulc for the former mode and ulc and ulr for the latter mode respectively. After completion of the analysis for a PDB file for all its chains, results are redirected in per-structure-basis file, which is named by the first four letters of the PDB file with an extension of “.xls”. all-structures-basis output is written in “total.xls” file, which gets one entry at the end of the analysis of a PDB file. Once a PDB is completed, the program loops up for the next PDB and so on. This process is completed, when all PDBs in the directory are exhausted. As far as modes of the program are concerned, it runs in two different modes: first mode is activated by the user parameter: cs (Fig. 1, P1), where the protein structure is divided into two parts: the core and the surface (Fig. 1B), the size of which is dependent on the user parameter: ulc (i.e. upper-limit of core, Fig. 1B). Two types of excel outputs are redirected in this case: first is per-structure-basis and the second is all-structures-basis (Fig. 1, O1). In both the cases, the composition of the core and the surface are present. In the former type of output, residue and class specific, absolute and normalized compositions are presented, whereas only class specific normalized output is available in the latter type of output. While the first type is useful for detailed per-structure based analysis, the second type is helpful for statistical analysis that involves all structures in the post run scenario.
Flowchart of the functioning of Cosurim.
Figure.1. Upon start of the program, it screens out NMR files if present in the working directory followed by making a list of X-ray structure files. Now, the program looks for user parameter: cs or csr, to determine the type of mode. While program divides the PDB structure, into two regions using the parameter: cs (B), three regions are generated by csr parameter (C). User pars (P1 for cs and P2 for csr) are also taken as input to determine the size of core, surface and rim (for csr mode only). At this stage, residues of each PDB file, are differentiated into core, surface and rim (only for csr mode) groups, based on the calculated accessibility and user’s provided cut-off values. Residues in each group are then classified into different physicochemical classes (such as hydrophobic, acidic, basic, polar etc). These residues and classes specific results are redirected in per-structure-based output file, named by the first four letter of the PDB file along with an extension of “.xls” (O1 and O2). The second output is named as “total.xls” (O1 and O2), which contains classes specific results for all PDBs.
ulc: upper limit core; ulr: upper limit rim; cs: type of mode as core & surface; csr: type of mode as core, surface and rim; xxxx.xls: output for the PDB file xxxx.pdb; yyyy.xls: excel output file for PDB yyyy.pdb; pars: parameters;
3. Program Input
Figure.2. The program functions in the CYGWIN 32 bit operating system. It is called from a directory, where all x-ray structure files are present. After the general description, it looks for user parameters such as mode type (cs or csr) and their limits (ulc or ulc and ulr). Proper entries of all parameters allow the program to enter into the analysis phase. Once completed, it returns to the prompt again.
4. Program Output
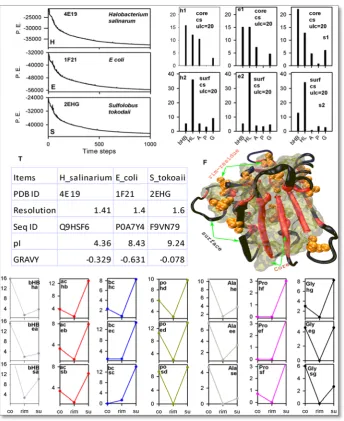
Figure.3. Cosurim extracted results for the crystal structures: 4E19 (halophilic), 1F21 (mesophilic) and 2EHG (thermophilic) from Halobacterium salinarum, E coli and Sulfolobus tokodaii respectively. Analyses are performed on the last frame of energy minimized structures, whose energy profiles are shown in H, E and S for Halobacterium salinarum, E coli and Sulfolobus tokodaii respectively. Details on resolution, sequence ID, pI and GRAVY are presented in table (T) for these structures. Classes compositions, which are obtained by the “cs” mode of the program, for halophilic (h1 & h2), mesophilic (e1 & e2) and thermophilic (s1 & s2) are presented in core (upper panel) and surface (lower panel) format, respectively. Classes (hydrophobic: bHB; acidic: ac; basic: bc; polar: po; Ala; Pro and Gly) compositions for the core (co), rim (rim) and the surface (su) are extracted from 4E19 (Halobacterium salinarum), 1F21 (E coli) and 2EHG (Sulfolobus tokodaii) by the “csr” mode of the program and three plots per class thus obtained for 4E19 (halophilic), 1F21 (mesophilic) and 2EHG (thermophilic) respectively are presented in vertical column manner. Each plot is identified by two letters: first for the genus and the second for the class. For example, ha, hb, hc, hd, he, hf and hg indicate halophilic hydrophobic, halophilic acidic, halophilic basic, halophilic polar, halophilic Ala, halophilic Pro and halophilic Gly respectively. A representative crystal structure (F) showing core, surface and rim distribution of residues and secondary structures.
To check if there exist a rim region, between the interior, the core and the exterior, the surface of protein, we analyzed RNase H1 from these organisms, by the use of the program in csr mode that allows us to introduce a rim region. The upper-limit of the core was kept as earlier (i.e. 20 Å) and the upper-limit of the rim (ulr) was set to 30Å. The core (co), rim and surface (su) content of bHB (Fig. 3ha, 3ea and 3sa), acidic (ac) (Fig. 3hb, 3eb
conditions. The results that are extracted by newly designed mode of Cosurim, shows the possibility of existence of a rim region between the core and the surface. The rim has the lowest content of most of the classes of amino acid residues. This novel observation, which is seen in RNase H1 of halophilic, thermophilic and mesophilic organisms, raise the possibility of discontinuous distribution of residues between the core and the surface region in other proteins also.
To check as to how core, rim and surface regions are occupied by residues and corresponding secondary structures, we have presented Fig. 3F based on the results extracted by Cosurim. Here, following points are noteworthy. First, the core has the highest content of ordered secondary structures. Second, rim residues are partly buried and partly exposed. Finally, the surface has the lower content of ordered secondary structure than core, but it is populated more by coiled structures. This observation also suggest, the hydrophobic collapse that brought polar main-chain in the interior to induce self-bondings among them, which were otherwise hydrogen bonded with bulk water in its fully extended conformation [24, 25, 26].
Taken together, the program Cosurim extracts residues and their classes’ compositions for core, rim (optional) and surface format for all chains of all crystallographic structures present in a directory and thus help individual and statistical analyses, which seems to have potential applications in structural biology and bioinformatics.
5. Conclusion
In this study, we have developed a program, Cosurim, which makes use of analytical software, surface racer to extract residue accessibility and use these values to determine absolute and normalized residues and their class specific compositions of the core and the surface in fully automated manner [8]. It is user friendly, fast and error-free that works for any number of chains and any number of crystallographic structures present in the working directory. The program is so designed that user can easily set the mode of its functioning in that a globular protein can either be divided into core and surface or core, rim and surface mode. A case study demonstrates that both the core and the surface contain hydrophobic and hydrophilic classes of residues, whose proportion not only vary based on the nature of these regions (core and surface by nature contents higher hydrophobic hydrophilic classes respectively) but also vary based on the environment of adaptation. Remarkably, between core and surface, it seems there exists a rim region, which has lower content of all classes of residues than either the core or the surface. Overall, the program, which is capable of extraction of the individual as well as group specific results, seems to have potential applications in structural biology and bioinformatics.
6. Caveats And Future Development
The program is written in AWK programming language which can preferably run in any C shell UNIX prompt in 32-bit CYGWIN environment and also can be made work in B shell LINUX and WINDOWS environment. Presently, we are actively engaged in developing a web interface to integrate Cosurim and other related software tools of our laboratory such as SBION2 and PHYSICO2 such that their availability could reach academic users within a unique web service [15, 16].
Acknowledgement
We thankfully acknowledge the computational facility Laboratory of the Department of Biotechnology, The University of Burdwan.
References
[1] Shestopalov, B. V. (2003). Amino acid code of protein secondary structure. Tsitologiia, 45(7), 702-706.
[2] Rose, G. D.; Fleming, P. J.; Banavar, J. R.; & Maritan, A. (2006). A backbone-based theory of protein folding. Proceedings of the
National Academy of Sciences, 103(45), 16623-16633.
[3] Dill, K. A. (1985). Theory for the folding and stability of globular proteins. Biochemistry, 24(6), 1501-1509.
[4] Eaton, W. A.; Munoz, V.; Hagen, S. J.; Jas, G. S.; Lapidus, L. J.; Henry, E. R.; & Hofrichter, J. (2000). Fast kinetics and mechanisms
in protein folding. Annual review of biophysics and biomolecular structure, 29(1), 327-359.
[5] Jobling, M. F.; Stewart, L. R.; White, A. R.; McLean, C.; Friedhuber, A.; Maher, F.; & Cappai, R. (1999). The Hydrophobic Core
Sequence Modulates the Neurotoxic and Secondary Structure Properties of the Prion Peptide 106‐126. Journal of neurochemistry, 73(4), 1557-1565.
[6] Bandyopadhyay, A. K. (2015). Stability of Halophilic Proteins in Hyper Saline Brine:[2Fe-2S] Ferredoxin as a Paradigm.
Biochemistry and Analytical Biochemistry, 4(3), 1.
[7] Lijnzaad, P. (2007). Hydrophobic patches on protein surfaces (Doctoral dissertation, Utrecht University).
[8] Tsodikov, O. V.; Record, M. T.; & Sergeev, Y. V. (2002). Novel computer program for fast exact calculation of accessible and molecular surface areas and average surface curvature. Journal of computational chemistry, 23(6), 600-609.
[9] Hubbard, S. J.; & Thornton, J. M. (1993). NACCESS Computer Program London. Department of Biochemistry and Molecular
Biology, University College, London, UK.
[10] Lee, B.; & Richards, F. M. (1971). The interpretation of protein structures: estimation of static accessibility. Journal of molecular biology, 55(3), 379IN3-400IN4.
[11] Zhang, H., Zhang, T., Chen, K., Shen, S., Ruan, J., & Kurgan, L. (2009). On the relation between residue flexibility and local solvent
accessibility in proteins. Proteins: Structure, Function, and Bioinformatics, 76(3), 617-636.
[13] Gupta, P. S. S.; Mondal, S.; Mondal, B.; Islam, R. N. U.; Banerjee, S.; & Bandyopadhyay, A. K. (2014). SBION: A program for analyses of salt-bridges from multiple structure files. Bioinformation, 10(3), 164.
[14] Gupta, P. S. S.; Banerjee, S.; Islam, R. N. U.; Mondal, S.; Mondal, B.; & Bandyopadhyay, A. K. (2014). PHYSICO: An UNIX based
Standalone Procedure for Computation of Individual and Group Properties of Protein Sequences. Bioinformation, 10(2), 105.
[15] Gupta, P. S. S.; Nayek, A.; Banerjee, S.; Seth, P.; Das, S.; Sur, V. P.; Roy, C.; & Bandyopadhyay, A. K. (2015). SBION2: Analyses of
Salt Bridges from Multiple Structure Files, Version 2. Bioinformation, 11(1), 39.
[16] Banerjee, S.; Gupta, P. S. S.; Nayek, A.; Das, S.; Sur, V. P.; Seth, P.; Islam R. N. U.; & Bandyopadhyay, A. K. (2015). PHYSICO2: an
UNIX based standalone procedure for computation of physicochemical, window-dependent and substitution based evolutionary properties of protein sequences along with automated block preparation tool, version 2. Bioinformation, 11(7), 366.
[17] Nayek, A.; Gupta, P. S. S.; Banerjee, S.; Sur, V. P.; Seth, P.; Das, S.; Islam R. N. U.; & Bandyopadhyay, A. K. (2015). ADSBET2:
Automated Determination of Salt-Bridge Energy-Terms version 2. Bioinformation, 11(8), 413.
[18] Bandyopadhyay, A. K.; & Sonawat, H. M. (2000). Salt dependent stability and unfolding of [Fe2-S2] ferredoxin of Halobacterium salinarum: spectroscopic investigations. Biophysical journal, 79(1), 501-510.
[19] Bandyopadhyay, A. K.; Krishnamoorthy, G.; & Sonawat, H. M. (2001). Structural stabilization of [2Fe-2S] ferredoxin from
Halobacterium salinarum. Biochemistry, 40(5), 1284-1292.
[20] Bandyopadhyay, A. K.; Krishnamoorthy, G.; Padhy, L. C.; & Sonawat, H. M. (2007). Kinetics of salt-dependent unfolding of [2Fe–
2S] ferredoxin of Halobacterium salinarum. Extremophiles, 11(4), 615-625.
[21] Wrba, A.; Schweiger, A.; Schultes, V.; Jaenicke, R.; & Zavodszky, P. (1990). Extremely thermostable D-glyceraldehyde-3-phosphate
dehydrogenase from the eubacterium Thermotoga maritima. Biochemistry, 29(33), 7584-7592.
[22] Banerjee, S.; Gupta, P. S. S.; & Bandyopadhyay, A. K. (2017). Insight into SNPs and epitopes of E protein of newly emerged genotype-I isolates of JEV from Midnapur, West Bengal, India. BMC immunology, 18(1), 13.
[23] Mondal, S.; Mondal, B.; & Bandyopadhyay, A. K. (2013). Homology modeling of phaseolin from kidney bean (Phaseolus vulgaris
L.): energy minimization and structure analysis. International Journal of Engineering Science and Technology, 5(5), 992.
[24] Bond, C. J.; Wong, K. B.; Clarke, J.; Fersht, A. R.; & Daggett, V. (1997). Characterization of residual structure in the thermally denatured state of barnase by simulation and experiment: description of the folding pathway. Proceedings of the National Academy of Sciences, 94(25), 13409-13413.
[25] Dinner, A. R.; Šali, A.; Smith, L. J.; Dobson, C. M.; & Karplus, M. (2000). Understanding protein folding via free-energy surfaces
from theory and experiment. Trends in biochemical sciences, 25(7), 331-339.
[26] Eaton, W. A.; Munoz, V.; Hagen, S. J.; Jas, G. S.; Lapidus, L. J.; Henry, E. R.; & Hofrichter, J. (2000). Fast kinetics and mechanisms