Journal of Agriculture, Food Systems,
and Community Development
Volume 2, Issue 2
Winter 2011–2012
Published online at www.AgDevJournal.com
New Leaf Associates, Inc.
ISSN 2152-0801 (online only)
Open Call and
Food Systems Planning Papers
100 Mile Foodsheds
for U.S. Cities
Laura Brown, University of Wisconsin Cooperative Extension (USA)*
Kate Clancy, Minnesota Institute for Sustainable Agriculture (USA)
Nevin Cohen, The New School (USA)* David Conner, University of Vermont (USA)* Cornelia Butler Flora, Iowa State University (USA) Julia Freedgood, American Farmland Trust (USA)* Gilbert W. Gillespie, Cornell University (Retired)
(USA)*
R. Bruce Gregory, Farmer, Mitchell Bay Farm & Nursery (USA)*
Shermain Hardesty, University of California (USA)* John Ikerd, University of Missouri, Columbia
(Emeritus) (USA)†
Anupama Joshi, National Farm to School Network/Occidental College (USA)* Larry Lev, Oregon State University (USA) Fred Magdoff, University of Vermont (Emeritus)
(USA)
Ken Meter, Crossroads Resource Center (USA)* † Joseph McIntyre, Ag Innovations Network (USA)* † Rich Pirog, Iowa State University (USA) Ken Robinson, Clemson University (USA)
John Smithers, University of Guelph (Canada) G. W. (Steve) Stevenson, University of
Wisconsin-Madison (USA)
Dawn Thilmany McFadden, Colorado State University (USA)
Mark Winne, Community Food Security Coalition (USA)
Larry Yee, Fairhaven Strategy Group (USA) Rami Zurayk, American University of Beirut
(Lebanon)* † *
Also serve on editorial committee.
† Also write a regular column. Editorial Committee
Paivi Abernethy, University of Waterloo (Canada) Mahbubul Alam, Ehime University (Japan) Sandip Banerjee, Hawassa University (India) Herb Barbolet, Simon Fraser University, Centre for
Sustainable Community Development (Canada) Mary Margaret Barth, Responsible Source, UIUC
(USA)
Ricky Martin Bates, Penn State University (USA) Molly K. Bean, The Ohio State University (USA) Anne C. Bellows, University of Hohenheim (Germany) Rachelle Bostwick, Farmer, Earthkeeper Farm (USA) Rebecca Briggs, Biodynamic Farming and Gardening
Association (USA)
Marcia Caton Campbell, Center for Resilient Cities (USA)
Megan Carney, U.C.–Santa Barbara (USA) Christine C. Caruso, City Univ. of New York (USA) Gina Cavallo Collins, Farmer, Victory Farms, Inc.
(USA)
Sean Connelly, Alberta Social Economy Research Alliance Centre for Sustainable Community Development (Canada)
Hendrik deWilde, The Gabriola Commons (Canada) Michael L. Dougherty, University of Wisconsin–
Madison (USA)
Leslie Duram, Southern Illinois University (USA) Patti Taranto Erickson, Salisbury University (USA) Ayman Ekram Fahim, Suez Canal University (Egypt) Anna Fedman, Univ. of California–Berkeley (USA) Melissa Fernandez Arrigoitia, London School of
Economics (UK)
Rok Fink, Univerza v Ljubljani (Slovenia)
Danielle Nicholas Fisher, Farmer, Eagle Ridge Ranch, Bozeman, MT (USA)
Nancy Franz, Iowa State University College of Human Sciences (USA)
Lynn Fredericks, FamilyCook Productions (USA) Hanna Garth, Univ. of California–Los Angeles (USA) Stephan Goetz, Northeast Regional Center for Rural
Development (USA)
Carol Goland, Ohio Ecological Food and Farm Association (USA)
Sheila L. Gray, Washington State Univ.–Lewis County Extension (USA)
Angela Gordon Glore, AmeriCorps/VISTA (USA) Leslie Hossfeld, University of North Carolina–
Wilmington (USA)
Susanne Howard, Missouri State University (USA) Guiping Hu, Iowa State University (USA) Lauren Hunter, Coop. Extension, Univ. of
Idaho-Blaine County (USA)
Valerie Imbruce, Bennington College (USA) George Irwin, Green Living Technologies (USA) Douglas Jack, Food Producer, Sustainable
Development Corp. (Canada)
Matthew James, Garifuna Seafood Collective (Belize) Hugh Josephs, Tufts University (USA)
Joel Kimmons, Centers for Disease Control and Prevention (USA)
Franz Klingender, Canada Agriculture Museum (Canada)
Jasenka Gajdoš Kljusurić, Prehrambeno Biotehnoloski Fakultet (Croatia)
Fiona Knight, Private food system consulting practice (Canada)
Uma Koirala, Tribhuvan University (Nepal) Jane Kolodinsky, University of Vermont (USA) John D. Lee, Farmer, Allandale Farm, Inc. (USA) Kristi Lekies, The Ohio State University (USA) Dale Levering, LCC International University
(Lithuania)
Charles Levkoe, University of Toronto (Canada) Matt Lobley, University of Exeter (UK) Bohdan Lojka, Czech University of Life Sciences
(Czech Republic)
Uford A. Madden, Florida A&M University (USA) Lisa Markowitz, University of Louisville (USA) Derek Masselink, Masselink Environmental Design
(Canada)
Mike McDonald, Florida Gulf Coast University (USA) Jesse C. McEntee, Cardiff University (UK) Laura McGough, University of Maryland, Baltimore
County (USA)
Jesse C. McEntee, Cardiff University (UK) Bethann G. Merkle, Missoula Urban Demonstration
Project (USA)
Bernadette Montanari, Univ. of Kent, Canterbury (UK) Vicki Morrone, Michigan State University (USA) Heidi Mouillesseaux-Kunzman, Cornell Univ. (USA) Phil Mount, University of Guelph (Canada) Scot Nelson, University of Hawaii at Manoa (USA) Kim L. Niewolny, Virginia Tech (USA) Kimberly Norris, University of Maryland (USA) Lydia Oberholtzer, Penn State University (USA)
Fernando Ona, Indiana University (USA) Aleck Ostry, University of Victoria (Canada) Isidro Ovando-Medina, Center of Biosciences, Univ. of
Chiapas (Mexico)
Tapan B. Pathak, University of Nebraska (USA) Mary Peabody, Northeast Regional Center for Rural
Development (USA)
Francois Pelatan, AMAP Dordogne (France) Jan Perez, University of California–Santa Cruz (USA) Greg Pillar, Queens University of Charlotte (USA) William A. Powers, Nebraska Sustainable Agriculture
Society (USA)
Madeleine Pullman, Portland State University (USA) Md. Masud Parves Rana, Rajshahi University
(Bangladesh)
Taylor Reid, Michigan State University (USA) Kristin A. Reynolds, The New School, New York
(USA)
David Richey, Lane Council of Governments (USA) Antonio Roman-Alcalá, Alemany Farm (USA) Natalie R. Sampson, Univ. of Michigan, School of
Public Health (USA)
Valerie M. Scopaz, VMS Planning Services (USA) Uma i Shankari, Rashtriya Raithu Seva Samithi, a
farmers’ organization (India)
Peggy Smith-Eppig, Maryland Agricultural Education Foundation (USA)
Christopher Sneed, The University of Tennessee Extension–Blount County (USA)
Lois Stanford, New Mexico State University (USA) Garry Stephenson, Oregon State University (USA) Bill Swanson, Valentine Hill Farm (USA)
Diana Vergis Vinh, Public Health Department, Seattle (USA)
Jessy Van Wyk, Cape Peninsula University of Technology (South Africa)
Gerald W. Warmann, South Dakota State Univ. (USA) Sue D. Weant, Partners for Family Farms (USA) E. Christian Wells, University of South Florida (USA) Melissa White Pillsbury, Maine Organic Farmers and
Gardeners Association (USA)
Niki Whitley, North Carolina A&T State Univ. (USA) Mollie Woods, Michigan State University (USA) Jen Wrye, Carleton University (USA)
Steve Young-Burns, PastureLand Cooperative and freelance food writer (USA)
Lorna Zach, University of Wisconsin (USA)
The Journal of Agriculture, Food Systems, and Community Development is published quarterly (Summer, Fall, Winter, Spring) by New Leaf Associates, Inc., ISSN 2152-0801 (online only). Corporate office: 295 Hook Place, Ithaca, NY 14850 USA
Online subscriptions: Farmer/Student/Sole Proprietor/Retiree: US$39; Agency/Nonprofit Staffperson: US$49; Faculty/Consultant/Corporate Employee: US$69; Institutional Library: US$239–US$693 (based on FTE students).
Copyright © 2012 by New Leaf Associates, Inc. All rights reserved. The publisher assumes no responsibility for any statements of fact or opinion expressed in these published papers. No part of this publication may be reproduced, stored, transmitted, or disseminated in any form or by any means without prior written permission from New Leaf Associates, Inc. For permission to reuse material from JAFSCD, please go to www.copyright.com or contact the Copyright Clearance Center, Inc. (CCC), 222 Rosewood Drive, Danvers, MA 01923 USA, +1-978-750-8400. CCC is a not-for-profit organization that provides licenses and registration for a variety of uses.
Journal of Agriculture, Food Systems, and Community Development ISSN: 2152-0801 online
www.AgDevJournal.com
Contents /
Volume 2, Issue 2 / Winter 2011–2012
In This Issue:
A Smörgåsbord of Fresh Applied Research Papers / Duncan Hilchey 1Column
Metrics from the Field: How Do We Grow New Farmers?/ Ken Meter 3
Global Views of Local Food Systems: Bread, Freedom, and Social Justice / Rami Zurayk 7
Open Call
Assessing the Growth Potential and Economic Impact of the U.S. Maple Syrup Industry /
Michael L. Farrell and Brian F. Chabot 11
Kaiser Permanente’s Farmers’ Market Program: Description, Impact, and Lessons Learned / DeAnn Cromp,
Allen Cheadle, Loel Solomon, Preston Maring, Elisa Wong, Kathleen M. Reed 29
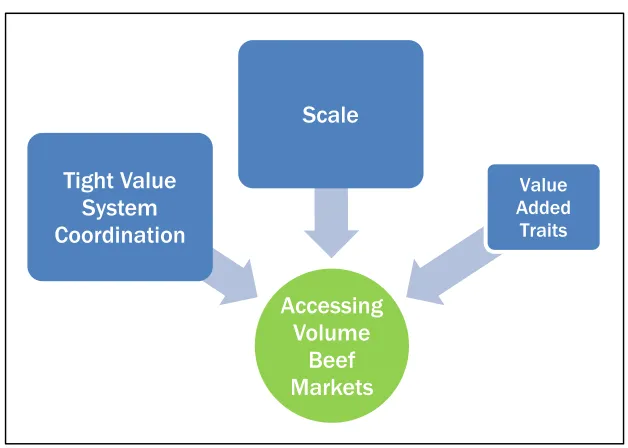
Strategies for Accessing Volume Markets in the Beef Industry: A Review of Three Case Studies / Frank
Montabon / Frank Montabon and Nick McCann 37
From the Ground Up: Assessing Consumer Preferences for Multifunctional Agriculture / Leah Greden
Mathews 51
“Food Security” and “Food Sovereignty”: What Frameworks Are Best Suited for Social Equity in Food
Systems? / Megan Carney 71
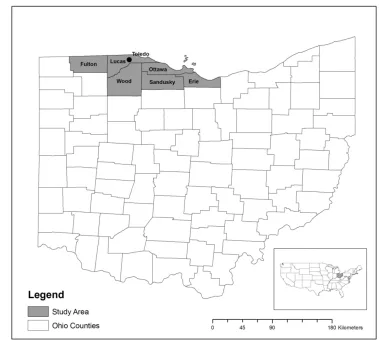
Cultivating Narratives: Cultivating Successors / Thomas L. Steiger, Jeanette Eckert, Jay Gatrell,
Neil Reid, Paula Ross 89
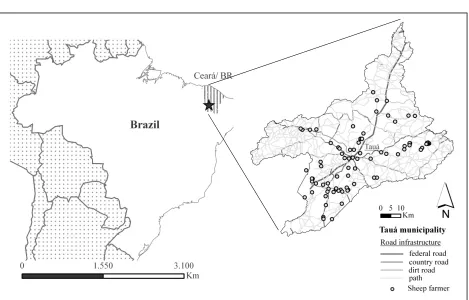
Is a Geographical Certification a Promising Production and Commercialization Strategy for Smallholder Sheep Farming in Ceará, Brazil? / Sarah Schneider, Marianna Siegmund-Schultze, Evandro V. Holanda
Júnior, Francisco S. F. Alves, Anne Valle Zárate 107
Unfolding Farm Practices: Working Toward Sustainable Food Production in the Netherlands and Spain / Paul
Swagemakers, M. Dolores Domínguez García, Xavier Simón Fernández, Johannes S. C. Wiskerke 129
Could Toronto Provide 10% of its Fresh Vegetable Requirements from Within its Own Boundaries? Part II, Policy Supports and Program Design / Rod MacRae, Joe Nasr, James Kuhns, Lauren Baker, Russ Christianson, Martin Danyluk, Abra Snider, Eric Gallant, Penny Kaill-Vinish, Marc Michalak,
Special Topic Follow-Up: Planners Coming to the Table
The Feasibility of Regional Food Systems in Metropolitan Areas: An Investigation of Philadelphia’s
Foodshed / Peleg Kremer and Yda Schreuder 171
Welcoming Animals Back to the City: Navigating the Tensions of Urban Livestock Through Municipal
Ordinances / William H. Butler 193
Assessing Access to Local Food System Initiatives in Fairbanks, Alaska / Alison M. Meadow 217
Mitigating Agricultural Greenhouse Gas Emissions: A Review of Scientific Information for Food System
Planning / Tara L. Moreau, Jennie Moore, and Kent Mullinix 237
Planning for Climate Action in British Columbia, Canada: Putting Agricultural Greenhouse Gas Mitigation on
Journal of Agriculture, Food Systems, and Community Development ISSN: 2152-0801 online
www.AgDevJournal.com
I
NT
HISI
SSUED
UNCANH
ILCHEYA smörgåsbord of fresh applied research papers
Published online 28 March 2012
Citation: Hilchey, D. L. (2012). A smörgåsbord of fresh applied research papers [Editorial]. Journal of Agriculture, Food Systems, and Community Development, 2(2), 1–2.http://dx.doi.org/10.5304/jafscd.2012.022.017
Copyright © 2012 by New Leaf Associates, Inc.
ometimes you just have to improvise. We received such a strong response to our call for manuscripts on food system planning that we decided to squeeze a group of excellent additional papers on the topic into this winter issue. Starting out the issue, however, are a number of exceptional open-call papers. We begin
with Assessing the Growth Potential and Economic Impact of the U.S. Maple Syrup Industry, by Michael Farrell and
Brian Chabot. In honor of one of North America’s unique seasonal foodways, this paper will remain open access (freely accessible even without a subscription) through April 2012. Click here to access it for FREE.
In Kaiser Permanente’s Farmers’ Market Program: Description, Impact, and Lessons Learned,DeAnn Cromp, Allen Cheadle, Loel Solomon, Preston Maring, Elisa Wong, and Kathleen Reed present the results of a large
shoppers survey of the leading HMO’s ground-breaking farmers’ market program. Nick McCann and Frank
Montabon review innovations in mid-scale beef value chains in Strategies for Accessing Volume Markets in the Beef Industry: A Review of Three Case Studies. Leah Greden Mathews presents a “portfolio” methodology for
exploring the wide range of benefits farms provide to communities in From the Ground Up: Assessing Consumer
Preferences for Multifunctional Agriculture. In “Food Security” and “Food Sovereignty”: What Frameworks Are Best Suited for Social Equity in Food Systems?Megan Carney provides some clarity on the meaning and application of the
oft-confused terms. Thomas Steiger, Jeanette Eckert, Jay Gatrell, Neil Reid, and Paula Ross provide a
fresh and surprising look at farm succession in the Midwest in Cultivating Narratives: Cultivating Successors.
Our international contributions include papers from Brazil, Europe, and Canada. In Is a Geographical
Certification a Promising Production and Commercialization Strategy for Smallholder Sheep Farming in Ceará, Brazil?Sarah Schneider, Marianna Siegmund-Schultze, Evandro Holanda Júnior, Francisco Alves, and Anne Valle Zárate studied the feasibility of using a geographic indication for a specialty dried mutton product. Paul Swagemakers, M. Dolores Domínguez García, Xavier Simón Fernández, and Johannes Wiskerke
provide a case comparison of two European farms’ agro-ecological practices in in Unfolding Farm Practices:
Working Toward Sustainable Food Production in the Netherlands and Spain. Rounding out our international papers is
the second installment of Could Toronto Provide 10% of its Fresh Vegetable Requirements from Within its Own
Boundaries? subtitled Part II, Policy Supports and Program Design by Rod MacRae, Joe Nasr, James Kuhns, Lauren Baker, Russ Christianson, Martin Danyluk, Abra Snider, Eric Gallant, Penny Kaill-Vinish, Marc Michalak, Janet Oswald, Sima Patel, and Gerda Wekerle.
The food system planning papers in this issue include Peleg Kremer and Yda Schreuder’s The Feasibility of
Regional Food Systems in Metropolitan Areas: An Investigation of Philadelphia’s Foodshed, in which they provide an exhaustive look at three foodshed scenarios for the City of Brotherly Love. This issue’s cover image comes
from their paper. In Welcoming Animals Back to the City: Navigating the Tensions of Urban Livestock Through Municipal
Ordinances, William Butler offers an analysis of municipal codes which regulate livestock production in 22
U.S. communities. Alison Meadowlooks at local food accessibility (including local versus conventional food
prices)in Assessing Access to Local Food System Initiatives in Fairbanks, Alaska. We offer two papers on agriculture
greenhouse gas emissions and mitigation strategies for communities by Tara Moreau, Jennie Moore, and
Kent Mullinix entitled (1)Mitigating Agricultural Greenhouse Gas Emissions: A Review of Scientific Information for Food System Planning, and (2) Planning for Climate Action in British Columbia, Canada: Putting Agricultural Greenhouse Gas Mitigation on Local Government Agendas.
Finally, our columnists look at challenges to food systems here and abroad. Ken Meter looks to “America’s
game” for inspiration on how we can increase farm numbers in the U.S., while Rami Zurayk looks at food
insecurity as a basis for the Arab Spring.
Journal of Agriculture, Food Systems, and Community Development ISSN: 2152-0801 online
www.AgDevJournal.com
M
ETRICS FROM THEF
IELDBlending insights from research with insights from practice
K
ENM
ETERHow do we grow new farmers?
Learning from another American pastime
Published online 28 March 2012
Citation: Meter, K. (2012). How do we grow new farmers? Learning from another American pastime. Journal of Agriculture, Food Systems, and Community Development, 2(2), 3–6. http://dx.doi.org/10.5304/jafscd.2012.022.015
Copyright © 2012 by New Leaf Associates, Inc.
ften in my travels as a consultant and speak-er, I am asked, “How do we grow new farmers?”
Every time I hear this question, I draw a quick breath. This is truly a remarkable question to hear in America, which prides itself on “feeding the
world.” If the most productive agricultural engine on the planet does not know how to grow new farmers, who does?
To answer this question, one needs to go back 50 years. A 1962 report by the Committee for Economic Development, a Wall Street think tank, concluded that the problem with U.S. agriculture was that it employed too many people. These human resources could be better allocated, the CED argued, by moving people off the farm, to be replaced by larger equipment.
“[Our] adaptive approach utilizes positive govern-ment action to facilitate and promote the move-ment of labor and capital where they will be the most productive and earn the most income,” the study said (CED, 1962; see also Ritchie, 1980). The mechanism for this forced migration of labor was simple: a conscious effort to keep commodity prices low (Meter, 1990). Another mechanism was providing public tax incentives for adopting new technology that replaced labor.
O
Ken Meter is president of Crossroads Resource Center in Minneapolis, Minnesota. He has performed 78 local food-system assessments in 30 states and one Canadian province; this information has promoted effective action in partner communities. He served as coordinator of the review process for USDA Community Food Project grants, and has taught economics at the Harvard Kennedy School and the University of Minnesota. He is co-convener of the Community Economic Development Committee of the Community Food Security Coalition. A member of the American Evaluation Association’s Systems Technical Interest Group, Meter also serves as an Associate of the Human Systems Dynamics Institute. He serves as a
Indeed, from 1962 to 2011, farmers more than doubled productivity (USDA ERS, 2012a). Food consumption rose from USD107 billion (USD790 billion in 2011 dollars) to USD1.2 trillion (USDA ERS, 2012c). Yet net farm income fell. In 1962, all U.S. farmers combined earned USD46 billion (in 2011 dollars) of net cash income (total cash receipts from marketing farm products, less the production expenses required to produce them) (USDA ERS 2012b). By 2011, net cash farm income had fallen 9%, to USD42 billion (USDA ERS 2012b). Farmers had collected USD793 billion in government payments during that time, but they had paid USD1.2 trillion in interest on loans — which means that at least USD363 billion
left the farm sector over that 50-year period1
(Bureau of Economic Analysis, n.d.; USDA ERS, 2012b; see also Meter, 2011, p, 205). This is a classic case of public intervention magnifying market failure.
This occurred despite billions of dollars of subsidies provided by millions of immigrants who worked below minimum wage under conditions of grave physical risk, drawing upon skills they learned in impoverished settings, working more diligently and more effectively than many American-born children ever learn to work.
So, one answer to the question, “Why doesn’t America know how to grow new farmers?” is that our public policy has been to remove the farm labor force under the guise of economic efficiency. As the CED had hoped, both labor and capital were extracted from the U.S. farm economy (CED, 1974). Scant attention was paid to the question of how we would generate new generations of farm owners. Funding for agriculture training programs was dismantled, even as farm income declined; essential training grounds for farm production and family values (such as 4-H, FFA, and high school agricultural courses) eroded in importance.
1 This data is adjusted for inflation by taking nominal dollar charts and adjusting to 2011 dollars using the U.S. Federal Reserve Board Consumer Price Index.
America received the very policy outcomes it asked for. This was no “market-based solution.” This was federal intervention designed to make some players in the market stronger than others.
If we can accomplish that policy goal, why couldn’t the U.S. accomplish the goals of promoting healthy locally based food systems, and continuously training new generations of farmers?
As I consider a practical approach to growing new farmers, I often think of that essential American pastime, baseball. Almost every town in the U.S., large or small, has several baseball fields. Many sponsor highly competitive teams. Provision of these fields does not seem to accomplish much in building an economic advantage for the U.S., and it could even be argued that baseball games — especially afternoon contests in the big cities — actually take people away from contributing to the economy. Baseball is inherently seasonal. Yet we seem to know how to grow new baseball players.
Despite Moneyball, we do this to promote vague
and unmeasurable values, things like “teamwork,” or “athletic talent,” which many now believe should be squeezed out of the broader economy in favor of hard-nosed dollar counts.
Nearly every township board or city hall allocates money for baseball fields close to where young people grow up, so everyone will have a chance to learn the game. A few years ago, we even made it easier for girls to have the same access to baseball fields that boys have. People of all races join the game. Playing baseball has been viewed by some new immigrants as a way of showing one’s interest in joining mainstream America.
Journal of Agriculture, Food Systems, and Community Development ISSN: 2152-0801 online
www.AgDevJournal.com
money to coach youngsters or to umpire Little League games. It is almost as if we were all assured access to a precious right.
Truly, we rely on the American competitive spirit to motivate youngsters to learn how to play well, and to credential themselves by winning baseball games. As these youngsters
mature, they may try out to be placed on a team where they can play on smoother fields, with larger outfields and higher fences, and where more and more people can watch them play. I am told that parents can become quite impassioned by watching their children vie for places in these arenas, and that games can be chaotic at times. These Little League, Babe Ruth league, and local amateur playing fields are typically built using public funds. That is to say, public money is spent in ways that give Americans pleasure, as well as ways of building their own capacities in a self-organized way. Private investment by families dovetails
with public investment by local municipalities.
A few of the most highly motivated players go on to play in college, semipro, or minor league ball, where the competition is fiercer and the potential reward is greater. At this level, people are
financially rewarded for their personal skills — yet many of these full-blooded Americans are more than happy to play these contests on a baseball field that was — gasp! — subsidized by public dollars.
A few of the lucky move on to multimillion-dollar contracts, where they can vie for attention on the cable networks, trying to steal viewers away from Iron Chef competitions. I don’t condone these superstar salaries, since to my thinking farmers create more value, but they seem popular. More-over, it should not be overlooked that millions of
Americans pursue the baseball dream with absolutely no financial compensation.
Shockingly, nearly every major metropolitan area in the U.S. sports a professional stadium (or two) designed expressly for the game of baseball. The Minnesota Twins’ beautiful new stadium, paid in large part by Hennepin County over the opposition of its residents, features a climate-controlled outdoor space where grass can be kept alive year-round, and a specially designed sandy soil so rain drains promptly. Yet many northern cities tell me their growing season is too short to allow for food to be grown inside city limits; the season is “too short,” I am told.
Most startling to me is the term of art we use in America to describe this ubiquitous, seam-less, multifaceted, inclusive, and values-based system of seasonal enterprises that ensures we have plenty of competitive baseball players who understand team-work — this elegant and complex combination of public and private investment, working in comple-mentary ways for a socially approved good.
We call it a “farm system.”
It is almost as if we had learned from our 4-H clubs, our FFA chapters, and our multigenerational family farms how to build a system of baseball facilities and processes that ensure open access to all. Indeed, the patient, long-term planning that a farmer needs to raise a healthy dairy herd, or to effectively rotate pastures with crops to reduce weed pressure, or to pass a farm down to the children, would be essential in framing a long-term approach to the baseball question.
Perhaps we could now apply these same principles to the topic of growing new farmers. Yet to do so, Most startling to me is the term
of art we use in America to describe this ubiquitous, seamless, multifaceted, inclusive, and values-based system of seasonal enterprises
that ensures we have plenty of competitive baseball players
who understand teamwork.
we might have to decide, as a society, that feeding all of our children fresh food is as important as making sure they all have access to baseball.
References
Bureau of Economic Analysis. (n.d.). Regional
Economic Accounts, Table CA25N, data for 2007 [Data set]. Retrieved from http://www.bea.gov/ regional/
Committee for Economic Development [CED]. (1962).
An adaptive program for agriculture. New York: Author.
Committee for Economic Development [CED]. (1974).
A new U.S. farm policy for changing world needs. New
York: Author.
Meter, K. (1990) Money with roots. Minneapolis,
Minnesota: Crossroads Resource Center. Retrieved from http://www.crcworks.org/roots.pdf
Meter, K. (2011). Local foods are key to economic recovery. In E. Holt-Gimenez (Ed.), Food Movements
Unite! Oakland, California: Food First.
Ritchie, M. (1980). The loss of family farms. Minneapolis, Minnesota: Center for Rural Studies.
USDA Economic Research Service [ERS]. (2012a). Agricultural productivity in the United States [Data set]. Retrieved from http://www.ers.usda.gov/ Data/AgProductivity/
USDA ERS (2012b). Farm income/balance sheet items in constant (2005=100) dollars, 1929-2012F [Data set]. Retrieved from http://www.ers.usda.gov/ data/farmincome/finfidmu.htm
USDA ERS. (2012c). Food CPI and expenditures: Table 1 [Data set]. Retrieved from
Journal of Agriculture, Food Systems, and Community Development ISSN: 2152-0801 online
www.AgDevJournal.com
G
LOBALV
IEWS OFL
OCALF
OODS
YSTEMSReflections on the growing worldwide local food movement
R
AMIZ
URAYKBread, freedom, and social justice
Published online 28 March 2012
Citation: Zurayk, R. (2012). Bread, freedom, and social justice. Journal of Agriculture, Food Systems, and Community Development,2(2), 7–10. http://dx.doi.org/10.5304/jafscd.2012.022.016
Copyright © 2012 by New Leaf Associates, Inc.
nyone needing an indication of how much the Arab World has changed in the past year has only to tune in to one of the popular satellite TV music channels. There, young artist Ramy Essam’s hit song “Bread, Freedom and Social Justice” is beamed several times a day to the four corners of the Arab world. The song was released last year, in the wake of the Egyptian uprising that brought down a regime that punished talk about freedom and social justice with imprisonment and torture. It takes its title from one of the most popular slogans chanted during the 2011 protests, which came after bread riots had shaken Egypt and many surround-ing Arab countries in the wake of the 2008 food
crisis. In that sense, the song adequately summa-rizes the main demands of the Arab people. Food security is at the top of that list.
The Arab region is the most food-insecure part of the world. It imports 50% of the calories it con-sumes (The World Bank, FAO and IFAD, 2006), and local food production is limited by serious ecological and structural conditions. Egypt is the largest single grain importer in the world (FAO, 2011), and other countries in what was historically known as the Fertile Crescent (parts of present day Iraq, southern Turkey, Lebanon, Syria, and
Palestine) suffer from the same predicament. This is one of the main reasons why many researchers from around the world have sought to attribute the Arab uprisings to rising food prices (see for example Bar-Yam, 2012 and Harrigan, 2012). The food price spikes since 2008 have certainly served to mobilize public anger, but people have risen up for many different reasons. Among these are youth unemployment and rural poverty associated with the demise of local food systems. All these are important components of food security.
A
Rami Zurayk is professor at the Faculty of Agricultural and Food Sciences at the American University of Beirut, Lebanon. He studied at the American University of Beirut and at Oxford University, UK. His research addresses issues at the nexus of food, landscapes, and livelihoods. He is an active member of Lebanese civil society and a founder of Slow Food Beirut. He can be contacted at
To the interested onlooker, the problem of food security in the Arab world appears to be inextric-able: the region’s ecological endowment is simply not sufficient to satisfy the needs of a population that has been experiencing the fastest growth rates worldwide and the most rapid urbanization (IFPRI, 2010). Moreover, crop productivity is low (except in Egypt) and the spread of technology is limited by rural illiteracy and poor standards of education. The natural conclusion is usually that the region must rely principally on global trade
in order to satisfy the needs of its growing population. But markets are only open to those who can afford them. That is why mainstream institutions such as the International Food Policy Research Institute (IFPRI) (Breisinger et al., 2010) classifies oil-rich countries such as Qatar as food secure although Qatar produces no food, while the Arab countries of the Levant — where farming began
10,000 years ago — are considered to be food insecure because they do not produce sufficient oil rent to afford to import all the food they need.
The instability of the world food markets has clearly shown that reliance on trade for food secu-rity is a very risky enterprise, and that the globalized food regime does not believe in charity. A solution to the Arab food security riddle must definitely have a homegrown component, especially in those countries where great human civilizations were built on surplus created from agriculture. The Nile basin was the cradle of the Pharaohs, and Babylon rose from the rich Mesopotamian plains. Why are these regions unable to cater better to their own needs? Why can’t they contribute more prominently to their own food security?
The answer to this conundrum lies first in a better understanding of the contemporary rural and farm-ing history of the region, which, half a century ago, moved from the yoke of colonialism to the grasp of autocracies in a world system where strategic
interest in oil reserves are the prime determinant of foreign policy. Since the mid–twentieth century, the region has had more than its share of invasions, occupations, and wars, and the need to keep a tight control over the region has led the dominant nations to embrace and foster local dictatorships. With generous military help, these totalitarian regimes developed competencies in oppression and repression, but not in farming and rural develop-ment. As a result, local food systems were
quasi-annihilated and rural poverty became rampant. Today, while 43% of the Arab population still lives in rural areas, 70% of them are poor (Riadh, 2010). A small affluent class has taken hold of the resources of these nations, strengthened by its close association with the regimes to whom it acts as a financial intermediary. Investments in agriculture have been largely capitalistic in nature. Strengthened with state subsidies, investors have aimed at producing value-added goods for export rather than addressing the food and nutritional needs of the population. Meanwhile, this same class also doubled up as trade agents for multinational corporations flooding local markets with once cheap subsidized food from Northern surpluses. It is in this context that Arab food security needs to be perceived.
Fair access to land is a precondition to the growth and prosperity of a local food system that contrib-utes to food security and sovereignty and alleviates rural poverty. Access to adequate land resources remains one of the most challenging hurdles facing Arab family farmers, who are the backbone of the local food systems. In many Arab countries, the endowment of fertile land is limited by natural conditions: a mixture of terrain and water availa-bility. In Egypt, for instance, the farmland area per capita is just one twenty-fifth of a hectare (0.1 acre). Those in power hold much of this land according to the GINI index for land, a measure of the inequality in distribution (where 0 is perfect equality A solution to the Arab food
security riddle must definitely have a homegrown component,
especially in those countries where great human civilizations
Journal of Agriculture, Food Systems, and Community Development ISSN: 2152-0801 online
www.AgDevJournal.com
and 100 is perfect inequality). In this region, the GINI index is among the highest worldwide. In Egypt it is 69, in Jordan it is 81, in Lebanon it is 69, in Morocco 62, in Tunisia 69, and in Algeria 65 (FAO, 2010). (It is unavailable for Yemen, Syria, Libya, Bahrain, and other Gulf countries.) Few countries in the world show higher land inequality figures as a group, except perhaps the U.S., where the GINI for land is 78. By comparison, Ireland is 44 and Sweden is 32 (FAO, 2010).
The Arab popular uprisings have proved that people can remove dictators from power. But a difficult question remains: Will the Arab people be able to change their social and economic realities, ameliorate the living conditions of the poor, improve food security, and achieve the social justice called for in Ramy’s song?
Current indications are not very encouraging. Media reports indicate that public feeling on the Tunisian streets is that there has been no real change in the countryside, where the uprising began. This is despite the fact that the agriculture sector provides more than 12% of the Tunisian GDP and continues to attract foreign investments (Larbi & Chymes, 2009). Statistics also show that agricultural exports rose by 12% after the revolu-tion (Shahin, 2011). However, none of these achievements was used to improve the livelihoods of small producers and of agricultural workers. They also did not lower unemployment, rife in the countryside.
The problem lies in great part in the economic model followed by Arab countries, which has not been seriously challenged by the uprisings. This model depends on economic growth based on the maximum exploitation of human and natural resources. Wealth continues to be concentrated in the hands of a small group of affluent people that influences national policy to protect its members’ interests. For instance, the land rent “liberation” Law 96 of 1992, which forced more than a million Egyptian farmers off their land, has not been revoked — and there are no indications that it will be (Bush, 2010).
Many today feel that no regime change will truly take place if this system is not confronted. There are, however, some positive trends that lead us to cautious optimism. In Egypt, a popular movement has recently emerged in the countryside, where 18 million farmers live. It seeks to lobby for the inclusion of farmers’ rights to land, water, and a decent living in the new constitution. Whether movements such as these will gain enough power to change the established order may be decisive in achieving bread, freedom, and social justice.
References
Bar-Yam, Y. (2012). Economics of food prices and crises. New England Complex Systems Institute.
Breisinger, C., van Rheenen, T., Ringler, C., Nin Pratt, A., Minot, N., Aragon, C.,…Zhu, T. (2010, May). Food security and economic development in the Middle East
and North Africa. IFPRI Discussion Paper 00985.
Washington, D.C.: IFPRI.
Bush, R. (2010, January). Food riots: Poverty, power and protest. Journal of Agrarian Change, 10(1), 119-129.
http://dx.doi.org/10.1111/j.1471-0366.2009. 00253.x
Harrigan, J. (2012, February). Did food prices plant the seeds
of the Arab Awakening? Presentation at the IFPRI
conference Food Secure Arab World, Beirut, Lebanon.
International Food Policy Research Institute [IFPRI]. (2010, February). Middle East and North Africa Strategy. Larbi, W., & Chymes, A. (2009, September). The impact of
the government policies and incentives to promote the export of
agricultural products in Tunisia: Case of olive oil. Paper
prepared for presentation at the 113th EAAE Seminar, A Resilient European Food Industry and Food Chain in a Challenging World, Chania, Crete, Greece.
Riadh, B. J. (2010). The Arab region’s unemployment problem
revisited (Report API/WPS 1015). Kuwait: The Arab
Planning Institute.
Shahin, H. (2011, 22 April). Tunisia’s agricultural exports increase 12%. Yalla Finance. Retrieved from
http://yallafinance.com/2011/04/22/tunisias-agricultural-exports-increases-12/
United Nations Food and Agriculture Organization [FAO]. (2010). FAO Statistical Yearbook 2010. Retrieved from http://www.fao.org/economic/
United Nations Food and Agriculture Organization [FAO]. (2011, 21 September). GIEWS country briefs:
Egypt. Accessed 24 March 2012 at http://www.
fao.org/giews/countrybrief/country.jsp?code=EGY
World Bank, FAO, & the International Fund for Agricultural Development [IFAD]. (2006). Improving
food security in Arab countries. Washington, D.C.: The
Journal of Agriculture, Food Systems, and Community Development ISSN: 2152-0801 online
www.AgDevJournal.com
Assessing the growth potential and economic impact
of the U.S. maple syrup industry
Michael L. Farrell, Department of Natural Resources, Cornell Universitya,
*
Brian F. Chabot, Department of Ecology & Evolutionary Biology, Cornell Universityb
Submitted 29 May 2011 / Revised 5 August 2011 and 16 August 2011 / Accepted 26 August 2011 / Published online27 March 2012
Citation: Farrell, M. L., & Chabot, B. F. (2012). Assessing the growth potential and economic impact of the U.S. maple syrup industry. Journal of Agriculture, Food Systems, and Community Development 2(2), 11–27.
http://dx.doi.org/10.5304/jafscd.2012.022.009
Copyright © 2012 by New Leaf Associates, Inc.
Abstract
This paper addresses the growth potential of the U.S. maple syrup industry. It outlines the number of potentially tappable maple trees and the eco-nomic impact of utilizing more of these trees for syrup production. U.S. producers currently tap 0.4% of all potentially tappable maple trees, with the highest percentage tapped in Vermont, at 2.94%. Two scenarios are analyzed for how pro-duction and consumption could grow together: (1) if each state tapped 2.94% of its available trees and consumed all of the syrup locally among its residents; and (2) the number of taps needed in each state to provide 2.6 ounces (76.9 ml) per person from “local” sources. Based on these
analyses, states with the greatest potential to increase local production and consumption of pure maple syrup include Connecticut, Michigan, New York, Ohio, and Pennsylvania. Strategic marketing efforts are necessary to help maple producers take advantage of the growing demand for local, healthy, and organic food.
Keywords
economic impact, Forest Inventory & Analysis (FIA), local food, maple syrup, red maple, sugar maple
Introduction
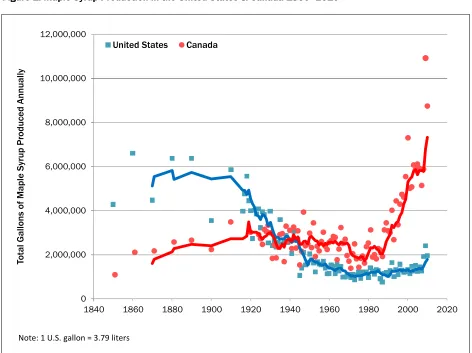
Maple syrup was once a much larger component of the rural economy in both the U.S. and Canada. The United States produced a record equivalent of 6,613,000 gallons (25,032,928 liters) of maple syrup in 1860, with most of the syrup actually boiled down further to produce granulated maple sugar (U.S. Census Office, 1860). As seen in figure 1, maple production in the U.S. peaked in the 1800s, steadily declined throughout the twentieth century, and is experiencing a rebirth in the twenty-first century. Maple production was always a small a, * Corresponding author: Michael L. Farrell, Department of
Natural Resources, Cornell University, 157 Bear Cub Lane, Lake Placid, NY 12946 USA; +1-518-523-9337;
b Department of Ecology & Evolutionary Biology, Cornell
University, 102 Little Rice Hall, Ithaca, NY 14853 USA; +1-607-279-1291; [email protected]
See the Cornell Maple Program website at
component of the agricultural sector in Canada, but spiked dramatically in Quebec in the early 1980s. Producers installed vacuum tubing systems and reverse osmosis units that allowed them to significantly expand their operations while saving time and using less fuel. Production in Canada leveled off in recent years due to implementation of a quota system in Quebec in 2005 aimed at stabilizing prices and reducing surplus inventory (Gagné, 2008). Once the inventory was exhausted in 2008, prices rose to record levels, the quota restrictions were eased, and production levels surged once again.
Maple syrup is a luxury item consumed around the world, yet the greatest market for syrup still lies within the United States. The U.S. currently imports nearly four times as much syrup from Canada as it produces (Agriculture and Agri-Food Canada, 2006), so there is a tremendous oppor-tunity for U.S. producers to expand production and fill domestic markets with “local” syrup. Maple syrup production is growing rapidly in the U.S., as a shortage of syrup and corresponding price increases led many sugarmakers to expand pro-duction and others to get started in recent years (Dravis, 2008; Dravis, 2009). Some politicians even seized on the opportunity to spur rural economic
0 2,000,000 4,000,000 6,000,000 8,000,000 10,000,000 12,000,000
1840 1860 1880 1900 1920 1940 1960 1980 2000 2020
To
tal
Gall
ons of
Mapl
e Syr
up
Pr
od
uced Annual
ly
United States Canada
Note: 1 U.S. gallon = 3.79 liters
Figure 1. Maple Syrup Production in the United States & Canada 1860–2010
Sources: Statistics Canada. (2011, Dec. 14). Table 001-0008 — Production and farm value of maple products, annual (table). CANSIM (database) . Retrieved from
http://www5.statcan.gc.ca/cansim/a26?lang=eng&retrLang=eng&id=0010008&pattern=maple&tabMode=dataTable&srchLan=-1&p1=1&p2=-1
Journal of Agriculture, Food Systems, and Community Development ISSN: 2152-0801 online
www.AgDevJournal.com
development through enhanced syrup production. Senator Charles Schumer (D-NY) introduced legis-lation in April 2008 that would provide grants and incentives to states in order to increase the number of trees being tapped on private lands (Churchill, 2008, Schwaner-Albright, 2009). This legislation was reintroduced in both the House and the Senate several times but has yet to pass in any form. Even without federal support, states including Connecti-cut, Maine, Michigan, New York, and Vermont have all moved forward with efforts to boost syrup production (Hoyum, 2010; Karkos, 2011; Litten,
2011; Wanamaker, 2009; Whitcomb, 2009). Maple syrup consumption in the U.S. is only 2.6 oz. (76.9 ml)/person, yet this has grown tremen-dously over the past 35 years. Figure 2 tracks U.S. and Canadian syrup production, as well as U.S. imports and exports of maple syrup, from 1975 to 2009. Per capita consumption levels were deter-mined by summing the amount of syrup produced by U.S. sugarmakers and the amount of syrup imported from Canada, subtracting the amount of syrup exported from the U.S., and then dividing by the population in a given year.
Figure 2. Maple Syrup Production, Imports and Exports in the United States and Canada, and Per Capita Annual Maple Syrup Consumption in the U.S. 1975–2009.
Sources: Statistics Canada. (2011, Dec. 14). Table 001-0008 — Production and farm value of maple products, annual (table). CANSIM (database) . Retrieved from http://www5.statcan.gc.ca/cansim/a26?lang=eng&retrLang=eng&id=0010008&pattern=maple& tabMode=dataTable&srchLan=-1&p1=1&p2=-1
U.S. Department of Agriculture, Economic Research Service. (2011, June 10). Table 43—U.S. maple syrup production, imports, exports, and prices, by calendar year [Excel spreadsheet]. Retrieved from http://www.ers.usda.gov/briefing/sugar/data/table43.xls
U.S. Census Bureau. (2011, Dec. 21). Population estimates: State totals: Vintage 2011. Retrieved from
Per capita consumption of maple syrup in the U.S. has grown by 155% over the past 35 years, rising from 1.03 oz. (30.5 ml)/person in 1975 to 2.63 oz. (77.8 ml)/person in 2009. While the boost in U.S. consumption has been made possible by large increases in Canadian production, future levels of syrup production and consumption might not follow the same trends. Questions remain about where the additional syrup will be produced and consumed and the impact of future development on prices and profitability.
Methods
In order to determine the tapping potential in the U.S., analyses were performed using the latest U.S. Forest Service Forest Inventory & Analysis (FIA) data (Bechtold & Patterson, 2005) from 24 states
that contain a significant number of sugar (Acer
saccharum) and/or red maples (Acer rubrum). The number of potential taps was estimated by sum-ming all of the sugar and red maple trees greater than 10" (25.4 cm) diameter at breast height (dbh) and applying conservative tapping guidelines of one tap for a 10"–17" (25.4– 43.2 cm) tree and 2 taps for trees 18" (45.7 cm) and greater. The FIA data are classified by ownership category (private, U.S. Forest Service, other federal land, and state and local government). They are also divided between the tappable (nonreserved) and nontap-pable (reserved) trees, as the reserved forestlands where timber production is legally prohibited are also likely to have restrictions on tapping.
To determine the percentage of potential taps that are actually utilized for syrup production, these figures were compared with the number of taps reported for each state in the 2010 National Agri-cultural Statistics Service (USDA NASS) Maple Syrup Crop Report. NASS only tracks maple syrup production for 10 states. Thus, although 14 additional states have a substantial number of maple trees, we lack any information on their number of taps and corresponding utilization rates. Syrup production levels in these states are currently so low that it is not feasible for NASS to gather these data.
Given the strong growth in the local food sector
and the niche that maple syrup occupies as the local, minimally processed sugar alternative for the eastern U.S., analyses were performed to determine the market potential for maple syrup production and consumption on a “local” basis. For these analyses, local syrup is defined as being produced and consumed within the same state. Based on local production for local consumption, two scenarios are posed for how the maple industry could expand:
1. If each state tapped the same percentage of
its trees that Vermont does and all of the syrup was consumed locally by the residents of the state, how much syrup must each person in that state consume on an annual basis?
2. Given that the average American consumes
2.6 oz. (76.9 ml) of pure maple syrup annually, what percentage of the maple trees in each state would need to be tapped in order to fill the existing demand for syrup in a state from its own trees?
The final component of this paper is determining the economic impact for each of these two scenar-ios. For each state, average annual syrup produc-tion was estimated based on the average yield per tap in 2007–2009 for that state. For the states that do not have any production data, the lowest figure of all states, 22 oz. (651 ml)/tap for Pennsylvania, was assumed for the average production. A dollar figure was estimated by multiplying the possible production figures for each state by the average price that producers received in that state from retail, wholesale, and bulk syrup sales over the period 2007–2009. For states that do not have any data available, the average figure of USD37.10 per gallon for the entire U.S. was used.
Results and Discussion
Journal of Agriculture, Food Systems, and Community Development ISSN: 2152-0801 online
www.AgDevJournal.com
already suitable for tapping. Thus, the immediate potential for syrup production is based on the existing resource of large maple trees. While sugar maples are the preferred species for tapping due to the high sugar concentration in their sap, red maples are also suitable for syrup production, but usually exhibit slightly lower sap sugar production than sugar maples (Chapeskie, Wilmot, Chabot, & Perkins, 2006). The number of potential sugar maple taps is displayed in figure 3, while the number of potential red maple taps can be seen in figure 4. Figure 5 presents the total number of combined sugar and red maple taps for 24 states.
Michigan contains the greatest number of potential sugar maple taps, whereas Pennsylvania leads in red maples. When considering sugar and red
maples combined, New York has the most potentially tappable trees of any state. The more southern and western states tend to have more red maple than sugar maple potential taps, though there are exceptions to this rule. For instance, Connecticut, Maine, Massachusetts, and
Pennsylvania all have significantly more red maples than sugar maples, whereas Illinois, Indiana and Kentucky all have more sugar than red maple potential taps. Although Vermont dominates in syrup production, it ranks fifth in the number of potential sugar maple taps and seventh in the combined total number of sugar and red maple potential taps. Producers in Vermont make up for this apparent shortfall by tapping a much larger percentage of their trees than any other state.
0 20,000,000 40,000,000 60,000,000 80,000,000 100,000,000 120,000,000 140,000,000 160,000,000
N
umber of
po
te
nt
ia
l taps
State and Local Gov't Private
Other Federal Forest Service Figure 3. Number of Potential Sugar Maple Taps for 19 States by Ownership Status, 2011
It is important to realize that the figures presented here overestimate the realistic tapping potential for several reasons. In order to economically tap maples, the trees must be located close enough to an access road and the density of trees must be high enough to justify installing a tubing or road system to collect the sap. While the FIA data includes all sugar and red maple trees growing on nonreserved forestland (land that is not restricted from management), many of these trees are grow-ing in locations that are not suitable for tappgrow-ing. Some of them are in stands that have a low density of maples, are too far from an access road, or are otherwise inaccessible due to topographic
constraints. Further research is in process to obtain a more realistic estimate of the tapping potential for several states based on these considerations.
Finally, it is important to note that the FIA pro-gram only deals with forestland, and therefore does not account for a significant percentage of the trees that are actually tapped. Maples growing in yards, parks, and along roads are favored by producers who collect with buckets due to the easy access and large volumes of sweet sap they generate. In order to quantify these potential taps, much more detailed inventory data must be collected and analyzed through urban and community forestry research initiatives.
Utilization of the Maple Resource
for Syrup Production
Significant differences exist in the utilization of the maple resource for syrup production, as seen in figure 6. Vermont clearly dominates the industry
0 50,000,000 100,000,000 150,000,000 200,000,000 250,000,000 300,000,000 350,000,000
Nu
mber of
po
te
nt
ia
l t
aps
State and Local Gov't Private Other Federal Forest Service Figure 4. Number of Potential Red Maple Taps for 24 States by Ownership Status, 2011
Journal of Agriculture, Food Systems, and Community Development ISSN: 2152-0801 online
www.AgDevJournal.com
due to its relatively high utilization rate of 2.94%, whereas states such as Michigan (0.15%), New York (0.45%), and Pennsylvania (0.17%) have tremendous potential for expansion. Although these three states have the largest maple resource, they tap a much lower percentage of their trees than Vermont does.
The discrepancies in utilization rates can largely be explained by cultural traditions (Hinrichs, 1998). When there are strong cultural norms to produce maple syrup in a certain area, farmers and land-owners are more likely to do so. However, even when there is a robust maple resource, if nobody is already producing syrup, then it is much less likely that landowners start production. Thus, even though Michigan contains the most tappable sugar
maples of any state, the logging industry has domi-nated the landscape and only 0.15% of the maples are used for syrup production. Similarly, West Virginia has more tappable maple trees than Vermont, yet the culture for syrup production does not exist in most of the state. Even though
Vermont ranks seventh in the number of potential taps, it ranks first in syrup production due in large part to the strong cultural traditions and superior branding and marketing of its product over the last century.
Among the more southerly states, such as Kentucky and Tennessee, even though maples grow abundantly, the climate is not thought to be as suitable for commercial syrup production. The climate may play a critical role in explaining why
Figure 5. Total Number of Potential Sugar and Red Maple Taps for 24 States in the United States, 2011
Source: U.S. Department of Agriculture, Forest Service. (2010).
0 50,000,000 100,000,000 150,000,000 200,000,000 250,000,000 300,000,000 350,000,000
N
umber
of
pot
enti
al t
aps
more syrup is not currently produced in these states and what the potential for increasing production is. Sugaring used to be more commonplace in the mid-Atlantic region during the 1800s (U.S. Census, 1860), but that tradition has been lost over time. In these states, the limited number of freezing nights and the spells of very warm weather can cause tapholes to “dry up” prematurely, especially when using buckets or gravity-based tubing to collect the sap. However, with new technologies and techniques, such as high-vacuum tubing, check-valve spout adapters, and replacement of droplines and spouts every year, there may be opportunities to achieve economic returns from syrup production even when the weather is not favorable. More research is needed to determine the potential yields in warmer climates using modern sap-collection technologies. This could provide immediate
economic development in these states, while providing a preview for what the Northeast can expect in a future climate that is predicted to be similar to the mid-Atlantic region (Skinner, DeGaetano, & Chabot, 2010).
Finally, it should be noted that the NASS estimates are based on voluntary reporting of producers. Many sugarmakers are opposed to a government agency knowing about their activities and therefore do not provide NASS with accurate (or any) information on their production levels. Thus, even though NASS provides the most comprehensive database on syrup production in the U.S., using these figures likely underestimates the actual production in many states. Furthermore, since NASS only tracks syrup production in 10 states, there is no data on the limited amount of sugaring that takes place in the other states.
0.0% 0.5% 1.0% 1.5% 2.0% 2.5% 3.0% 3.5%
M
apl
e Ut
ilization
Rat
e
Figure 6. Utilization of the Maple Resource for Syrup Production, 2011
Journal of Agriculture, Food Systems, and Community Development ISSN: 2152-0801 online
www.AgDevJournal.com
Economic Impact of Increased Syrup Production: Two
Scenarios for Local Consumption
This section presents the results of two scenarios for increasing the production of maple syrup through local consumption within the state in which it is produced. The first scenario examines what could happen if each state tapped the same percentage of its trees as Vermont does, while the second scenario estimates the number of taps needed to provide each resident with 2.6 oz. (76.9 ml) of locally produced syrup.
Scenario 1: What if Each State Tapped the Same Percentage of Its Trees as Vermont
The first scenario provides a theoretical upper limit for what is possible to achieve in each state. Although no other state will likely ever tap the same percentage of its trees as Vermont does, this analysis presents the economic impact and per capita consumption levels necessary to consume all of the syrup locally if it did.
There are interesting observations when examining the per capita consumption necessary to sell all of the syrup produced in a state among the residents of that state. While most states have low
“necessary” consumption levels, below 3 oz./person, the residents of Vermont and Maine would need to consume significantly more syrup, at 180.9 oz. (5,349.9 ml) per person and 26.6 oz. (786.7 ml) per person, respectively, in order to utilize all of the syrup they produce themselves. These extremely high values result from the combination of extensive syrup production and relatively low populations. While it is likely that many producers of maple syrup consume at least 180 ounces themselves in a given year, it would take enormous marketing efforts and a tremendous reduction in prices to encourage all citizens to consume this much pure maple syrup annually.
Given this reality, Vermont and Maine have not limited their markets to the residents of their own state, but strategically looked elsewhere to sell most of their syrup. Vermont made wise decisions throughout the twentieth century in branding itself as the maple state in order to export this high-value crop throughout the U.S. and now to the world.
Similarly, Canada purposefully built a worldwide
image as the maple syrup nation and now exports over
80% of its production (Agriculture and Agri-Food Canada, 2006). It’s commonly known within the maple industry that the vast majority of syrup production in Maine is carried out by Canadian citizens on former paper company land along the Quebec border. Since this region has few people to sell to locally, nearly all of the syrup is sold in bulk to the major packaging and distribution companies in the U.S. and Canada.
Although exports will continue to be important for agricultural commodities, the local food sector is currently experiencing rapid growth. It is now even being embraced by Walmart, which plans to source a larger percentage of the produce sold in its stores from farmers located in that state (Clifford, 2010). In order to examine the potential for local syrup consumption on a statewide basis, table 1 presents two figures:
1. The per capita syrup consumption
necessary to consume all of the syrup currently produced in a state locally, and
2. The syrup consumption levels necessary if
a state tapped the same percentage of its trees as Vermont does.
Table 1. The Economic Impact of Increasing Syrup Production Levels to those Achieved in Vermont (all prices in USD)
Population (2010 Census Data)
Number of Potential
Taps1
Number of Actual
Taps2
Number of Taps When Achieving
Vermont's Utilization Rate3
Syrup Production
Efficiency (oz/tap)4
Local per-Capita Consumption at
current utilization rates
(oz./person)
Local per-capita consumption at
Vermont utilization rates
(oz./person)
Average Price per Gallon5
Current Value of Syrup Production
Potential Value of Syrup Production
at Vermont's Utilization Rates
Economic Impact of Increasing Syrup
Production to Vermont's Level
Arkansas 2,915,918 8,293,520 — 243,745 22.4 0.0 1.9 $37.80 — $1,612,373 $1,612,373
Connecticut 3,574,097 32,702,898 75,000 961,132 23.7 0.5 6.4 $59.23 $823,343 $10,551,221 $9,727,878
Georgia 9,687,653 38,954,859 — 1,144,876 22.4 0.0 2.6 $37.80 — $7,573,354 $7,573,354
Illinois 12,830,632 12,527,570 — 368,183 22.4 0.0 0.6 $37.80 — $2,435,530 $2,435,530
Indiana 6,483,802 43,971,137 — 1,292,303 22.4 0.0 4.5 $37.80 — $8,548,587 $8,548,587
Kentucky 4,339,367 75,286,754 — 2,212,663 22.4 0.0 11.4 $37.80 — $14,636,768 $14,636,768
Maine 1,328,361 148,404,616 1,430,000 4,361,583 27.9 30.0 91.5 $33.27 $10,354,694 $31,582,419 $21,227,726
Maryland 5,773,552 24,643,818 — 724,277 22.4 0.0 2.8 $37.80 — $4,791,093 $4,791,093
Massachusetts 6,547,629 55,928,669 250,000 1,643,733 24.6 0.9 6.2 $48.73 $2,339,200 $15,380,080 $13,040,880
Michigan 9,883,640 277,960,651 490,000 8,169,211 29.1 1.4 24.1 $42.53 $4,737,930 $78,990,094 $74,252,164
Minnesota 5,303,925 39,181,626 — 1,151,541 22.4 0.0 4.9 $37.80 — $7,617,440 $7,617,440
Missouri 5,988,927 11,322,763 — 332,774 22.4 0.0 1.2 $37.80 — $2,201,299 $2,201,299
New Hampshire 1,316,470 77,720,574 420,000 2,284,193 29.5 9.4 51.2 $50.40 $4,882,752 $26,555,112 $21,672,360
New Jersey 8,791,894 16,806,386 — 493,936 22.4 0.0 1.3 $37.80 — $3,267,390 $3,267,390
New York 19,378,102 305,685,731 1,903,000 8,984,045 26.9 2.6 12.5 $38.83 $15,543,598 $73,381,184 $57,837,585
North Carolina 9,535,483 84,977,529 — 2,497,473 22.4 0.0 5.9 $37.80 — $16,520,786 $16,520,786
Ohio 11,536,504 87,616,491 385,000 2,575,032 29.7 1.0 6.6 $39.07 $3,484,421 $23,305,184 $19,820,763
Pennsylvania 12,702,379 278,622,099 465,000 8,188,650 22.4 0.8 14.4 $36.00 $2,929,500 $51,588,498 $48,658,998
Rhode Island 1,052,567 6,019,295 — 176,906 22.4 0.0 3.8 $37.80 — $1,170,233 $1,170,233
Tennessee 6,346,105 65,814,848 — 1,934,286 22.4 0.0 6.8 $37.80 — $12,795,301 $12,795,301
Vermont 625,741 108,881,278 3,200,000 3,200,000 35.4 180.9 180.9 $34.57 $30,566,151 $30,566,151 —
Virginia 8,001,024 71,216,930 — 2,093,052 22.4 0.0 5.9 $37.80 — $13,845,539 $13,845,539
West Virginia 1,852,994 125,961,220 — 3,701,976 22.4 0.0 44.8 $37.80 — $24,488,573 $24,488,573
Wisconsin 5,686,986 154,493,465 650,000 4,540,533 30.8 3.5 24.6 $37.17 $5,806,053 $40,557,811 $34,751,758
United States 308,745,538 2,152,994,723 9,268,000 63,276,105 24.7 0.7 5.1 $39.54 $81,467,642 $503,962,019 $422,494,377
1 These are calculated only for nonreserved forestlands, i.e., those that are NOT legally prohibited from timber harvesting or management. 2 Based on USDA NASS 2010 Maple Syrup Crop Report.
3 These figures are calculated by multiplying the number of potential taps by 2.94%, the utilization rate achieved in Vermont. 4 Based on the average production per tap for each state for 2007–2009 as seen in the 2010 NASS Maple Syrup Crop Report.
Journal of Agriculture, Food Systems, and Community Development ISSN: 2152-0801 online
www.AgDevJournal.com
Virginia could also expand production aggressively. The per capita consumption levels necessary in these states range from 4.5 oz. (133.1 ml) to 6.6 oz. (195.2 ml) per person, which are certainly achiev-able levels, especially if any efforts are put into marketing local syrup to each state’s citizens and businesses.
There are other states that have large populations and a much greater resource of tappable maple trees, such as Michigan, New York, Pennsylvania, and Wisconsin. If these states were to expand to the same levels as Vermont, the consumption levels needed to sell all the syrup locally would be much higher, between 14 oz. (414 ml) and 25 oz. (739 ml) per person. Since it would be more diffi-cult to sell all of the additional syrup locally, pro-ducers in these states would have to sell some of their syrup in barrels to large packaging companies. Bulk prices are strongly tied to global supply and demand, which is out of the control of individual producers. Therefore these states may not be able to expand as aggressively if global demand does not keep pace with supply, and prices fall to unprofitable levels.
Finally, states such as Vermont and Maine already produce much more syrup than can realistically be consumed locally. The majority of their syrup is already sold in bulk to large bottling companies, whose success is highly dependent on the national and global markets for maple syrup. Whereas the local food movement will help some of these pro-ducers sell their syrup to nearby residents and visi-tors, the dominant outlets for most of the syrup produced will continue to be elsewhere. Thus, expansion in these states will likely be curtailed if production outpaces consumption and bulk syrup prices fall.
Under the hypothetical scenario in which each state taps the same percentage of its trees as Vermont currently does, the U.S. maple industry could grow from approximately USD81 million to over USD500 million annually. It is important to realize that only 24% of total U.S. residents live in the 11 major maple producing states, while 52% live in the 25 states that contain a significant number of
sugar and red maple trees. Thus, roughly half of U.S. citizens will not have access to local syrup and must purchase it from other states or Canada. At current production levels, if U.S. residents only consumed maple syrup produced within the U.S., the average per capita consumption would be 0.7 oz. (20.7 ml), much less than the current figure of 2.6 oz. (76.9 ml). If the U.S. were to develop its maple industry in every state the way Vermont has, did not import any syrup from Canada nor export any throughout the world, the average consump-tion would have to increase to 5.1 oz. (150.8 ml) per person. Given that this figure is less than the per capita consumption in Quebec, it is not an unreasonable proposition. However, as previously stated, it is highly unlikely that any state could achieve the same levels of production as Vermont, let alone every state. Furthermore, barring any unforeseen and extraordinary political tensions or drastic fluctuations in the exchange rate with Canada, the U.S. will continue to import the majority of its syrup from Quebec. Thus, although the U.S. will likely increase its production and consumption of pure maple syrup, it will probably never achieve the levels as conjectured in table 1.
Scenario 2: What if Each State Produced All the Syrup its Residents Consume Locally
Whereas scenario 1 examines the increased con-sumption necessary for each state to tap the same percentage of its trees that Vermont does, scenario 2 assumes that per capita consumption levels will stay the same, yet all of the syrup will come from local sources. This scenario provides a more realistic target for many states to achieve. It calcu-lates the number of taps necessary, the correspon-ding utilization rate, and economic impact for each state to provide 2.6 oz. (76.9 ml) of maple syrup to each of its residents (see table 2). The same assumptions on production per tap and price per gallon of syrup are used for this analysis.
and shipped out of state. Thus, the average price per gallon received by producers is the lowest in Vermont and Maine, at USD34.57 and USD33.27, respectively. New Hampshire, New York, and Wisconsin are the only other states that currently have more taps than needed to provide their residents with 2.6 oz. (76.9 ml) of syrup each year.
On the opposite end of the spectrum, there are states with large populations and a limited maple resource that would have a difficult time trying to provide each of their residents with 2.6 oz. (76.9 ml) of syrup. The necessary utilization rates in New Jersey and Missouri at 6.1% and Illinois at 11.9% are beyond the levels that could reasonably be expected to be achieved. Thus these states must continue to rely on imported syrup to meet consumer demand. Individual producers in these states would have a difficult time just supplying their own customer base with syrup and therefore would have to purchase bulk syrup from other states in order to meet local market demand. This strategy is already practiced throughout the maple industry, creating better synergy between the large sugarmakers who are focused on production and the smaller sugarmakers who concentrate on the marketing of finished products.
There are several states that could easily develop their maple industries further by supplying the local markets for pure maple products. Connecticut, Massachusetts, Michigan, Ohio, and Pennsylvania all have existing maple industries and the
infrastructure in place to spur additional
development. With existing utilization rates ranging between 0.15% and 0.45%, these states would only need to tap at most 1.2% of their trees to supply 2.6 oz. (76. 9 ml) of local syrup to their residents. Particularly desirable places for expansion are states such as Connecticut that have an affluent population with a strong desire to purchase local food. Expanding production in these regions is one of the best ways to assure profitability for
producers. As evidence, producers in Connecticut sell most of their syrup retail and therefore command the highest average price of any state at USD59.23/gallon.
New York has the greatest number of potential taps, the largest population of any maple-producing state, and an extensive educational infrastructure already in place to enhance development. The industry has been growing in recent years and is poised for further expansion. Its utilization rate of 0.62% just barely allows the state to supply all residents with 2.6 oz. (76.9 ml) of syrup. However, previous studies have found that most of the syrup consumed in New York is purchased at grocery stores and comes from out of state (for example, see Chamberlin, 2008). New York is also a net importer of bulk maple syrup, as more bulk syrup is bought in and repackaged by individual
producers than is sold out of state (Farrell & Stedman, 2009). Thus, per capita consumption in New York is already well above 2.6 oz. (76.9 ml) per person, but much more research is needed to determine the actual figure. New York state government officials have recognized the
opportunity