Lincoln
University
Digital
Thesis
Copyright
Statement
The
digital
copy
of
this
thesis
is
protected
by
the
Copyright
Act
1994
(New
Zealand).
This
thesis
may
be
consulted
by
you,
provided
you
comply
with
the
provisions
of
the
Act
and
the
following
conditions
of
use:
you
will
use
the
copy
only
for
the
purposes
of
research
or
private
study
you
will
recognise
the
author's
right
to
be
identified
as
the
author
of
the
thesis
and
due
acknowledgement
will
be
made
to
the
author
where
appropriate
you
will
obtain
the
author's
permission
before
publishing
any
material
from
the
thesis.
Structure and pattern of native and
alien plant communities across local
and global scales
A thesis
submitted in partial fulfilment of the requirements for the Degree of
Doctor of Philosophy at
Lincoln University
by
Federico Tomasetto
Lincoln University, New Zealand
Declaration
Plant species data used in part of Chapter 2, Chapter 3 and Chapter 4 was collected by Hugh Wilson. Permission to use these data was given by Hugh Wilson to myself. The data references are provided in Chapter 2. Chapter 5 uses a database which contains relevant articles that I personally collected from several sources.
Some of the thesis material was also presented in Italian on the TV program "Tal-enti d’Italia" broadcast in Italy on the national Rai Due tv channel on 11th December
2012.
The following manuscript forming Chapter 4 has been published and it is freely available online as:
Tomasetto, F., Duncan, R. P. & Hulme, P. E.(2013) Environmental gradients shift the direction of the relationship between native and alien plant species richness.
Diversity and Distributions, 19:49-59. See Appendix K.
Abstract
Identifying and quantifying the abiotic and biotic factors that influence the structure and pattern of native and alien plant species communities is of crucial importance in invasion ecology. There is little knowledge of how these factors covary with dominant environmental gradients and affect the plant communities especially in heavily modified landscape.
In my thesis, I focus on how these factors covary with dominant environmental gradients and influence the composition and structure and richness patterns of native and alien plant communities on Banks Peninsula (New Zealand). The invasion of alien plant species frequently shows an alteration in the native community composi-tion and structure (e.g. increasing biotic homogenizacomposi-tion). The native-alien species richness relationship (NARR) is used here as an ecological indicator for assessing community invasibility. Factors underlying NARR are crucial for understanding community assembly and are here investigated across local scale (i.e. species com-munities), regional-landscape scale (i.e. Banks Peninsula) and global scale.
Using Banks Peninsula as a model system, I tested the relative importance of factors that drive the invasion process on the Peninsula and set this within a global context, using GIS, multivariate statistical techniques and spatial regressions to anal-yse how these factors interact with native and alien plant communities to determine composition and structure and richness patterns. The species richness relationship at local and regional-landscape scales is contextualised on a global scale using a meta-analytical approach to the considerable body of literature on NARR and so to clarify the so-called "invasion paradox", which has not been adequately quantified so far.
Across a heterogeneous environment such as Banks Peninsula, native and alien species communities were found to be spatially and ecologically segregated according to different responses, firstly, to land-use and -management and, secondly, to climate and environmental factors, both of which covary with elevational gradients. Both
positive and negative relationships between native and alien species richness can arise, with this outcome moderated by the effects of land-use history and manage-ment. Globally, a significant positive NARR was found with plot size consistently the best predictor. For studies sub-grouped by plot size, NARR increased positively and significantly with increasing plot size.
Across Banks Peninsula, high levels of human-related disturbance offer the best conditions for the spread of alien species and for an increased homogenization effect of the native community. In areas characterized by high intensity levels of land-management, biotic homogenization is stronger and a more serious problem than in less managed areas. Across Banks Peninsula, negative NARR can be attributed, not to biotic resistance, but mainly to the shift in community types as a consequence of land-use history and management along elevational gradients. Globally, NARR is overall positive and scale dependent. However, negative and positive NARR can occur within the same plot size and across the same landscape, depending on the plant community and the underlying gradients examined.
It is therefore important to take into account human-related factors or proxy measures (e.g. land-use history and management) when studying drivers of plant invasions, because these are the primary factors in explaining composition and structure and richness patterns of native and alien species communities at local and regional-landscape scale.
Acknowledgements
Without the support of the incredible people who accompanied me in my work over these three years, this thesis would not have been possible. It has been an honour to work with you all. THANK YOU! GRAZIE!
I would like to express my gratitude to my supervisors Profs. Richard Duncan and Philip Hulme for the skills they taught me during my Ph.D. They have dedicated to me many patient hours of discussion, advised me on several different analytical approaches and techniques, developed ideas and interpretation of results, and gave guidance on writing not only for scientific publications. I feel lucky to have had such a challenging and encouraging supervisory and mentoring team. So, thank you all (Grazie a tutti!).
This project involved primarily a database composed by an inestimable floristic survey and a great deal of GIS data. I am extremely grateful to an incredible and passionate botanist such as Hugh Wilson who conducted this comprehensive and historical floristic survey. Thank you so much, Hugh!
For the construction of the GIS database, which I could not have done alone, I would like to thank: Ian Phillipps for digitalizing the maps of the geology and urban areas of the Banks Peninsula; Andrew Tait for providing me with the climate data maps; Brad Case and the Lincoln University Spatial Ecology Group for GIS support; Takayoshi Ikeda (aka Tak) passing on to me his passion for statistics (and being in front of my R scripts issues with me). Thanks a lot to all of you!
This project also involved the collection and the analysis of studies from numer-ous authors. I am very thankful to: Robyn Butters (aka data thief) for her help in database creation, the many authors whose research was included in the meta-analysis database and Marc Mazerolle for implementing his statistical package for me. Thank you everyone!
A special thanks also to my colleagues and friends in the Plant Biosecurity Group (aka The Weeds Lab) past and present. In particular (but not in order of importance) to: Kirsty McGregor, Elizabeth Wandrag, Jennifer Pannell, Tasha Shelby and Kevin McGinn. It has been a lot of fun to share offices, weekly meetings, lunches and complaints about bureaucracy with all of you! Thank you also to: Jon Sullivan, Timothy Curran, Melanie Harsch, Hazel Gatehouse and Nicolas Gross. Thank you team!
Finally I wish to thank everybody who at one point or another gave useful sug-gestions and comments on the work presented in this thesis, including Jessica Firn, Susan Wiser, Petr Pyšek, Fabio Attorre, Nicolas Gross and Gessica Gurevitch.
I am extremely grateful to my best friend, Denis Walker, who has been extremely supportive and understanding along with his incommensurable job of proof reading. Grazie amico mio!
Abbreviations
Abbreviation Definition
AIC Akaike Information Criterion GIS Geographic Information Systems GLS Generalized Least Squares LINZ Land Information New Zealand MANOVA Multivariate Analysis of Variance
NARR Native-Alien Richness Relationship
NIWA National Institute of Water and Atmospheric Research NMDS Non-Metric Multidimensional Scaling technique
NODF Nestedness metric based on Overlap and Decreasing Fill NZLRI New Zealand Land Resource Inventory
NZ REC New Zealand River Environment Classification OFD Occupancy Frequency Distribution
RS Remote Sensing
RMSE Root Mean-Squared Error ROR Rank Occupancy Rate
VBA Visual Basic for Application VIF Variance Inflation Factors
Contents
Declaration iii
Abstract v
Acknowledgements vii
Abbreviations ix
1 Introduction 1
1.1 The problem of plant invasions . . . 2
1.2 The invasion history of New Zealand . . . 3
1.3 Banks Peninsula (New Zealand) as a model system . . . 9
1.4 Native-alien species richness relationship: NARR . . . 13
1.5 Rationale and aims of the project . . . 16
1.6 Nota bene . . . 19
2 Banks Peninsula Geodatabase 20 2.1 Abstract . . . 21
2.2 Introduction . . . 21
2.3 Materials & Methods . . . 24
2.3.1 Study area . . . 24
2.3.2 Plant species data . . . 25
2.3.3 Processing spatial data layers . . . 27
2.3.4 Climate and bioclimatic layers . . . 31
2.3.5 Human-related layers . . . 33
2.3.6 Environmental layers . . . 33
2.3.7 Statistical analysis . . . 34
2.3.7.1 Sampling methods . . . 34
2.3.7.2 Data validation and exploration . . . 36
2.4 Results . . . 37
2.5 Discussion . . . 46
3 Community Composition and Structure 50
3.1 Abstract . . . 51
3.2 Introduction . . . 52
3.3 Materials & Methods . . . 54
3.3.1 Study area . . . 54
3.3.2 Floristic data . . . 54
3.3.3 Explanatory variables . . . 55
3.3.4 Statistical analysis . . . 55
3.3.4.1 Plant species composition patterns and processes . . 55
3.3.4.2 Plant species distribution and structure . . . 57
3.4 Results . . . 59
3.4.1 Plant species composition patterns and processes . . . 59
3.4.2 Plant species distribution and structure . . . 64
3.5 Discussion . . . 68
3.6 Conclusion . . . 74
4 Plant Species Richness Patterns 75 4.1 Abstract . . . 76
4.2 Introduction . . . 77
4.3 Materials & Methods . . . 79
4.3.1 Study area . . . 79
4.3.2 Floristic data . . . 79
4.3.3 Explanatory variables . . . 79
4.3.4 Statistical analysis . . . 79
4.4 Results . . . 80
4.4.1 Relationships between native and alien species richness . . . . 80
4.4.2 Determinants of native and alien richness . . . 83
4.5 Discussion . . . 87
4.6 Conclusion . . . 90
5 NARR: Global Meta-analysis 92 5.1 Abstract . . . 93
5.2 Introduction . . . 94
5.3 Materials & Methods . . . 100
5.3.1 Literature search . . . 100
5.3.3 Moderators . . . 103
5.3.4 Data analysis . . . 104
5.3.5 Effect size . . . 105
5.3.6 Meta-regression: multi-model inference approach . . . 107
5.4 Results . . . 108
5.5 Discussion . . . 115
5.6 Conclusion . . . 119
6 Conclusion 121 6.1 Thesis aims . . . 122
6.2 What do the findings mean for the broader field of invasion ecology? 122 6.2.1 Land-use history and management: effects on species community structure and patterns . . . 122
6.3 What are some of the limitations of the studies conducted? . . . 126
6.3.1 Sampling methods: time and cost are significant limitations . 126 6.3.2 Data availability, direct measurement and spatial resolution of layers . . . 128
6.4 Are the results likely to have broad application in other systems? . . . 130
6.4.1 Conservation programs after agriculture abandonment . . . . 130
6.4.2 Environmental drivers in heterogeneous landscape and applicability to other landscapes . . . 130
6.4.3 NARR scale dependence and factors related . . . 131
6.5 What is the broader ongoing research questions arising from the work?132 6.5.1 Sampling methods and GIS analysis for plant species and envi-ronment . . . 132
6.5.2 NARR and biological homogenization: where do we go from here? . . . 133
Appendices 136
A Banks Peninsula survey datasheet sample 136
B GIS model and layers 138
C Visual Basic code for distance in ArcGIS 140
E Cleveland dot plots explanatory variables 144
F Multi-panel scatterplots explanatory variables 148
G SAC explanatory variables 150
H Banks Peninsula: community types 154
I Elevational ranges plant species 158
J Spatial patterns community types 160
K Native-alien species richness publication 162
L Meta-analysis database 174
M Cleveland dot plot effect size for five datasets 188
N Funnel plot effect size 190
O Relationships NARR and moderators 192
P Total heterogeneity all studies and sub-groups 194
Q Checklist of native and alien species 196
R GIS model Banks Peninsula geodatabase 229
List of Figures
1.1 Banks Peninsula forest cover changes . . . 10
1.2 Origins Banks Peninsula alien plant species . . . 12
2.1 Schematic map of Banks Peninsula and floristic survey . . . 26
2.2 GIS model Banks Peninsula geodatabase . . . 28
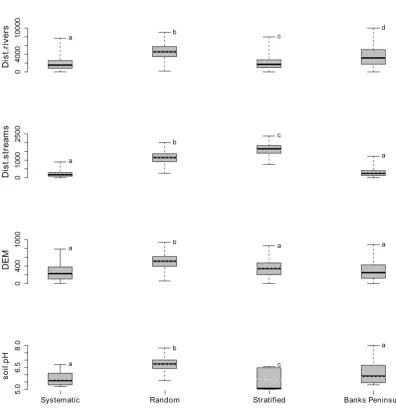
2.3 Box and whisker plots of the climatic variables using three different survey methods . . . 38
2.4 Box and whisker plots of the human-related variables using three different survey methods . . . 39
2.5 Box and whisker plots of the environmental variables using three different survey methods . . . 40
3.1 NMDS ordination plant communities . . . 60
3.2 Banks Peninsula community types and factors . . . 63
3.3 OFD and ROR analyses . . . 66
3.4 Similarity index along elevational bands . . . 67
4.1 Native-alien plant species richness relationship . . . 82
4.2 Native-alien species richness relationships within elevational bands . 87 5.1 Mean effect size NARR worldwide . . . 110
5.2 Mean effect size in habitats, ecosystems and biogeographical areas . 115 A.1 Banks Peninsula floristic survey spreadsheet . . . 137
E.1 Multi-panel Cleveland dot plot climate data . . . 145
E.2 Multi-panel Cleveland dot plot human-related data . . . 146
E.3 Multi-panel Cleveland dot plot environmental data . . . 147
F.1 Multi-panel scatterplots of 11 explanatory variables . . . 149
G.1 Spatial autocorrelation coefficient (Moran’sI) of climate data . . . 151 G.2 Spatial autocorrelation coefficient (Moran’sI) of human-related data 152
G.3 Spatial autocorrelation coefficient (Moran’sI) of environmental data 153
I.1 Elevational ranges native and alien species . . . 159
J.1 Spatial patterns community types . . . 161
M.1 Cleveland dot plot of the mean effect size datasets . . . 189
N.1 Funnel plot effect size . . . 191
O.1 The relationships between NARR and five significant moderators . . . 193
List of Tables
2.1 Characteristics of 20 explanatory variables in the Banks Peninsula
reference dataset . . . 30
2.2 Summary statistics of 20 explanatory variables in the Banks Peninsula reference dataset . . . 31
2.3 Spearman’s matrix systematic sampling method first part . . . 42
2.4 Spearman’s matrix systematic sampling method second part . . . 43
2.5 Variance inflation factors in systematic sampling method . . . 44
2.6 Spatial autocorrelation in systematic sampling method . . . 45
3.1 NMDS of significant explanatory variables . . . 64
4.1 Determinants of native alien plant species richness . . . 85
4.2 Total native alien species richness within elevational bands . . . 86
5.1 Results of random-effects models with moderators and covariates . . . 111
5.2 Results of random-effects multiple regression models . . . 112
5.3 Results of random-effects models between studies sub-grouped by plot sizes . . . 114
C.1 VBA script for distance GIS . . . 141
D.1 RMSE Digital Elevation Model downscaled . . . 143
P.1 Total heterogeneity all studies and sub-groups . . . 195
Q.1 Checklist of native and alien species . . . 197
Introduction
1.1
The problem of plant invasions
The invasion of alien plant species is an important global change issue. It is widely accepted that the invasion of alien plants involves serious ecological losses (Hobbs and Humphries,1995;Dukes and Mooney,1999;Pimentelet al.,2011) with resulting challenges for the conservation of biodiversity and natural resource. The invasion of alien plant species, in fact, frequently shows an alteration in the composition and diversity of the native species communities (Vitousek et al.,1997), increasing, for example, local extinction rates and promoting biological homogenization (Wiser
et al.,1998;Hulme,2003;McKinney,2006; Pyšek and Richardson,2006;Lambdon
et al.,2008; Winteret al.,2009) or altering the species community structure, for
example, leading to nested distributions where the alien species might be more nested than native species (Foxcroft et al., 2007;Vilá et al., 2009a;Baetenet al.,
2012) or altering the structure and functioning of whole ecosystems (Pyšek and Richardson,2010).
Plant invasions also impose economic costs (Simberloffet al.,2013). Pimentel
et al.(2005) estimated that the economic impact of invasive alien plant species in
the USA was $34 billion per year. An attempt at quantifying the economic cost of naturalized plant species which had become invasive to New Zealand (i.e. weeds;
sensuPyšek et al.,2004) was undertaken by Williams and Timmins (2011). They categorised the costs in 2008 as defensive expenditure, which is the financial cost of resources devoted to preventing pest plants from entering the country and managing the populations of those already here, and as the loss of economic output, and found that the amount spent to protect the country against weeds came toc. $130 million per year. Bourdot et al.(2007) determined that 187 pastoral weeds, classified as perennial or annual grasses and forbs, shrubs, trees, and plants with bulbs or tubers, are present in the nearly 12 million ha of agricultural land grazed by livestock in New Zealand. Weeds represent a threat not only to natural habitats but also to managed ecosystems (Pimentel et al., 2011) and have economic consequences for human activities reducing pastoral output and adding significant costs to production, as has been found in the United States (Duncan et al., 2009), in China (Brock and Wu,
lack of both objective data on the impact of weeds on pastoral production and the lack of accurate and comprehensive national census of the main problem species.
1.2
The invasion history of New Zealand
Alien species have undoubtedly invaded New Zealand in a way that is not comparable elsewhere in the world (Leeet al.,2006). New Zealand, a historically isolated and ancient landmass, has in fact suffered severe damage from invasive species, especially by temperate grassland species from Europe and North America (Fenner and Lee,
2001). A comparison with Australia, a continental area 29 times larger than New Zealand, gives an idea of the current level of invasion. In New Zealandc. 28000 alien species have been intentionally or unintentionally introduced since 1840 (Williams and Cameron,2006), with the same number being found in Australia (Diezet al.,
2009b). However, in proportion to the unit area and the total flora, New Zealand has more naturalized plant species than Australia (Diezet al.,2009b). Today, it is placed among the most highly invaded areas on earth (Pimentelet al.,2011;Williams and Timmins,2011) with naturalized alien seed plant species outnumber native species (Williams and West,2000;Wilton and Breitwieser,2000;Popayet al.,2002;Williams and Newfield,2002;Williams and Timmins,2011).
Introductions of alien species into New Zealand are obviously dependent on human-assisted transportation (Leeet al.,2006). Introduced plants (but also animals) intentionally enter the country in sufficient quantity for commercial reasons (Lee
et al., 2006). Not only in New Zealand but also elsewhere, it is recognised that
species for gardening and urban landscaping often become invasive (Hulme,2007;
Niinemets and Peñuelas, 2008) and human-related activities disperse propagules over large areas where suitable sites for establishment might be more likely to be found (Wilson et al., 2009; Hoffmann, 2010). In New Zealand, regional human population densities and the number of people in the region are also positively related to the number of naturalized plant species (Allan,1937;Webbet al.,1988;
Sullivan et al., 2004; Williams and Cameron, 2006). This is also verified in the rangelands in USA (Lonsdale and Milton, 2002) and across Europe (Pyšek et al.,
high frequency of human visits to reserves, dumping of garden waste and foraging of birds that disperse seeds of alien plants. Moreover, Aikio et al. (2012) found out that forest and grassland contain similar number of alien species and roadside and lakeshore that are respectively the most and the least invaded habitats in New Zealand.
Habitat modification, as a consequence of disturbance, is an additional important factor in the invasion process. According to Craine et al. (2006), New Zealand habitats can be considered a collection of niches: (1) novel (i.e. most recent in origin, less broad in space and more discontinuous in space or time) and, (2) core niches (i.e. with wider spatio-temporal extent and/or continuity through time). With the occurrence of natural and human-related disturbance, novel niches have been created and these niches might be more prone to be invaded by alien plant species (Craineet al.,2006). It is in fact widely accepted that disturbance promotes invasion (Crawley,1987;Hobbs,1989; Mack and D’Antonio,1998;Godfreeet al.,2004).
The major and historical disturbances for the New Zealand’s flora that influence the composition and structure and richness patterns of plant communities are fre-quent fires or large mammalian herbivores (Mark,1965;Buchanan,1968;Scottet al.,
1988;Calderet al.,1992;Yeates and Lee,1997;Mark and Dickinson,2003;Ewans,
2004;Espie and Barratt,2006). Naturally, changes in ecosystems composition and structure and functioning due to fire cycle occur elsewhere, both in continental and in insular systems (D’Antonio and Vitousek,1992;Brookset al.,2004;Bradley and Mustard,2006). These disturbances can be seen as consumers of vegetation affecting the native flora that evolved in the absence of both fire and herbivores (Bond and Keeley,2005). Especially in tussock grasslands, the introduction of both of these factors during Polynesian (Maori) and European settlement periods had dramatic impacts on plant community composition and structure (Mark,1965;Calderet al.,
1992;Mark,1994;Roseet al.,1995;Yeates and Lee,1997;Walker and Lee,2000;
Duncanet al.,2001;Day and Buckley,2011). Burning frequency, in fact, increased during European settlement to maintain grasslands for grazing, primarily by sheep (Ovisspp.;Buchanan,1968;Mark and Dickinson,2003). Burning is still used as a land-use management tool to enhance growth of palatable species and clear areas for oversowing of alien pasture species, but with less frequency nowadays (Scottet al.,
1988;Espie and Barratt,2006).
for agriculture and forestry (McGlone,2001). These human-related activities had consequences for the whole plant community, ultimately leading to invasion by alien species (Wilson and Meurk,2011). Although in New Zealand, native forests have historically been considered widely resistant to invasion (Wiser and Allen,2006), alien plant invasion is occurring. This is not controlled by disturbance, substrate and soil fertility (Wiser et al., 1998) but instead by species richness (Wiser and Allen,2006). In general, species richness has a positive effect on invasion. Possible explanations include: increased temporal and spatial heterogeneity of abiotic and biotic conditions within species-rich sites (Wiseret al.,1998); or the positive effects of arbuscular mycorrhizas (Wiser and Allen,2006).
So, what kind of plant communities in New Zealand shows high levels of plant invasion? The interactions of human-related disturbance (e.g. fire, grazing and agri-culture) together with propagule pressure are likely to homogenize the composition of the flora (Mack, 1989). In particular, temperate grasslands are well suited for growing several crop species and pasture and these are among the most susceptible communities to invasion (Mack,1989). According toMack (1989), grasslands in countries that were recently colonized (e.g. North, South and West America, Aus-tralia and New Zealand) are predestined to be devastated by plant invasions. In New Zealand and only after 1970s, the spread and impacts of several alien plant species became too obvious to be ignored (Lee et al., 2006). Specifically, the continental climates in New Zealand have been probably the areas most affected by invasion of alien plant species (Craineet al.,2006). In addition, a wide range of annual, biennial and perennial plant species, grasses and forbs from California and the Mediterranean areas have invaded low-rainfall areas over the last 150 years (Walker and Lee,2000;
Craineet al.,2006).
In this context, tussock grasslands are one of the most modified and invaded habitats in New Zealand (Mark,1994;Duncanet al.,2001;Day and Buckley,2011). From late 1800s when Europeans arrived, they started land-use activities, such as pastoral farming, introducing palatable alien plant species to tussock grasslands to increase domestic stock, mainly for sheep and cattle, and to prevent soil erosion due to overgrazing (O’Connor,2003). The alien species that Europeans introduced into New Zealand were either pre-selected for their facility to grow in pastures that were fertilized and/or they were grown together in sward with Trifoliumspp. (Craine
et al.,2006). In New Zealand, native species provided little in this respect. In fact,
associated with high nutrient supply (Craine and Lee, 2003; Craine et al., 2006;
Grosset al.,2013). In addition, New Zealand flora has high level of endemicity that is predominantly perennial and slow-growing (Meurket al.,1989; Wardle,1991).
As consequence, the fast-growing alien plant species can outcompete these slower-growing native species and this has led to competitive exclusion and declines in native species in localised areas (Lord,1990;Roseet al.,1998;Walker and Lee,2000;
Walker et al.,2003). For instance, studies of vegetation change over the last four decades in the high country tussock grasslands of the South Island in New Zealand have undergone major changes in composition and structure and richness patterns of native and alien plant communities, generally towards increased dominance by alien species and reductions in the richness and abundance of native species (Scott
et al.,1988;Treskonova,1991;Rose et al., 1995;Johnstoneet al.,1999;Duncan
et al., 2001;Day and Buckley, 2011). Alien grass and herb species were sown on
land cleared from forest and fern (Cockayne,1919;O’Connor,1982;Duncanet al.,
2001;Day and Buckley,2011). Annual and biennial life-forms are well represented among alien plant species, together with wind-dispersed perennials that effectively colonize disturbed areas (Craineet al.,2006). Agrostis capillaris,Rytidospermaspp.,
Anthoxanthum odoratum,Trifolium dubium,Lolium perenne,Poa pratensisand several clover species were the most sown herbaceous species (Williams and Cameron,2006;
Meurk,2008).
Another relevant factor that may drive the level of invasions can be found in the high or low grazing levels. Several mammalian herbivores are now widespread on the mainland, with most of the native grassland communities being grazed mainly by the domestic sheep (Ovis aries) from the valley floors to alpine regions (Burrows and Wilson,2008). Alien species are more adapted to grazing and browsing disturbance, due to different traits such as chemical defences (e.g. HieraciumandAnthoxanthum) or physical defences (e.g. Ulex europeaus) or having a grazing-tolerant growth form (e.g. Agrostis) (Craineet al.,2006). Not only grazing but also human-related disturbances that are associated with settlement and agriculture maintain open ground that facilitates the spread and colonization of alien species (Craine et al.,
2006). In this ecological context, alien species are increasingly displacing native species in grassland communities. In particular, areas that are grazed by sheep and cattle frequently contain dominant alien grass species (Leeet al.,2006).
One well documented example can be found in the impact of European pastoral-ism on the native grasslands of the eastern South Island (O’Connor,1982; Mark,
resulted in a marked decline of native species richness, such asChionochloaspp., and an increase of the abundance of aliens, such asHieraciumspp. [Treskonova(1991); c.f. Scottet al.(1988);Roseet al. (1995)]. Currently, few areas of native grassland
remain without some degree of modification[Ewans(2004) and citations therein].
What are the consequences for New Zealand grassland if areas are closed to grazing? An example can be found in a study by Rose et al. (1995), where the authors examined different grazing histories (continually grazed versus ungrazed) in short tussock grassland between 700 m and 1350 m a.s.l.. In general, there was a trend towards invasion by alien species such asAgrostis capillarisandHieraciumspp. and a decline in native grassland species such as short tussock grasses (e.g. Festuca
spp. andPoaspp.). However, the effects of grazing history varied along aspect and elevation. Another example is given byEwans(2004). The author highlighted how the extent of floristic changes is greater at wetter sites and/or at the sites with the longer period since the enclosure to grazing. He suggested that if we remove grazing this results in an increase in the cover of naturalized plants, especially grass species, and a decrease in the number and/or cover of native herbaceous species (Ewans,
2004). Several studies have also found that alien grass species, such asAgrostis capillarisandAnthoxanthum odoratum, increase in tussock grasslands after grazing cessation because these alien species are successful at colonising novel niches and disturbed habitats (Rose et al., 1995,1998;Groveet al.,2002;Espie and Barratt,
2006) while alien plant species such asHieraciumspp. increased locally even with or without grazing (Rose and Frampton,2007).
Consequently, there is uncertainty about the extent to which recent changes in tussock grassland have been driven primarily by land-use history and management (i.e. historical or recent pastoral activities) or whether other processes are more important in driving vegetation change (Duncanet al.,2001). Teasing apart these drivers is an important part of invasion ecology and is the focus of my particular work on Banks Peninsula.
introduction of sheep, cattle and feral rabbits, and the increase in burning frequency associated with stock grazing, the high country tussock grasslands of the South Island, New Zealand, have also undergone major changes in vegetation composition and structure. One of the most dramatic results was the widespread development of tussock grasslands with the replacement of tall tussock (Chionochloaspp.) grassland with short tussock (Festuca novae-zelandiae) grassland and consequently a shift towards low-growing alien species dominated communities (Cockayne,1919;Zotov,
1947;Connor and Vucetich, 1964; Connor, 1965;O’Connor, 1982; Burrows and Wilson, 2008; Meurk, 2008). Other studies in grasslands in Fiordland between 900 and 1600 m a.s.l. (Rose et al., 1998), in Central Otago below 460 m a.s.l. (Wilsonet al.,1989) and in the Harper-Avoca Valley between 700 and 1350 m a.s.l.
(Roseet al.,1995) found that native and alien species composition along with the
proportion of alien in the flora reflected an elevational gradient. Wilson (1989) found that in semi-natural to high managed pasture areas of the South Island in New Zealand, native and alien species communities composition differed spatially and ecologically and these were differently related to environmental factors (e.g. elevation, soil fertility and water) as other studies have found in other modified landscapes worldwide (Oneal and Rotenberry, 2008; Brown and Boutin, 2009;
Otýpková et al.,2011). A study of plant species composition and structure in the Canterbury Plains in the South Island in New Zealand conducted byMeurk(2008) identified 9 vegetation types that reflect the relationships between plants species and environmental gradients (mainly different soil conditions). Similar to other case studies (Wilson,1989;Wiser and Buxton,2009),Meurk(2008) found that native and alien plant species segregate differently along environmental gradients resulting in different spatial and ecological patterns, with degraded native vegetation opposed to broadly extended alien species communities.
for understanding the processes that govern community assembly across a variety of ecosystems".
1.3
Banks Peninsula (New Zealand) as a model
sys-tem
The Banks Peninsula (c. 1000 km2) on the south-east coast of the South Island, New Zealand, is an example of an area in which a wide range of native and alien plant species and animals coexist within a landscape of both natural and managed status. The highly varied topography (e.g. altitude ranges from 0 to 920 m a.s.l.) is characterized by soils that are typically well drained and of moderate to high fertility (Speight, 1943; Williams, 1983; Sewell et al., 1992; Wilson, 2009), with annual rainfall ranges from 600 mm at the driest low elevation sites to 2000 mm at higher elevations and a mean daily temperature ranges from 8 to 13◦C.
1.
INTRODUCTION
10
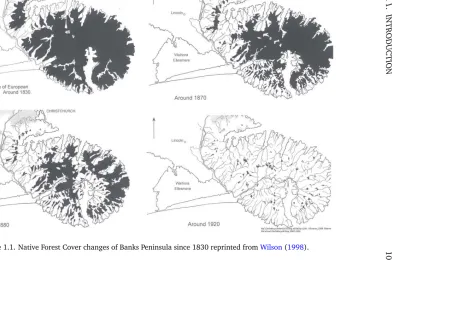
In the mid-1800s forest was extensively cleared and converted to grassland for farming, such that by 1920 less than 1% of the original forest cover remained (Figure 1.1;Wilson,1998;Schmechel,2005;Wilson,2008,2009). In less intensively farmed areas, typically at higher elevation and in less-accessible locations, forest clearance and burning has led to forest replacement by grassland dominated by native tussocks. On more accessible and productive, typically low- to mid-elevation, sites more intensive burning, oversowing with pasture species, fertiliser addition and livestock grazing led to the removal of native tussocks and their replacement by grasslands dominated almost entirely by improved alien pasture species. These areas converted for agriculture, farming and forestry are a typical feature of the natural history of the South Island (Weekset al., 2013) where, as a consequence of human-related disturbances, native tussock grasslands are under threat (Rose
et al., 1998;Ewers et al., 2006) and these communities may show high levels of
plant invasion. Several New Zealand studies have in fact demonstrated that levels of invasion may be directly affected by disturbance from fire and/or grazing (Rose
et al.,1995; Meurket al.,2002; Bellingham and Coomes,2003).
In this context of human-driven conditions, Banks Peninsula now supports a large number of introduced species mostly of European origins (Figure 1.2). These species are now naturalized or cultivated and found in road verges, farmland, plantations, and residential areas. Nowadays, 285 species classified as fully naturalized (sensu
1.
INTRODUCTION
12
During the last several decades some areas of less intensively managed farmland have been abandoned and left to regenerate back to native shrubland and forest. The present landscape comprises a mosaic of about 10% original or regenerated native forest, 5% native shrubland (less than 6 m tall) and 85% grassland ranging from less-modified areas of semi-native tussock grassland, open shrubland, fernland, sedge and rushland to highly-modified pastures dominated by alien grasses (Wilson,
1994,1999;Wiser and Buxton,2008;Wilson,2009;Wiser and Buxton,2009). Given this coexistence of semi-natural and highly managed habitats, Banks Peninsula provides an outstanding opportunity for the development of suitable ecological model systems for analysing the effects of climate, environmental and human-related factors on native and alien plant species composition and structure and richness patterns. Testing the relative importance of various factors (e.g. climate, elevation and land-use) that may drive the invasion process on Banks Peninsula at local-regional scale, and setting this within a global context (i.e. global scale), is the subject of my thesis.
1.4
Native-alien species richness relationship: NARR
An ecological indicator for assessing community invasibility (Levine et al., 2002) can be found in the relationship between native and alien plant species richness (hereafter NARR). This measure, which has been a main focus of ecological research, primarily determines the vulnerability of biological communities to colonization and dominance by introduced species (Fridley,2011), the vulnerability to invasion (Levine and D’Antonio, 1999;Lonsdale, 1999;Richardson and Pyšek, 2006) and the likelihood of impacts on native species richness (e.g. biotic homogenization;
McKinney and Lockwood,1999; Lambdonet al.,2008;Winteret al.,2009).
While numerous studies have shown that the number of alien species establishing in a community is related significantly to the native species richness of that commu-nity[reviewed byLonsdale(1999)], the strength and direction (whether positive or negative) of the relationship often varies markedly among studies and there is an on-going debate as to whether such variation in the relationship between native and alien species richness can be subsumed under one theory or several (Fridleyet al.,
are more resistant to the establishment of alien plant species than species-poor com-munities (Elton,1958;Lodge,1993;Kennedy et al.,2002). However, other studies have shown the exact opposite, namely a positive NARR, which has been termed the biotic acceptance hypothesis (Stohlgren et al.,2006;Fridley et al., 2007; Bar-tomeuset al.,2012) because it indicates that sites with high native species richness are the most readily invaded by alien species where native and alien plant species covary with favourable environmental factors (e.g. resource availability, disturbance regime) leading to positive NARR (Levine and D’Antonio,1999). These contradictory relationships, in the context of a resident native community being invaded by alien species, have been termed the "invasion paradox" (Fridleyet al.,2007).
Other important factors, which operate at different spatial grains and extents, might influence the strength and direction of NARR. For instance, at plant-neigh-bourhood scale, the "Niche Differentiation Hypothesis" (MacArthur and Levins,1967) might explain the variation in sign and magnitude of NARR; while at large extents (i.e. large ecological gradients) the "Habitat Filtering Hypothesis" (Keddy, 1992) might drive the sign and magnitude of NARR. As well as differing in spatial grain and extent among studies, NARR might be expected to change through time depending on the different invasion stages [i.e. transport, colonization, establishment and spread sensu Theoharides and Dukes (2007)] where different factors determine invasion dynamics (Clark and Johnston,2011;Clarket al.,2013). For instance,Clark
et al.(2013) demonstrated, via simulation models, that temporal change of NARR
total species richness) is found, this may also lead to a positive NARR (Stohlgren
et al.,1999), although the mechanisms related to NARR for total species richness are
not clear (Davieset al.,2005). Abiotic factors such as environmental heterogeneity (i.e. habitat diversity) may also shape NARR. It may be the case that the number of coexisting species in a region is dependent on the magnitude of the habitat diversity within that region (Fridleyet al.,2007). Low habitat heterogeneity, limited resources which are completely used and more apparent effects of species competition lead to invasion resistance (i.e. negative NARR;Morgan,1998;Stachowiczet al.,2002;
Fridleyet al.,2007). In contrast, high habitat heterogeneity with a diverse species composition and environmental conditions lead to biotic acceptance (sensuStohlgren
et al., 2006) with a resulting positive NARR (Levine, 2000; Davies et al., 2005).
Covarying factors such as different habitat types, ecosystems and biogeographic regions may also change the sign and magnitude of NARR. For instance, open grasslands as well as riparian/wetlands zones may be more susceptible to invasion than forests due to the availability of light, water and nutrients (Stohlgren et al.,
1998,2002;Maskellet al.,2006;Pyšeket al.,2010a;Fridley,2011). The NARR may also vary across one or many ecosystems. Darwin(1859) andElton(1958) suggested that lack of intense interspecific competition on islands made these low-diversity ecosystems more susceptible to invasion compared with mainlands (Gimenoet al.,
2006;Pyšek and Richardson,2006;Stohlgrenet al.,2008). Human-related factors (i.e. disturbances) are also likely to be a key contributor to NARR variation (Herben
et al.,2004;Fridleyet al.,2007). NARR sign and magnitude may change according
to land-use history (e.g. positive NARR can be found in young forests converted from agricultural areas;Parkeret al.,2010) and land management intensity (e.g. negative NARR in semi-natural wetlands but no significant NARR in highly managed wetlands;
1.5
Rationale and aims of the project
Several studies have highlighted the importance of quantifying the factors that deter-mine the arrival, initial dispersal, and naturalization of self-sustaining populations, and their spread (Pimentelet al.,2001,2005;Viláet al.,2009b;Oreska and Aldridge,
2011) if we are to fully understand and tease apart the drivers of invasion and their ecological and economic implications. Although increasing attention has been given to this matter, it is generally accepted that there is little current knowledge of the factors promoting the naturalization of alien plant species (Duncan and Williams,
2002;Bellinghamet al.,2004;Theoharides and Dukes,2007;Hayes and Barry,2008;
Milbau and Stout,2008; Diezet al.,2009b). Distribution of alien, and also of native species, are influenced by a number of abiotic (mainly climate) and biotic factors (e.g. water, nutrients or livestock grazing;Pettitet al.,1995;Richardsonet al.,2000;Pyšek
et al.,2002;Arévaloet al.,2005;Prober and Wiehl,2012). Successful plant invasion
depends not only on the attributes of the invaders (Noble,1989;Bellingham and Coomes,2003) but also on aspects on the invaded ecosystem (Catfordet al.,2008;
Foxcroftet al.,2011;Pyšeket al.,2012). Studies have long determined that some ecosystems contain few alien species (e.g. tropical forests), while others contain many (e.g. warm-temperate regions;Lonsdale,1999;Pyšek and Richardson,2006). Focussing on the characteristics of the invaded ecosystem rather than on those of the invader is likely to be a more effective research strategy for understanding the processes of invasion (Hobbs and Humphries,1995), althoughFoxcroftet al.(2011) have suggested that attention should be paid to both.
Recent studies have advanced hypotheses about the changes in land-use and -management as they covary with climate and which are likely to be major drivers of alien species distribution patterns (Parkeret al.,2010), in contrast with native species distribution patterns. However, in a study byDidhamet al.(2005) that follows
between these two sets of drivers remains unclear (Evans and Gaston,2005;Evans
et al.,2005;Mariniet al.,2009;Polceet al.,2011;Mariniet al.,2012). Mariniet al.
(2009) tested whether the relationships between species and climatic/bioclimatic
factors and between species and human-related factors vary between native and alien species when other environmental variables are taken into account. They concluded that alien species richness was higher in areas with the most rich and diverse assemblages of native species and that there was a stronger response of aliens than natives in currently warm, urbanized, low-altitude areas than in cold, high-altitude areas where human population density was low. Evidence also indicated that the distribution of native and alien plant species across habitats was not similar, with invasive alien species being found more frequently in anthropogenically disturbed habitats (Chytrˇy et al.,2008b). In a heavily modified landscape, past and recent land use and management may be the primary factors in explaining not only alien species distribution patterns but also those for native species (Chapter 4). These human-related factors may, in fact, promote the establishment of alien species via alterations of the disturbance regime through fire and grazing (Hobbs and Huenneke,
1992; D’Antonio, 2000; Keeley et al., 2003), changes in soil nutrient status as a consequence of fertilization (Dukes and Mooney,1999;Radfordet al.,2010) and increased colonization pressure (sensu Lockwood et al., 2009) often by species that are associated with similar human-related disturbances. Hulme(2008,2009) demonstrated that native and alien plant species distributions may not respond similarly to environmental change. Hulme(2008) highlighted how this outcome is mainly due to the scale dependence of native and alien species distribution according to related climate and environmental factors. Within a region, local environmental drivers (e.g. habitat, propagule pressure and introduction history) influence native and alien species richness differently, while when the spatial grain increases (i.e. across regions), it is climate that influences both native and alien species richness (Hulme,2008).
My related study therefore seeks to determine how the structure and pattern of native and alien plant communities may be influenced by abiotic and biotic drivers that covary with dominant environmental gradients (i.e. land-use history and management and climate-environmental factors) on the Ecological Region of Banks Peninsula (New Zealand). Disentangling these drivers is an important part of general invasion ecology and is the focus of my particular work.
species in a heterogeneous landscape such as Banks Peninsula and how this may be best described according to available GIS data layers. In Chapter 2, I use these tools and statistical techniques (i.e. data exploration and validation) to verify both the quality and adequacy of available plant species data and the explanatory variables as GIS data layers which are then used in Chapter 3 and Chapter 4.
Having established in Chapter 2 a body of verified data along with the creation of a geodatabase, I then, in Chapter 3, use multivariate statistical techniques and specific analyses of species composition and structure to determine the interaction of native and alien plant species communities with climate, environmental and human-related factors along the environmental gradients of Banks Peninsula. Understanding how and why native and alien plant species distribution and community structure differ along these gradients with associated human-related factors is the focus of my research in this field of invasion ecology. In order to clarify issues of ordination and classification analysis and to understand if levels of invasion vary across communities in low or highly managed areas, two related questions need to be asked: (1) does invasion lead to distinct native and alien plant communities? and (2) do native and alien dominated communities segregate along abiotic (i.e. climate) or biotic (i.e. land-use history and management) gradients? As species invasions may alter community composition and structure, I then ask if and how alien species influence levels of homogenization and community dissimilarity within and across different plant communities, and how different environmental tolerances of native and alien species shape community structure and nestedness?
The native and alien plant species communities thus established are analysed in Chapter 4 using spatial regression methods to determine the relationship between species richness on Banks Peninsula and abiotic and biotic drivers such as climate, environmental and human-related factors. In this context, it is important to consider the following issues: (1) is the relationship between native and alien plant species richness shaped by variation in anthropogenic and environmental gradients and, if so, how strongly?; (2) do similar native and alien relationships hold in plant communities that have either experienced relatively high or low human impact and are respectively dominated by either alien or native species? and (3) what is the relative contribution of environmental and anthropogenic gradients to the relationship between native and alien plant species richness?
(Stohlgrenet al.,2006;Fridleyet al.,2007;Bartomeus et al.,2012). However, other studies have suggested that NARR sign and magnitude can be explained by the shift from biotic to abiotic drivers of plant community structure and that this is related to scale dependence of NARR (Fridley et al.,2007). Using the considerable body of international literature on NARR allowed me to examine this apparent contradiction and to examine, in Chapter 5, to what extent NARR on Banks Peninsula might mirror that observed worldwide. Using a meta-analytical approach combined with a multi-model inference within an information-theoretic approach, I also attempt to clarify and explain one of the fundamental questions in plant invasion ecology, that is the variability in the sign and magnitude of NARR at a global scale, the so-called "invasion paradox".
1.6
Nota bene
All chapters have been written as self-contained research papers and therefore some repetition in the introductions, methods and discussions may be found.
Chapter 2, Chapter 3 and Chapter 4 use data which is stored in the Banks Penin-sula geodatabase.
Chapter 5 uses a database containing relevant articles personally collected from several sources.
All literature cited in the thesis is given at the end of the thesis.
Banks Peninsula geodatabase
for very detailed and novel studies of invasion patterns and processes."
(David M. Richardson)
2.1
Abstract
The study of the distribution of plant species in relation to the spatial distribution of environmental predictors is essential in ecology and can be divided in two phases: data gathering and analysis. In this chapter, I focus on phase one and using GIS and spatial analysis I investigate: (1) which available GIS data layers may best describe a heterogeneous landscape such as Banks Peninsula (New Zealand) in the context of plant species distribution patterns; (2) which sampling methods (systematic, random and equal-stratified) can best provide a representative sample of the variation in climate, environmental and human-related factors across the Peninsula; (3) using the data sampled by the best sampling approach, if there is a protocol for data validation and exploration that avoids potential statistical violations. GIS automated workflows generated relevant data layers. Based on the results of the tests such as the variance ratioFtest and Wilcoxon rank-sum test, it was possible to rank the sampling methods for accuracy according to the following sequence: Systematic>Stratified> Random. A series of problems (i.e. outliers, colinearity, non-normality and spatial autocorrelation) was encountered in the data exploration of the systematic sampling approach. However, I identified a protocol that dealt with these issues and reduced the chance of drawing incorrect conclusions from the data and analysis.
Keywords: GIS, Remote Sensing, plant invasion, sampling design, data exploration.
2.2
Introduction
The need to understand the dynamics of species distributions in space and time is essential in ecology, and in particular in biological invasions where the spatial pattern of invasion is specific to a time, space and spatial scale (Theoharides and Dukes,
the form of a floristic survey that defines the area of investigation and the potential environmental factors that may characterize this area.
The Banks Peninsula comprehensive floristic survey was designed to find out as much as possible about the vegetation cover and species distribution patterns on the Peninsula (Wilson, 1992). But, if we are to fully understand species patterns within this area we need also to collect data on factors that might affect species distributions. The larger and more diverse the study area is the larger and the more variable is the dataset necessary for an adequate representation of its vegetation (so-called ecological representativeness;sensu Stohlgren et al., 2003b;Rew et al.,
2006;Role˘ceket al.,2007). Because factors underpinning plant species distributions patterns operate at different spatial and temporal scales (Collinghamet al.,2000), it is essential to identify their relative importance and emphasize a congruent spatial scale between the resolution of species and environmental factors. Bearing in mind this, there is often issues of discrepancy between map or layer resolution and spatial scales at which the ecological studies is conducted. In fact, environmental factors are usually available at a relatively coarse scale, but other factors (e.g. geological and lithological maps, soil moisture or soil nutrient content) may vary substantially on a much finer grain or be unknown (Role˘ceket al.,2007). To deal with this, we need to emphasize a congruent spatial scale between the resolution of species and environmental factors. Spatial scale is in fact important to both species distribution and related environmental data (Elith and Leathwick,2009). When studying their relationship, it is important that the grain (i.e. grid cell or polygon size) of the explanatory variables is consistent with the species data layers (Elith and Leathwick,
2009). However, in most cases around the world, as in Banks Peninsula, this kind of consistency is difficult to find.
For this, Geographic Information Systems (GIS), Remote Sensing (RS) and spatial analysis techniques are useful tools in landscape ecology and biogeography, as well as in invasion ecology. GIS and RS have emerged as distinct spatial data handling technologies with their own methods of data representation and analysis (Goodchild,1994). These technologies have attracted considerable interest in the field of modelling of plant species distribution in recent years. In the context of plant invasions, "these are paving the way for very detailed and novel studies of species patterns and processes" (Richardson,2004). Integrated GIS and RS have been successfully applied to detect and map the distribution of several alien plant species (e.g.Dark,2004;Rewet al.,2005;Higginset al.,1999;Evangelistaet al.,
Bradley and Mustard,2006;Heet al.,2011), their ecosystems (e.g.Deutschewitz
et al.,2003), their bio-climatic conditions (e.g.Rougetet al.,2004) and the drivers
affecting invasions (e.g.Rouget and Richardson,2003;Foxcroft et al.,2004;Pino
et al.,2005). For instance, climate, environmental (e.g. topography) and potential
human-related disturbance (e.g. land-use and propagule pressure) have been shown to influence alien species (e.g.Rouget and Richardson,2003; Pinoet al.,2005) and native species distribution (Deutschewitzet al.,2003;Dark,2004).
The ability to analyse, map and model plant species are just a few of the many advantages of using GIS and RS for this work. These technologies contribute to our understanding of the width dynamics of species patterns, and integrated with spatial analysis allow us to design objective, efficient sampling methods (e.g. random, systematic or stratified) and/or to evaluate their adequacy in capturing species and environment (Neldneret al.,1995). We tend to evaluate sampling methods especially when the study area is large and cannot be entirely sampled (Rewet al.,2006). For instance, opportunistic sampling method (i.e. samples collected from known localities or in easily accessible areas) may be preferred to unbiased methodssensuRewet al.
(2006), such as random or stratified random sampling, but the latter may fail to capture the spatial variation or spatial dependency of the environment, leading to difficulties in detecting spatial relationships or incorrectly inference statistical models (Legendreet al.,2002;Fortin and Dale,2005).
To achieve a representative sample of the population (e.g. the Banks Peninsula vegetation), the appropriate theories to guide sample design need to be based on an understanding of the geographical structure and ecological organization of plant communities with regard to the heterogeneity of the sampled vegetation type (Huebner,2007) or the environments associated with species occurrence (Stohlgren
et al.,2003b). For instance, an opportunistic sampling method is useful in defining
the breadth of environmental conditions that characterize each species location (i.e. environmental envelope;Jarnevichet al.,2007;Evangelistaet al.,2008). However, this non-objective sampling method has some limitations such as over-estimating species presence or missing species presence in localized random samples (Stohlgren and Schnase,2006;Fitzpatricket al.,2009).
In this chapter, I describe the GIS, RS operations and tools, and spatial analysis techniques I used to analyse the range of environments on Banks Peninsula associated with the floristic survey and to ask:
2. Is a systematic sampling scheme suitable for providing a truly representative picture of the Banks Peninsula environments?
3. Do the environmental variables extracted using this sampling approach violate any statistical assumptions?
2.3
Materials & Methods
2.3.1
Study area
Banks Peninsula (c. 1000 km2) on the south-east coast of the South Island, New
Zealand (between 43◦33’ - 43◦54’ S and 172◦37’ - 173◦7’ E), comprises the eroded remnants of two large shield volcanoes, creating a highly varied topography that ranges from sea level to 920 m above (Mt Herbert). Climate and soils of Banks Peninsula form a complex pattern. At a regional landscape-scale, climatic conditions are influenced by the prevailing north-easterly wind flowing across the South Island (Wilson,2009); at local scale, the diverse topography of the Peninsula and the effect of the open ocean influence the climate (Wilson, 1992). Annual rainfall ranges from 600 mm at the driest low elevation sites to 2000 mm at some higher elevation sites, and a mean daily temperature ranges from 8 to 13◦C. In combination with this fluctuating climate the surface of the landscape is constantly eroded by c. 38 km of permanent rivers (large natural permanent flowing water bodies) orc. 1228 km of streams (perennial or intermittent tributaries of permanent rivers) that descend the main valleys and gullies. Soils are derived from basaltic volcanic rock and loess (Sewellet al.,1992), and are typically well drained and of moderate to high fertility (Speight,1943; Williams,1983;Sewellet al.,1992; Wilson,2009).
concentrated in three major settlements: Akaroa, Diamond Harbour and Little River (Statistics New Zealand,2006). There is an extensive road network on the Peninsula both paved (c. 589 km) and unpaved roads (c. 313 km).
2.3.2
Plant species data
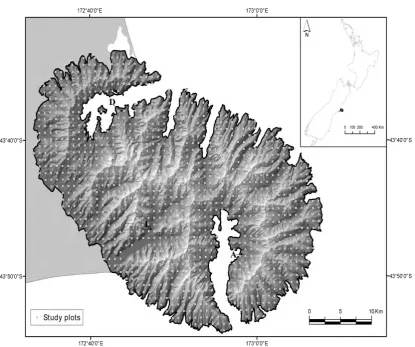
The data from the Banks Peninsula comprehensive floristic survey, conducted between 1983 and 1988, were originally used in a Protected Natural Areas (PNA) Programme report (Myerset al.,1987) describing Recommended Areas for Protection (RAPs) within the Banks Peninsula Ecological Region (Wilson,1992). The species composi-tion of all vascular and non-vascular plant species was recorded within each of more than 1300 6×6 m plots at each intersection of a regular 1000×1000 yard grid (c. 920×920 m) drawn over the entire Banks Peninsula and Ellesmere/Kaitorete
spit and each species was ranked according to its relative abundance in the plot (Figure 2.1 and Appendix A). For this thesis, I considered only the Banks Peninsula as study area and only vascular plant species and excluded 33 plots without any vascular species, leaving a total of 1227 plots. Plant species were classified as native or alien to New Zealand following the standard definitions [New Zealand Plant Names database - available at http://nzflora.landcareresearch.co.nz;Parsonset al.
(1995); Mahon(2007)]. Species nomenclature follows Flora of New Zealand(Moore and Edgar,1970;Healy and Edgar,1980;Allan,1982;Webbet al.,1988;Edgar and Connor, 2000). The 36 m2 plot size is consistent with recommendations for ade-quately sampling grassland vegetation in New Zealand (Hurst and Allen,2007) and Europe (Chytrˇy and Otýpková,2003;Otýpková and Chytrˇy,2006). I calculated the total number of native and alien species per plot, which I used as response variables (Chapter 4) or I transformed the relative abundance of native and alien species in the plot into its arbitrary percentage values (i.e. 0-100%) using the functionvegtrans
2.3.3
Processing spatial data layers
Bearing in mind that the complex Banks Peninsula landforms are associated with strong gradients of climate, land-use history and management along with the distribu-tion of human populadistribu-tion, I broke the objectives of this study down into measurable criteria and relevant data requirements. I then built a GIS geodatabase that contains plant species data and potential explanatory variables in the form of spatially explicit data layers within the extent of the Banks Peninsula floristic survey. Data were created and modifiedad hoc, stored and extracted using ArcGIS 9.3 software (ESRI,
2009) and Earth Resource Data Analysis System software (ERDAS IMAGINE 9.1;
Leica and Geosystems,2008). GIS and RS final results (output data and maps) are included in a folder at this thesis link (Appendix B) for further consultation.
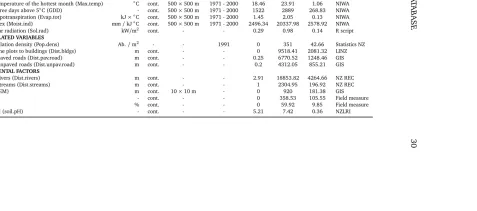
In the GIS environment, spatial analysis (i.e. GIS tools) and geoprocessing (i.e. modelling the spatial analysis) involved a systematic methodology and sequence of operations (i.e. managing geographic data and performing analysis) with the aim to best evaluate and interpret the results (e.g. output data or map views). For this part of the thesis, I developed a GIS model with customized workflows using the ModelBuilder application in ArcGIS 9.3, a large suite of tools and operations which I then used to build the Banks Peninsula geodatabase (Figure 2.2). I selected a first set of 20 available variables classified as:
• climatic and bioclimatic data
• human-related data
2.
BANKS
PENINSULA
GEOD
A
TABASE
28
Figure 2.2. GIS model from the Banks Peninsula geodatabase using ModelBuilder application in ArcGIS 9.3. Blue=input data; yellow=GIS tools; green=output data.
All of these data could potentially explain the pattern of plant species[Table 2.1 and Table 2.2; (e.g. Zimmermann and Kienast,1999; Carboniet al.,2010;Barni
et al.,2011;De-Albuquerqueet al.,2011)]. For each plot (using the plot centre), I
extracted the values of the listed variables ensuring that points did not lie on grid cell boundaries. For the distance-related data, I calculated the distance (m) of each point to variables such as built-up area (or buildings), paved or unpaved roads, rivers and streams. For all these data, I used a Visual Basic for Applications (VBA) script integrated with a Python script (available at http://www.ian-ko.com/) that I executed using ArcGIS 9.3 (Appendix C).
All data were projected from New Zealand Geodetic Datum 1949 (NZGD1949;
2.
BANKS
PENINSULA
GEOD
A
TABASE
30
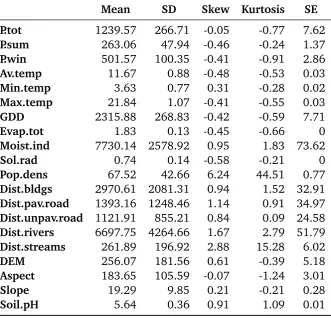
Table 2.1. Characteristics of 20 explanatory variables calculated for the 4108 points Banks Peninsula reference dataset. Abbreviations: Unit
=units of measurement; Type =variables classified as continuous (cont.); Resolution=spatial resolution of GRID maps; Year/Period of measurement; descriptive statistics and data sources. Acronyms are defined in the abbreviations page list.
Unit Type Resolution Year/Period Min Max SD Source CLIMATIC VARIABLES
Total annual precipitation (P.tot) mm cont. 500×500 m 1971 - 2000 628.19 1998.75 266.71 NIWA
Summer precipitation (P.sum) mm cont. 500×500 m 1971 - 2000 121.08 368.81 47.94 NIWA
Winter precipitation (P.win) mm cont. 500×500 m 1971 - 2000 258.21 715.32 100.33 NIWA
Annual mean temperature (Av.temp) ◦C cont. 500×500 m 1971 - 2000 8.97 13.32 0.88 NIWA
BIOCLIMATIC VARIABLES
Minimum temperature of the coldest month (Min.temp) ◦C cont. 500×500 m 1971 - 2000 1.85 5.76 0.77 NIWA Maximum temperature of the hottest month (Max.temp) ◦C cont. 500×500 m 1971 - 2000 18.46 23.91 1.06 NIWA
Growing degree days above 5◦C (GDD) - cont. 500×500 m 1971 - 2000 1522 2889 268.83 NIWA
Potential evapotranspiration (Evap.tot) kJ×◦C cont. 500×500 m 1971 - 2000 1.45 2.05 0.13 NIWA
Moisture index (Moist.ind) mm/kJ◦C cont. 500×500 m 1971 - 2000 2496.34 20337.98 2578.92 NIWA
Potential solar radiation (Sol.rad) kW/m2 cont. - - 0.29 0.98 0.14 R script
HUMAN-RELATED VARIABLES
Human population density (Pop.dens) Ab./m2 - - 1991 0 351 42.66 Statistics NZ
Distance of the plots to buildings (Dist.bldgs) m cont. - - 0 9518.41 2081.32 LINZ
Distance to paved roads (Dist.pav.road) m cont. - - 0.25 6770.52 1248.46 GIS
Distance to unpaved roads (Dist.unpav.road) m cont. - - 0.2 4312.05 855.21 GIS
ENVIRONMENTAL FACTORS
Distance to rivers (Dist.rivers) m cont. - - 2.91 18853.82 4264.66 NZ REC
Distance to streams (Dist.streams) m cont. - - 1 2304.95 196.92 NZ REC
Elevation (DEM) m cont. 10×10 m - 0 920 181.38 GIS
Aspect - cont. - - 0 358.53 105.55 Field measure
Slope % cont. - - 0 59.92 9.85 Field measure


![Table 4.1. Parameter estimates from multiple regression models [(d.f.(***(Total N), and the mean number of native and alien species per plot (Mean N) (Generalized Least Squares (GLS) with spatial correlation structures] predicting:native and alien species](https://thumb-us.123doks.com/thumbv2/123dok_us/9650072.1492859/102.595.97.724.226.488/parameter-estimates-multiple-regression-generalized-correlation-structures-predicting.webp)
