T E C H N I C A L A D V A N C E
Open Access
Comparison of measurement methods
with a mixed effects procedure accounting for
replicated evaluations (COM
3
PARE): method
comparison algorithm implementation for
head and neck IGRT positional verification
Anuradha Roy
1†, Clifton D. Fuller
2*†, David I. Rosenthal
2and Charles R. Thomas Jr.
3Abstract
Purpose: Comparison of imaging measurement devices in the absence of a gold-standard comparator remains a vexing problem; especially in scenarios where multiple, non-paired, replicated measurements occur, as in
image-guided radiotherapy (IGRT). As the number of commercially available IGRT presents a challenge to determine whether different IGRT methods may be used interchangeably, an unmet need conceptually parsimonious and statistically robust method to evaluate the agreement between two methods with replicated observations. Consequently, we sought to determine, using an previously reported head and neck positional verification dataset, the feasibility and utility of a Comparison of Measurement Methods with the Mixed Effects Procedure Accounting for Replicated Evaluations (COM3PARE), a unified conceptual schema and analytic algorithm based upon Roy’s linear
mixed effects (LME) model with Kronecker product covariance structure in a doubly multivariate set-up, for IGRT method comparison.
Methods: An anonymized dataset consisting of 100 paired coordinate (X/ measurements from a sequential series of head and neck cancer patients imaged near-simultaneously with cone beam CT (CBCT) and kilovoltage X-ray (KVX) imaging was used for model implementation. Software-suggested CBCT and KVX shifts for the lateral (X), vertical (Y) and longitudinal (Z) dimensions were evaluated for bias, inter-method (between-subject variation), intra-method (within-subject variation), and overall agreement using with a script implementing COM3PARE with the MIXED
procedure of the statistical software package SAS (SAS Institute, Cary, NC, USA).
Results: COM3PARE showed statistically significant bias agreement and difference in inter-method between CBCT
and KVX was observed in the Z-axis (bothp−value<0.01). Intra-method and overall agreement differences were noted as statistically significant for both the X- and Z-axes (allp−value<0.01). Using pre-specified criteria, based on intra-method agreement, CBCT was deemed preferable for X-axis positional verification, with KVX preferred for superoinferior alignment.
Conclusions: The COM3PARE methodology was validated as feasible and useful in this pilot head and neck cancer
positional verification dataset. COM3PARE represents a flexible and robust standardized analytic methodology for IGRT
comparison. The implemented SAS script is included to encourage other groups to implement COM3PARE in other
anatomic sites or IGRT platforms.
*Correspondence: [email protected]
†Equal contributors
2Department of Radiation Oncology, The University of Texas M.D. Anderson Cancer Center, Houston, TX, USA
Full list of author information is available at the end of the article
Background
Method comparison is a frequent problem encountered whenever different measurement devices/techniques are implemented in the absence of a gold standard [1–7]. Method comparison in radiological science is often a vexing issue [8–15], and is especially notable when com-peting imaging methodologies are used without establish-ment of the technical superiority in terms of accuracy of one platform. In a specific example, the explosion in applications of image-guided radiation therapy (IGRT), which necessitates repeated and exceedingly accurate spa-tial localization in order to carefully deliver conformal radiation dose, places a premium on both reproducibility and accuracy [14, 16–25]. Furthermore, the large num-ber of divergent manufacturer-supported mechanisms for achieving image-guided target localization/positional verification (e.g., 2D- and 3D-ultrasound [26–34], 2-D radiography [35–39], megavoltage and kilovoltage 3-D tomography [40–44]) have arisen in the absence of a gold-standard, and thus have been the impetus for a large number of inter-modality comparative studies, which themselves often utilize a wide array of statistical meth-ods to report between method measurement differences [22, 24, 25, 27, 33, 34, 44–47]. In an effort to more for-mally assess both inter- and intra-method bias, as well as to streamline comparatively time- and effort-intensive graphical and statistical analysis inherent in many method comparison statistical techniques, we sought to devise an algorithm to explore agreement between two meth-ods of image-guided radiotherapy, using a novel linear mixed effects (LME) model with Kronecker product covariance structure in a doubly multivariate approach [48]. This integrated approach has great potential util-ity, formally evaluating inter-method bias, inter-subject variability and the intra-subject variability (i.e., agreement between the repeatability coefficients) of the two imag-ing methods/devices. Testimag-ing of all three aspects is crucial, as inter-subject variability is of import when estimating the difference between the two methods giving different measurements on the same subject, while intra-subject variability affords calculation of the random error among the replications taken by the same method on the same subject [49]. We use a doubly multivariate set-up (i.e., measurement data for each subject is considered at two levels, incorporating both the number of measurement methods and number of replicated measurements). This specific LME-based technique, which we shall refer to as COM3PARE (Comparison of Measurement Methods
with Mixed Effects Procedure Accounting for Replicated Evaluations) is robust with regard to number of repli-cates, and is easily performed using SAS software (vide infra). LME models have improved fidelity in scenarios wherein observations are not fully independent and can more correctly models correlated errors, compared to
general linear models (GLM), which includes typical sta-tistical analyses (e.g., t-test, ANOVA, linear regression). LME includes multiple random effect components, com-pared to single element evaluation in most GLM mod-els, affording improved analysis of continuous variables where random effects, multiple hierarchical data levels, and replicated measurements are concerned. The num-ber of replicated measurements on each patient or subject may not be equal, and also the number of replications of the two methods on the same subject may not be equal. The specific aims for this study included:
• First known application of LME-based COM3PARE hypothesis testing protocol for method comparison using imaging data.
• Demonstration of feasibility and utility of COM3PARE using an established head and neck positional verification dataset, previously presented with standard method comparison approaches.
Methods
Datasets
following three conditions be met to verify whether two methods for measuring a variable (in this specific case, IGRT-suggested spatial shifts) can be considered inter-changeable:
1. No significant bias (i.e., no difference between the means of the two methods under a pre-specified threshold nor a statistically significant difference between said means).
2. No statistically significant difference in the
inter-subject (between-subject) variability of the two methods.
3. No statistically significant difference in the intra-subject (within-subject) variability (i.e., repeatability) of the two methods.
For this study, we pre-specified a bias threshold of an absolute value of< 0.1 cm, with a statistically significant difference designated by α < 0.05. To assess the afore-mentioned criteria, we implemented the LME method-ology proposed by Roy48, referred to as COM3PARE
(see Appendix A).
Statistical analysis with COM3PARE
As mentioned in the introduction the number of repli-cated measurements on each patient or subject may not be equal, and also the number of replications of the two methods on the same subject may not be equal. LetpKVXi
and pCBCTi be the number of replications on subject i
by the established method (KVX), and a new method (CBCT) respectively. Let pi = maxpKVXi ,pCBCTi , and
ni = 2pi. Therefore, the number of observations on the
ith subject isni, under the assumption that theith subject
haspKVXi −pCBCTi missing values.
Let yKVXit and yCBCTit be the responses by the estab-lished method and a new method of theith subject at the tth replicate, i = 1, 2,. . .,N, t = 1, 2,. . .,pi. Let
yit = yKVXit ,yCBCTit be the 2× 1 vector of measure-ments corresponding to theith subject at thetth replicate. Letyi = yi1,yi2,. . .,yip
i
be the(ni ×1)-dimensional
random vector corresponding to theith subject. That is, the vectoryi is obtained by stacking the responses of the KVX method, and the CBCT method at the first replica-tion, then stacking the responses of the KVX method and the CBCT method at the second replication and so on. We write all responses (yi) of theith subject in a matrix equation as
yi = Xiβ+Zibi+i,
with bi ∼ Nm(0,D),
and i ∼ Nni(0,Ri),
where b1,b2,. . .,bN,1,2,. . .,N are independent,
and y1,y2,. . .,yN are also all independent. LME model
allows for the explicit analysis of between-subject (D) and within-subject (Ri) sources of variation of the two
methods. We define the two methods by a vector variable Mvar; Mvar=1 for the KVX method and Mvar=2 for the CBCT method. We choose the intercept and the vector variable Mvar as fixed effects, thus the design matrixXi
has three columns, and consequentlyβ=(βo,β1,β2)is a
3-dimensional vector containing the fixed effects. We also choose the vector variable Mvar as random effects, i.e., Mvar is random across individual subjects; thus the design matrixZi has two columns. Therefore,bi = (b1i,b2i)
is a 2-dimensional vector containing the random effects.
The solution forβgives the means of the two methods μKVX and μCBCT. The between-subject
variance-covariance matrixDof the KVX method and the CBCT method is a general(2×2)-dimensional matrix, andRiis
a(ni×ni)-dimensional covariance matrix which depends
onionly through its dimensionni. The marginal density
function ofyi∼Nni(Xiβ,ZiDZi+Ri). Suppose the matrix
represents the within-subject variance-covariance matrix of the KVX method and the CBCT at any repli-cate; also, suppose V represents the p× p-dimensional correlation matrix of the replicated measurements on a given method, wherep = max
i (pi). It is assumed that
the 2 ×2 within-subject variance-covariance matrix is same for all replications, and the correlation matrix V is assumed to be the same for both the methods. We assumeRi = dim
ni (
V ⊗), where V andrespectively
are positive definite matrices as described above, and⊗ represents the Kronecker product structure. The notation dim
ni (
V ⊗), represents a (ni × ni)-dimensional
sub-matrix obtained from the(2p×2p)-dimensional matrix (V ⊗), by appropriately keeping the columns and rows corresponding to theni-dimensional response vectoryi.
Since the equicorrelated or compound symmetry (CS) structure assumes equal correlation among all replicated measurements, we assume that the correlation matrix V of the replicated measurements has equicorrelated correlation structure. For the above design matrix Zi
and between-subject D and within-subject Ri sources
of variation, the observed (ni × ni)-dimensional overall
variance-covariance matrix i for the ith individual is
given by
Cov(yi)=i = ZiDZi+Ri,
= ZiDZi+dimn
i (
V⊗).
Thus, the covariance matrix has the same structure for each subject, except that of the dimension. The 2×2 block diagonals Blocki in the overall variance-covariance
matrix i represent the overall variance-covariance
diagonals in the overall correlation matrixi_Correlation
represent the overall correlation matrix between the two methods. Thus, the off-diagonal element in this 2×2 over-all correlation matrix gives the overover-all correlation between the two methods. It can be easily seen that the overall variability is the sum of between-subject variability and within-subject variability (see Roy48for detail). Thus, we see that if there is a disagreement in overall variabilities, then it may be due to the disagreement in either between-subject variabilities or within-between-subject variabilities or both.
MIXED procedure of SAS
We use MIXED procedure (PROC MIXED) of SAS to get the maximum likelihood estimates (MLEs) of β,D, Ri and i. METHOD=ML specifies MIXED procedure
to calculate the maximum likelihood estimates of the parameters. The COVTEST option requests hypoth-esis tests for the random effects. CLASS statement specifies the categorical variables. DDFM=KR specifies the Kenward-Roger51 correction for computing the denominator degrees of freedom for the fixed effects. Kenward-Roger correction is suggested whenever one has replicated or repeated measures data; also for missing data. The SOLUTION (S) option in the MODEL state-ment provides the estimate of the difference between the two mean readings (bias) of the two methods.RANDOM
and REPEATED statements specify the structure of the covariance matrices Dand Ri. See the sample program
in Appendix A that demonstrates the use of RANDOM
and REPEATED statements. PROC MIXED calculates the(ni×ni)-dimensional submatrixRiof theith subject
from the (2p× 2p)-dimensional matrix (V ⊗), and eventually calculates (ni × ni)-dimensional submatrix
i. When the number of replications on each subject by
respective methods is unequal,PROC MIXEDconsiders the case as missing value situation. Options V=3 and
VCORR=3 in theRANDOM statement give the estimate of the overall variance-covariance matrix 3 and the
corresponding 3_Correlation matrix, i.e., for the third
subject. The optionGin theRANDOM statement gives the estimate of the between-subject variance-covariance matrix D. Option Rin the REPEATED statement gives the estimate of the variance-covariance matrix R1 for
the first subject. One can get thei variance-covariance
matrix and the correspondingi_Correlation matrix for
all subjects by specifyingV= 1 to N, andVCORR=1 to N in theRANDOMstatement. When the correlation matrix V on the replicated measurements assumes equicorre-lated structure andas unstructured, we use the option
TYPE=UNalong withSUBJECT=REPLICATE(PATIENT)
in the REPEATED statement. This gives the 2 × 2 within-subject variance-covariance matrix . See Appendix A.
Related hypotheses testings to test the disagreement between KVX and CBCT
If there is a disagreement between the two methods, it is important to know whether it is due to the bias, due to the difference in between-subject variabilities or due to the difference in within-subject variabilities of the two methods. If it is due to the bias between the two meth-ods, it is easy to correct. The output of PROC MIXED
always gives the bias, itst−value and itsp−value. Nonethe-less, it is not straightforward to check the agreement or disagreement in between-subject variabilities and in within-subject variabilities of the two methods. We will accomplish these by the indirect use of PROC MIXED
in two steps (described below) by using likelihood ratio tests.
Testing of hypothesis of difference between the means of KVX and CBCT
We are interested in testing the following hypothesis for bias:
Hμ: the two methods do not have the same mean, vs. Kμ: the two methods have the same mean.
Output ofPROC MIXED(Solution for Fixed Effects) gives the bias and the correspondingt−value andp−value.
Testing of hypothesis of difference in between-subject variabilities of KVX and CBCT
Here we are interested in testing the following hypothesis:
Hd: the two methods do not have the same
between-subject variabilities, vs. Kd: the two methods have the same
between-subject variabilities.
We apply the likelihood ratio test for this hypothesis testing. To compute the test statistic−2 lnd, where
−2 lnd =
−2 ln max
Kd
L
−
−2 ln max
Hd
L
.
The log likelihood function under both null hypothe-sis and alternating hypothehypothe-sis must be maximized sepa-rately. We do this by setting the optionMETHOD=MLin
PROC MIXEDstatement. The option TYPE=UN in the
RANDOM statement, along with the option TYPE=UN
in the REPEATED statement, is used to calculate the “-2 Log Likelihood" for the covariance structure underHd.
Similarly, the option TYPE=CS in the RANDOM state-ment, along with the optionTYPE=UNin theREPEATED
statement, is used to calculate the “-2 Log Likelihood" for the covariance structure underKd.
test statistic−2 lndunderKdfollows a chi-square
dis-tribution with degrees of freedom (d.f.) νd, where νd is computed as
νd=LRT df (underHd)−LRT df (underKd).
PROC MIXEDcalculates “LRT df" under the heading of “Null Model Likelihood Ratio Test", see Appendix B.
Testing of hypothesis of difference in within-subject variabilities of KVX and CBCT
We test the difference between the repeatability coefficients of the two methods by testing the following hypothesis:
Hσ : the two methods do not have the same within-subject variabilities,
vs. Kσ : the two methods have the same within-subject variabilities,
As before here also we apply the likelihood ratio test for this hypothesis testing, and maximize the log likelihood function under both null hypothesis and alter-nating hypothesis separately to compute the test statistic
−2 lnσ, where
−2 lnσ =
−2 ln max
Kσ L
−
−2 ln max
Hσ L
.
The optionTYPE=UNin theRANDOMstatement, along withTYPE=UN in theREPEATEDstatement, is used to calculate the “-2 Log Likelihood" for the covariance struc-ture underHσ. TYPE=UN in theRANDOM statement, along with TYPE=CS in the REPEATED statement, is used to calculate the “-2 Log Likelihood" for the covari-ance structure under Kσ. The test statistic −2 lnσ
under Kσ follows a chi-square distribution with d.f. νσ = LRT df (underHσ)−LRT df (underKσ).
Testing of hypothesis of difference in overall variabilities of KVX and CBCT
We are interested in testing the following hypothesis:
Hω: the two methods do not have the same overall variabilities,
vs. Kω: the two methods have the same overall variabilities,
As before here also we apply the likelihood ratio test to compute the test statistic−2 lnω, where
−2 lnω =
−2 ln max
Kω L
−
−2 ln max
Hω L
.
The optionTYPE=UNin theRANDOMstatement, along withTYPE=UN in theREPEATEDstatement, is used to calculate the “-2 Log Likelihood" for the covariance struc-ture underHω. The optionTYPE=CS in theRANDOM
statement, along withTYPE=CSin theREPEATED state-ment, is used to calculate the “-2 Log Likelihood" for the covariance structure under Kω. The test statistic
−2 lnωunderKωfollows a chi-square distribution with d.f.νω = LRT df (underHω)−LRT df (underKω).
Results
Selected parts of the SAS output to test the within-subject variabilities are given in Appendix B. We present the sam-ple SAS code (see Appendix A) to test within-subject variabilities by fitting the linear mixed effects model to our KVX and CBCT shifts for the lateral (X). We see that
−2 ln max
Kσ
L=273.7 and −2 ln max
Hσ L=239.7, with
LRT df (underHσ)=5 and LRT df (underKσ)=4.
Therefore,
−2 lnσ =
−2 ln max
Kσ L
−
−2 ln max
Hσ L
= 273.7−239.7=34.0, with
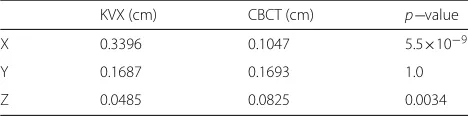
νσ=LRT df (underHσ)−LRT df (underKσ)=5−4=1. The p-value for testing the within-subject variabili-ties of the two methods by using IML procedure of SAS is calculated at the third stage (see Appendix A). Thep−value= 5.5112E−9 (see Appendix B).
Inter-method bias, inter-method agreement, intra-method agreement, overall agreement and correlation results from COM3PARE are presented in Tables 1, 2, 3, 4
and 5. Using COM3PARE, in this specific head and
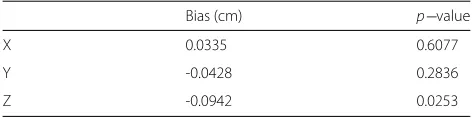
neck positional verification demonstration dataset, while inter-method bias was < 1 mm for all axes, a statisti-cally significant between method bias was noted in the Z-axis (superoinferior axis). Also, was evidenced there was a statistically significant difference between CBCT and KVX inter-subject variation in the Z-axis (Table 1). Intra-subject variability was noted to be statistically sig-nificant for X- and Z-axes, as was overall variation. Cor-relation coefficient calculation estimation was performed using a mixed effects model (as per Roy [52]).
Using the aforementioned criteria, automated shifts from CBCT and kV X-ray, acquired and processed in the manner detailed are interchangeable only for measure-ments of the Y-axis (anteroposterior), and for example,
Table 1Between-method bias
Bias (cm) p−value
X 0.0335 0.6077
Y -0.0428 0.2836
Table 2Inter-method agreement
KVX (cm) CBCT (cm) p−value
X 0.0413 0.0670 0.4795
Y 0.0511 0.0464 0.7518
Z 0.0273 0.0848 0.0010
should not be used on alternating days in facilities with both systems in either X- or Z-axis. Additionally, our method suggests that, with lower intra-method variability in the X-axis (lateral), CBCT is the preferred measure-ment method, while in the Z-axis (superoinferior) kV X-ray measurement is preferable.
Discussion
The necessity for quantitative evaluation of compet-ing measurement devices, in cases where on device has not been found to be superior, is a significant need in science generally [1, 2, 5–7], and particularly within the radiological sciences community. Specifically, this issue is encountered when comparing distinct posi-tional verification methods for image-guided radiotherapy [34, 53–56]. The difficulty of assessing competing plat-forms is particularly vexing, as it impedes efforts at cross platform comparison. Our group [24, 50] and others have implemented several distinct methods for presenting such analysis [25, 27, 33, 34, 45, 57]. Our previous efforts have utilized several extant method comparison statistical pre-sentations (including Bland-Altman7, Lin’s concordance
[58], Deming orthogonal regression [59, 60]); however, what was gained in completeness was lacking in par-simony. To this end, we sought to define an improved algorithm for practical comparison of distinct imaging methodologies, with a non-fixed number of repeated measurements per patient, in the absence of a “gold stan-dard”. Often, inappropriate statistical analyses are imple-mented in lieu of formal method comparison statistics. The analysis of different measurement devices is not as straightforward as the initial observer may suppose. Bland and Altman demonstrated that mean comparison and linear regression are insufficient for comparison of differing measurement techniques [1]. The Bland- Alt-man method is succinct and easily interpretable, making it a classic of medical literature. In a series of seminal papers [1–7], Bland and Altman defined the standard methodology for comparing differing measurements, as well as establishing effective techniques accounting for
Table 3Intra-method agreement
KVX (cm) CBCT (cm) p−value
X 0.3396 0.1047 5.5×10⁻⁹
Y 0.1687 0.1693 1.0
Z 0.0485 0.0825 0.0034
Table 4Overall agreement
KVX (cm) CBCT (cm) p−value
X 0.3809 0.1717 3.7×10⁻⁸
Y 0.2198 0.2157 0.9512
Z 0.0758 0.1673 1.3×10⁻⁵
inter- and intra-method variability/repeatability. How-ever, while the Bland- Altman methodology remains the current benchmark, it fails (by design, one should note) to include generation of a formalized p−value, instead recommending that a clinically meaningful differ-ence between measures be utilized. Additionally, though repeatability estimation is a recommended component of accurate method comparison, the calculation for greater than two replicates is somewhat unwieldy using the methodology proposed by Bland and Altman. Since many IGRT datasets span > 30 repeated daily mea-sures, the utility of a statistical methodology which can readily integrate large replicate numbers is desirable. The COM3PARE methodology presented herein
repre-sents an attempt to integrate several desirable method-ological attributes into a unified, readily performed statistical process. COM3PARE has several advantages
over existing method comparison statistical analyses. Specifically, compared to general linear model [61, 62] (GLM)-based approaches (such as thet-test, linear regres-sion, and ANOVA [63]), which fail to account for multi-ple sources of random variance, the linear mixed effects (LME)-based COM3PARE platform integrates variation
estimation at multiple hierarchical levels (i.e., between-and within- measurement methods/subjects) [48]. From a practical point of view, this allows factor-wise assessment of procedural or technical variability of each of the two methods rather than a combined assessment, so that there is the capacity to determine the exact source of disagree-ment. COM3PARE is also resilient with regard to uneven
numbers of replicates per device, a feature of great practi-cal utility in a clinipracti-cal setting, such as daily IGRT record-ing, where the number of IGRT fractions received for each patient may differ based on fractionation regimen of clinical exigency. Additionally, since COM3PARE has the
capacity to fit differences in said variability to a hypothe-sis testing-friendly Bonferroni-correctedp−value output, while still implementing clinician-determined thresholds
Table 5Mixed effects estimated correlation coefficient
Correlation coefficient
X 0.5329
Y 0.8038
for agreement there is greater interpretability of statistical output, with no loss of clinical relevance. For instance, one could specify a priori that measurement differen-tials > 1 mm would represent a lack of interchange-ability globally. Data presentation was performed in this study in an effort to illustrate potential applications of COM3PARE for replicated image-based measurements of
the kind frequently encountered in radiation oncology. The specific dataset included have been previously pre-sented using standard method approaches. By revisiting these data using compare we hope to illustrate imple-mentation of what we perceive to be a more usable and parsimonious approach to conceptualizing method com-parison for IGRT applications, expanding upon, rather than obviating the previous work. With regard to the specific dataset presented herein, our analysis points to the difficulties possible when comparing IGRT plat-forms. For instance, having set our criteria pre-analysis, we were surprised to note that differing measurement methods proved preferable in distinct axes (e.g., CBCT in X-axis, kV X-ray for the Z-axis), while appearing by
said criteria interchangeable in the Y-axis. A possible explanation of this phenomenon may appear as a feature of the imaging methodologies themselves. For CBCT, before three-dimensional reconstruction, data is acquired as axial slices (X-axis), while, previous to DRR referenc-ing, the kV X-ray system uses orthogonal projections at oblique angles, parallel to the superoinferior plane (Z-axis). Consequently, method intra-subject repeata-bility may be tied to the reference plane of image acquisition, though this remains conjecture based on a single dataset. To our knowledge this technique represents the first formal hypothesis testing approach to integrate inter-method bias, inter-subject variability, and intra-subject variability of two methods with any number of replicated measurements for image-guided radiotherapy. As modeled on the aforementioned con-ceptual schema presented in the “Methods” section, we postulate that the following criteria be formally evaluated as feature of future image-guided radiother-apy measurement comparison studies comparing two imaging platforms, where multiple repeated observations
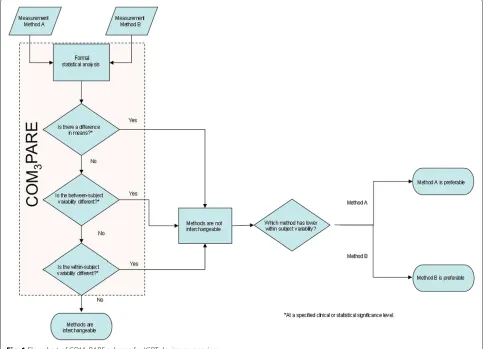
on the same subject is possible. To meet our criteria for interchangeability [48]:
1. The bias and overall agreement must fall within a pre-specified range (e.g., bias/agreement of<0.1cm between IGRT devices).
2. There should be no statistically significant, using a pre-specified threshold (e.g.,<0.05) difference in the inter-subject variability of the two methods.
3. There should be no statistically significant difference in the intra-subject variability (i.e., repeatability) of the two methods.
4. In cases where criteria 2 and 3 are NOT met, the preferred IGRT technique is the one exhibiting the lower intra-subject variability (i.e., greater
repeatability).
These criteria are presented as a graphical schema (Fig. 1); notably analysis of criteria 1–3 is easily incor-porated in a single step using the COM3PARE SAS
Code (Appendix A). The a priori criteria set we spec-ified for interchangeability represented what we con-sidered a reasonable metrics for the given application (i.e. fractionated radiotherapy of 30+ fractions for head and neck cancer) with a standardized PTV margin. The COM3PARE methodology, however, allows spec-ification of any specified difference/p-value combina-tion. Consequently, if a scenario arose whereby either tighter tolerances are desirable (e.g. 3-fraction SBRT), such parameters can be easily defined as an acceptability criteria.
Conclusion
COM3PARE represents an attempt at a unified
concep-tual schema and analytic algorithm for method compas-sion of IGRT platforms. Initial application in a head and neck positional verification dataset shows feasibility and utility.
Appendix A
SAS code
Below we provide the sample SAS code to test within-subject variabilities by fitting the linear mixed effects model to our KVX and CBCT shifts for the lateral (X). We first fit the linear mixed effects model for the null hypothesis, then we fit the linear mixed effects model for the alternating hypothesis, and then find the
p−value for the test. Appropriate changes can be made to test between-subject variabilities and overall variabilities using the SAS commands as described in Sections Testing of hypothesis of difference in between-sub-ject variabilities of KVX and CBCT, and Testing of hypothesis of difference in overall variabilities of KVX and CBCT. Appropriate changes can be also made for vertical
(Y) and longitudinal (Z) dimensions and for any other data sets.
/* Here we give the SAS code for fitting the linear mixed effects model to the our KVX and CBCT shifts data under the null hypothesis that the two methods do not have the same within-subject
variabilities.*/
options ls=64 ps=68 nocenter;
proc import datafile="c:\CBCTKVX.xls" DBMS=EXCELCS
out=sasuser.max2 replace;
/*proc print data=sasuser.max2; run;*/
data KVXCBCTdataX; set sasuser.max2; keep pat replicate xm1kvx xm2cbct;
data b; SET KVXCBCTdataX; y=xm1kvx; mvar=’1’; output; y=xm2cbct; mvar=’2’; output; /*proc print data=b; run;*/
proc mixed data=b method=ml covtest; classes pat mvar replicate;
model y = mvar/ s outpredm=pp ddfm=kr; random mvar / type=un subject=pat g gcorr v=3 vcorr=3;
repeated mvar/type= un
subject=replicate(pat) r rcorr; run;
/* Here we give the SAS code for fitting the linear mixed effects model to the same data under the alternative hypothesis that the two methods have the same
within-subject variabilities.*/
proc mixed data=b method=ml covtest; classes pat mvar replicate;
model y=mvar /s ddfm=kr;
random mvar /type= un subject=pat v vcorr g; repeated mvar/type= cs
subject=replicate (pat) r; run;
/* Calculating the p-value to test the within-subject variabilities of the two methods */
proc iml;
Appendix B
SAS output for covariance structure under the null and the alternating hypotheses Below we provide the selected portions of the output of the above program.
/* The following output is for the null hypothesis */
Estimated V Matrix for Pat 3
Row Col1 Col2 Col3 Col4 Col5 Col6 1 0.3809 0.1363 0.04126 0.03663 0.04126 0.03663 2 0.1363 0.1717 0.03663 0.06695 0.03663 0.06695 3 0.04126 0.03663 0.3809 0.1363 0.04126 0.03663 4 0.03663 0.06695 0.1363 0.1717 0.03663 0.06695 5 0.04126 0.03663 0.04126 0.03663 0.3809 0.1363 6 0.03663 0.06695 0.03663 0.06695 0.1363 0.1717
Covariance Parameter Estimates
Cov Parm Subject Estimate Standard Error Z Value Pr Z
UN(1,1) Pat 0.04126 0.03079 1.34 0.0902
UN(2,1) Pat 0.03663 0.02384 1.54 0.1244
UN(2,2) Pat 0.06695 0.02669 2.51 0.0061
UN(1,1) Replicate(Pat) 0.3396 0.05238 6.48 <.0001 UN(2,1) Replicate(Pat) 0.09963 0.02359 4.22 <.0001 UN(2,2) Replicate(Pat) 0.1047 0.01688 6.20 <.0001
Fit Statistics
-2 Log Likelihood 239.7 AIC (smaller is better) 255.7 AICC (smaller is better) 256.5 BIC (smaller is better) 266.4
Null Model Likelihood Ratio Test DF Chi-Square Pr > ChiSq
5 74.98 <.0001
Solution for Fixed Effects
Effect mvar Estimate Standard Error DF t Value Pr > |t| Intercept 0.03022 0.06212 28.7 0.49 0.6304
mvar 1 0.03349 0.06447 26.5 0.52 0.6077
mvar 2 0 . . . .
/* The following output is for the alternating hypothesis */
Fit Statistics
-2 Log Likelihood 273.7 AIC (smaller is better) 287.7 AICC (smaller is better) 288.2 BIC (smaller is better) 297.0
Null Model Likelihood Ratio Test DF Chi-Square Pr > ChiSq
4 41.03 <.0001
/* The following output is for the p-value to test the within-subject variabilities of the two methods */
Competing interests
CDF received/receives grant support from: the SWOG Hope Foundation Dr. Charles A. Coltman, Jr. Fellowship in Clinical Trials; the National Institutes of Health Paul Calabresi Clinical Oncology Award Program (K12 CA088084) and Clinician Scientist Loan Repayment Program (L30 CA136381-02); Elekta AB/MD Anderson Consortium; GE Medical Systems/MD Anderson Center for Advanced Biomedical Imaging In-Kind Award; the MD Anderson Center for Radiation Oncology Research, and an MD Anderson Institutional Research Grant Program Award. These listed funders/supporters played no role in the study design, collection, analysis, interpretation of data, manuscript writing, or decision to submit the report for publication.
Authors’ contributions
AR conceived of and performed the statistical methods described herein, and co-drafted the manuscript. CDF conceived of the study, and participated in its design and coordination, assisted with data collection and co-drafted the manuscript. DIR helped to draft the manuscript, provided scientific oversight and provided editorial assistance. CRT participated in the design of the study and coordination and helped to draft the manuscript. All authors read and approved the final manuscript.
Acknowledgements
Special thanks to Joseph Ting, PhD for dataset utilization permission.
Conflict of interest disclosure
CDF was supported by the National Institutes of Health Clinical Research Loan Repayment Program (L30 CA136381), National Institute of Biomedical Imaging and Bioengineering (5T32EB000817-04), and the SWOG Hope Foundation Coltman Fellowship. The funder(s) played no role in study design, in the collection, analysis and interpretation of data, in the writing of the manuscript, nor in the decision to submit the manuscript.
Author details
1Department of Management Science and Statistics, The University of Texas at
San Antonio, One UTSA Circle, 78249 San Antonio, TX, USA.2Department of
Radiation Oncology, The University of Texas M.D. Anderson Cancer Center, Houston, TX, USA.3Department of Radiation Medicine, Oregon Health &
Science University, Portland, OR, USA.
Received: 17 July 2014 Accepted: 24 July 2015
References
1. Bland JM, Altman DG. Statistical methods for assessing agreement between two methods of clinical measurement. Lancet. 1986;1:307–10. 2. Bland JM, Altman DG. Comparing methods of measurement:
why plotting difference against standard method is misleading. Lancet. 1995;346:1085–7.
3. Bland JM, Altman DG. Comparing two methods of clinical measurement: a personal history. Int J Epidemiol. 1995;24(Suppl 1):S7–14.
4. Bland JM, Altman DG. Measurement error. BMJ (Clinical research ed.) 1996;312:1654.
5. Bland JM, Altman DG. Measuring agreement in method comparison studies. Stat Methods Med Res. 1999;8:135–60.
6. Bland JM, Altman DG. Applying the right statistics: analyses of measurement studies. Ultrasound Obstet Gynecol. 2003;22:85–93. 7. Bland JM, Altman DG. Agreement between methods of measurement
with multiple observations per individual. J Biopharm Stat. 2007;17:571–82.
8. Bisdas S, Konstantinou G, Surlan-Popovic K, Khoshneviszadeh A, Baghi M, Vogl TJ, et al. Dynamic contrast-enhanced CT of head and neck tumors: comparison of first-pass and permeability perfusion
measurements using two different commercially available tracer kinetics models. Acad Radiol. 2008;15:1580–9.
9. Cronin P, Saab A, Kelly AM, Gross BH, Patel S, Kazerooni EA, Carlos RC. Measurements of pulmonary vein ostial diameter and distance to first bifurcation: A comparison of different measurement methods. Eur J Radiol. 2009;71(1):61–8.
10. Kanza RE, Higashino H, Kido T, Kurata A, Saito M, Sugawara Y, Mochizuki T. Quantitative assessment of regional left ventricular wall
thickness and thickening using 16 multidetector-row computed tomography: comparison with cine magnetic resonance imaging. Radiat Med. 2007;25:119–26.
11. Kwee TC, Takahara T, Koh DM, Nievelstein RA, Luijten PR. Comparison and reproducibility of ADC measurements in breathhold, respiratory triggered, and free-breathing diffusion-weighted MR imaging of the liver. J Magn Reson Imaging. 2008;28:1141–8.
12. Mahnken AH, Spuentrup E, Niethammer M, Buecker A, Boese J, Wildberger JE Flohr T, et al. Quantitative and qualitative assessment of left ventricular volume with ECG-gated multislice spiral CT: value of different image reconstruction algorithms in comparison to MRI. Acta Radiol. 2003;44:604–11.
13. Martin KE, Helvie MA, Zhou C, Roubidoux MA, Bailey JE, Paramagul C, et al. Mammographic density measured with quantitative
computer-aided method: comparison with radiologists’ estimates and BI-RADS categories. Radiology. 2006;240:656–65.
14. Murakami R, Uozumi H, Hirai T, Nishimura R, Katsuragawa S, Shiraishi S, Toya R, Tashiro K, Kawanaka K, Oya N, Tomiguchi S, Yamashita Y. Impact of FDG-PET/CT fused imaging on tumor volume assessment of head-and-neck squamous cell carcinoma: intermethod and interobserver variations. Acta Radiol. 2008;49:693–9.
15. Nieman K, Shapiro MD, Ferencik M, Nomura CH, Abbara S, Hoffmann U, et al. Reperfused myocardial infarction: contrast-enhanced 64-Section CT in comparison to MR imaging. Radiology. 2008;247:49–56.
16. Agazaryan N, Tenn SE, Desalles AA, Selch MT. Image-guided radiosurgery for spinal tumors: methods, accuracy and patient intrafraction motion. Phys Med Biol. 2008;53:1715–27.
17. Dawson LA, Jaffray DA. Advances in image-guided radiation therapy. J Clin Oncol. 2007;25:938–946.
18. Grills IS, Hugo G, Kestin LL, Galerani AP, Chao KK, Wloch J, et al. Image-guided radiotherapy via daily online cone-beam CT substantially reduces margin requirements for stereotactic lung radiotherapy. Int J Radiat Oncol Biol Phys. 2008;70:1045–56.
19. Ippolito E, Mertens I, Haustermans K, Gambacorta MA, Pasini D, Valentini V. IGRT in rectal cancer. Acta oncologica (Stockholm, Sweden). 2008;47:1317–24.
20. Kupelian PA, Langen KM, Willoughby TR, Zeidan OA, Meeks SL. Image-guided radiotherapy for localized prostate cancer: treating a moving target. Semin Radiat Oncol. 2008;18:58–66.
21. Wertz H, Lohr F, Dobler B, Mai S, Wenz F. Dosimetric impact of image-guided translational isocenter correction for 3-D conformal radiotherapy of the prostate. Strahlenther Onkol. 2007;183:203–10. 22. Wiersma RD, Mao W, Xing L. Combined kV and MV imaging for real-time
tracking of implanted fiducial markers. Med Phys. 2008;35:1191–8. 23. Yorke ED, Keall P, Verhaegen F. Anniversary paper: Role of medical
physicists and the AAPM in improving geometric aspects of treatment accuracy and precision. Med Phys. 2008;35:828–39.
24. Fuller CD, Thomas CR, Schwartz S, Golden N, Ting J, Wong A, et al. Method comparison of ultrasound and kilovoltage x-ray fiducial marker imaging for prostate radiotherapy targeting. Phys Med Biol.
2006;51:4981–93.
25. Moseley DJ, White EA, Wiltshire KL, Rosewall T, Sharpe MB, Siewerdsen JH, et al. Comparison of localization performance with implanted fiducial markers and cone-beam computed tomography for on-line
image-guided radiotherapy of the prostate. Int J Radiat Oncol Biol Phys. 2007;67:942–53.
26. Artignan X, Smitsmans MH, Lebesque JV, Jaffray DA, van Her M, Bartelink H. Online ultrasound image guidance for radiotherapy of prostate cancer: impact of image acquisition on prostate displacement. Int J Radiat Oncol Biol Phys. 2004;59:595–601.
27. Cury FL, Shenouda G, Souhami L, Duclos M, Faria SL, David M, et al. Ultrasound-based image guided radiotherapy for prostate cancer: comparison of cross-modality and intramodality methods for daily localization during external beam radiotherapy. Int J. Radiat Oncol Biol Phys. 2006;66:1562–7.
28. Fung AY, Ayyangar KM, Djajaputra D, Nehru RM, Enke CA. Ultrasound-based guidance of intensity-modulated radiation therapy. NMed Dosim. 2006;31:20–9.
30. Langen KM, Pouliot J, Anezinos C, Aubin M, Gottschalk AR, Hsu IC, et al. Evaluation of ultrasound-based prostate localization for image-guided radiotherapy. Int J. Radiat Oncol Biol Phys. 2003;57:635–44.
31. Patel RR, Orton N, Tome WA, Chappell R, Ritter MA. Rectal dose sparing with a balloon catheter and ultrasound localization in conformal radiation therapy for prostate cancer. Radiother Oncol. 2003;67:285–94.
32. Choi M, Fuller CD, Wang SJ, Siddiqi A, Wong A, Thomas Jr CR, Fuss M. Effect of body mass index on shifts in ultrasound-based image-guided intensity-modulated radiation therapy for abdominal malignancies. Radiother Oncol. 2009;91(1):114–9.
33. Gayou O, Miften M. Comparison of mega-voltage cone-beam computed tomography prostate localization with online ultrasound and fiducial markers methods. Med Phys. 2008;35:531–8.
34. Johnston H, Hilts M, Beckham W, Berthelet E. 3D ultrasound for prostate localization in radiation therapy: a comparison with implanted fiducial markers. Med Phys. 2008;35:2403–13.
35. Aubry JF, Beaulieu L, Girouard LM, Aubin S, Tremblay D, Laverdiere J, et al. Measurements of intrafraction motion and interfraction and intrafraction rotation of prostate by three-dimensional analysis of daily portal imaging with radiopaque markers. Int J Radiat Oncol Biol Phys. 2004;60:30–9.
36. Balter JM, Sandler HM, Lam K, Bree RL, Lichter AS, Haken TENRK. Measurement of prostate movement over the course of routine radiotherapy using implanted markers. Int J Radiat Oncol Biol Phys. 1995;31:113–8.
37. Evans PM. Anatomical imaging for radiotherapy. Phys Med Biol. 2008;53:R151–191.
38. Lometti MW, Thurston D, Aubin M, Bock A, Verhey L, Lockhart JM, Bland R, Pouliot J, Roach 3rd M. Are lateral electronic portal images adequate for accurate on-line daily targeting of the prostate? Results of a prospective study. Med Dosim. 2008;33:22–9.
39. Sornsen de Kostevan JR, Cuijpers JP, Geest de FG, Lagerwaard FJ, Slotman BJ, Senan S. Verifying 4D gated radiotherapy using
time-integrated electronic portal imaging: a phantom and clinical study. adiat Oncol (London, England). 2007;2:32.
40. Morin O, Gillis A, Chen J, Aubin M, Bucci MK, Roach 3rd M, et al. Megavoltage cone-beam CT: system description and clinical applications. Med Dosim. 2006;31:51–61.
41. Pang G, Bani-Hashemi A, Au P, O’Brien PF, Rowlands JA, Morton G, et al. Megavoltage cone beam digital tomosynthesis (MV-CBDT) for
image-guided radiotherapy: a clinical investigational system. Phys Med Biol. 2008;53:999–1013.
42. Pisani L, Lockman D, Jaffray D, Yan D, Martinez A, Wong J. Setup error in radiotherapy: on-line correction using electronic kilovoltage and megavoltage radiographs. Int J Radiat Oncol Biol Phys. 2000;47:825–39. 43. Pouliot J, Bani-Hashemi A, Chen J, Svatos M, Ghelmansarai F,
Mitschke M, et al. Low-dose megavoltage cone-beam CT for radiation therapy. Int J Radiat Oncol Biol Phys. 2005;61:552–60.
44. Serago CF, Buskirk SJ, Igel TC, Gale AA, Serago NE, Earle JD. Comparison of daily megavoltage electronic portal imaging or kilovoltage imaging with marker seeds to ultrasound imaging or skin marks for prostate localization and treatment positioning in patients with prostate cancer. Int J Radiat Oncol Biol Phys. 2006;65:1585–92.
45. Wu QJ, Godfrey DJ, Wang Z, Zhang J, Zhou S, Yoo S, Brizel DM, Yin FF. On-board patient positioning for head-and-neck IMRT: comparing digital tomosynthesis to kilovoltage radiography and cone-beam computed tomography. Int J Radiat Oncol Biol Phys. 2007;69:598–606.
46. Scarbrough TJ, Golden NM, Ting JY, Fuller CD, Wong A, Kupelian PA, Thomas Jr CR. Comparison of ultrasound and implanted seed marker prostate localization methods: Implications for image-guided radiotherapy. Int J Radiat Oncol Biol Phys. 2006;65:378–87.
47. Stutzel J, Oelfke U, Nill S. A quantitative image quality comparison of four different image guided radiotherapy devices. Radiother Oncol. 2008;86:20–4.
48. Roy A. An application of linear mixed effects model to assess the agreement between two methods with replicated observations. J Biopharm Stat. 2009;19:150–73.
49. Barnhart HX, Haber MJ, Lin LI. An overview on assessing agreement with continuous measurements. J Biopharm Stat. 2007;17:529–69.
50. Fuller CD, Scarbrough TJ, Sonke JJ, Rasch CR, Choi M, Ting JY, et al. Method comparison of automated matching software-assisted
cone-beam CT and stereoscopic kilovoltage x-ray positional verification image-guided radiation therapy for head and neck cancer: a prospective analysis. Phys Med Biol. 2009;54:7401–15.
51. Kenward MG, Roger JH. Small sample inference for fixed effects from restricted maximum likelihood. Biometrics. 1997;53:983-997. 52. Roy A. Estimating correlation coefficient between two variables with
repeated observations using mixed effects model. Biometrical J. 2006;48:286–301.
53. Cui Y, Galvin JM, Straube WL, Bosch WR, Purdy JA, Li XA, Xiao Y. Multi-System Verification of Registrations for Image-Guided Radiotherapy in Clinical Trials. Int J Radiat Oncol Biol Phys. 2011;81(1):305–312. 54. Mohammed N, Kestin L, Grills I, Shah C, Glide-Hurst C, Yan D, et al.
Comparison of IGRT Registration Strategies for Optimal Coverage of Primary Lung Tumors and Involved Nodes Based on Multiple Four-Dimensional CT Scans Obtained Throughout the Radiotherapy Course. Int J Radiat Oncol Biol Phys. 2012;82(4):1541–8.
55. Shi W, Li JG, Zlotecki RA, Yeung A, Newlin H, Palta J, et al. Evaluation of kV cone-beam ct performance for prostate IGRT: a comparison of automatic grey-value alignment to implanted fiducial-marker alignment. Am J Clin Oncol. 2011;34(1):16–21.
56. Thongphiew D, Wu QJ, Lee WR, Chankong V, Yoo S, McMahon R, Yin FF. Comparison of online IGRT techniques for prostate IMRT treatment: adaptive vs repositioning correction. Med Phys. 2009;36:1651–62. 57. Borst GR, Sonke JJ, Betgen A, Remeijer P, Herk van M, Lebesque JV.
Kilo-voltage cone-beam computed tomography setup measurements for lung cancer patients; first clinical results and comparison with electronic portal-imaging device. Int J Radiat Oncol Biol Phys. 2007;68:555–61. 58. Lin LI. A concordance correlation coefficient to evaluate reproducibility.
Biometrics. 1989;45:255–68.
59. Konings H. Use of Deming regression in method-comparison studies. Surv Immunol Res. 1982;1:371–74.
60. Martin RF. General deming regression for estimating systematic bias and its confidence interval in method-comparison studies. Clinical Chem. 2000;46:100–4.
61. Milliken G, Graybill F. Extensions of the General Linear Hypothesis Model. J Am Stat Assoc. 1970;65:797–807.
62. LaMotte L. A Canonical Form for the General Linear Model. Ann Stat. 1977;5:787–9.
63. Fennessey J. The General Linear Model: A New Perspective on Some Familiar Topics. Am J Sociol. 1968;74:1–27.
Submit your next manuscript to BioMed Central and take full advantage of:
• Convenient online submission
• Thorough peer review
• No space constraints or color figure charges
• Immediate publication on acceptance
• Inclusion in PubMed, CAS, Scopus and Google Scholar
• Research which is freely available for redistribution