R E S E A R C H A R T I C L E
Open Access
A basic model for assessing primary health
care electronic medical record data quality
Amanda L. Terry
1*, Moira Stewart
2, Sonny Cejic
2, J. Neil Marshall
2, Simon de Lusignan
3, Bert M. Chesworth
4,
Vijaya Chevendra
5, Heather Maddocks
6, Joshua Shadd
7ˆ
, Fred Burge
8and Amardeep Thind
9Abstract
Background:The increased use of electronic medical records (EMRs) in Canadian primary health care practice has resulted in an expansion of the availability of EMR data. Potential users of these data need to understand their quality in relation to the uses to which they are applied. Herein, we propose a basic model for assessing primary health care EMR data quality, comprising a set of data quality measures within four domains. We describe the process of developing and testing this set of measures, share the results of applying these measures in three EMR-derived datasets, and discuss what this reveals about the measures and EMR data quality. The model is offered as a starting point from which data users can refine their own approach, based on their own needs.
Methods:Using an iterative process, measures of EMR data quality were created within four domains: comparability; completeness; correctness; and currency. We used a series of process steps to develop the measures. The measures were then operationalized, and tested within three datasets created from different EMR software products.
Results:A set of eleven final measures were created. We were not able to calculate results for several measures in one dataset because of the way the data were collected in that specific EMR. Overall, we found variability in the results of testing the measures (e.g. sensitivity values were highest for diabetes, and lowest for obesity), among datasets (e.g. recording of height), and by patient age and sex (e.g. recording of blood pressure, height and weight).
Conclusions:This paper proposes a basic model for assessing primary health care EMR data quality. We developed and tested multiple measures of data quality, within four domains, in three different EMR-derived primary health care datasets. The results of testing these measures indicated that not all measures could be utilized in all datasets, and illustrated variability in data quality. This is one step forward in creating a standard set of measures of data quality. Nonetheless, each project has unique challenges, and therefore requires its own data quality assessment before proceeding.
Keywords:Primary health care, Computerized medical records, Electronic medical records, Data quality
Background
The increased use of electronic medical records (EMRs) in Canadian primary health care practice [1–3] has re-sulted in an expansion of the availability of EMR data. These data are being put to uses such as quality improve-ment activities related to patient care, and secondary pur-poses such as research and disease surveillance [4,5]. This has shifted the traditional use of medical records as an
aide-memoireto that of a data collection system [6]. Yet the nature of the data that a primary health care practi-tioner requires for the care of patients can differ from what is needed for other purposes, for example, research [7]. Therefore, the overall assessment of the quality of these data can vary depending on their intended use. This characteristic of data quality is aligned with the concept of “fitness for purpose”, i.e. are the data of appropriate qual-ity for the use to which they are going to be applied [8,9].
Electronic medical records contain data that do not exist elsewhere, and can inform questions about primary health care; these data offer a unique window into pa-tient care. As the foundation of the health care system, primary health care is where the majority of patient care * Correspondence:[email protected]
ˆDeceased 1
Department of Family Medicine, Department of Epidemiology & Biostatistics, Schulich Interfaculty Program in Public Health, Schulich School of Medicine & Dentistry, The University of Western Ontario, 1151 Richmond Street, London, Ontario N6A 3K7, Canada
Full list of author information is available at the end of the article
is provided, and thus is a significant part of the system for which to consider data quality [10,11]. Stakeholders interested in primary health care EMR adoption and use in Canada have recognized the importance of under-standing data quality [12]. Current information regarding Canadian primary health care EMR data suggests there is variability in levels of quality. In particular, issues have been identified in the completeness of risk factor information
[13, 14] chronic disease documentation [15], recording of
weight and family history [14], and socio-demographic data quality [16] . This echoes the evidence from other countries [17–19], from studies conducted in the past [20–22] and in other health care settings [23]. Overall, these results reinforce that EMR data quality is an ongoing issue, par-ticularly for researchers.
It is incumbent upon us therefore, as potential users of primary health care EMR data, to understand their qual-ity in relation to the uses to which they are applied. For example, primary health care practitioners require tools that use EMR data to support the increasingly complex care of their patients [24]. Additionally, high quality data are needed for reporting on quality of care provision [25]. Decision support functions of the EMR work best when the system contains accurate information [26]. Re-searchers need data of high quality to reduce bias and the risk of erroneous conclusions in their studies. Decision-makers also seek standardized, aggregated PHC data (across EMRs) for policy-making and planning.
Tests of data quality, when defined in terms of fitness for purpose, thus vary across these three perspectives: clinical, research, and decision-making. Having measures in place with which to assess EMR data quality is a pre-cursor to any assessment activity, and needed to under-pin all three perspectives. While some guidance exists regarding data quality evaluation (please see Add-itional file 1: Appendix A), much of the recent primary health care EMR data quality literature focuses on either process steps [27], or the results of data quality assess-ments in one domain, such as completeness [13–15,17]. In addition, there currently is no consensus on how data quality assessments should be approached, nor the mea-sures of data quality that should be used [8].
In the following, we describe a process of conceptu-alizing, developing, and testing a set of measures of primary health care EMR data quality, within four do-mains: comparability; completeness; correctness; and currency. We share the results of applying these mea-sures in three EMR-derived datasets, and discuss what this reveals about the measures and EMR data qual-ity. This builds on previous EMR data quality work (see above and Additional file 1: Appendix A), but differs because we developed and tested multiple measures of data quality, within four domains, in
three different EMR-derived primary health care datasets.
Herein we propose a basic model for assessing primary health care EMR data quality, comprising a set of data quality measures within four domains. This model is of-fered as a starting point from which data users can re-fine their own approach, based on their own needs.
Methods
Basic model of primary health care EMR data quality
Four overall tasks were completed in developing the basic model of primary health care EMR data quality: 1) conceptualizing data quality domains; 2) developing data quality measures; 3) operationalizing the data quality measures; and 4) testing the data quality measures.
Conceptualizing data quality domains
Focusing on the assessment of EMR data quality from the research perspective, we conceptualized the meas-urement of EMR data quality within four domains. The first iscomparability which is aligned with the concept of reliability [28]. In the context of EMR data quality we can extend this concept to mean the degree to which EMR data are consistent with, or comparable to, an ex-ternal data source [29, 30]; results of this comparison affect the generalizability of our analyses. Second, is completeness which is referred to by Hogan and Wag-ner as “..the proportion of observations made about the world that were recorded in the CPR [computer-based patient records]..” [31]. Third, correctness has been de-fined as“..the proportion of CPR observations that are a correct representation of the true state of the world..” [31]. This dimension is reflective of the concept of valid-ity, i.e. “..the degree to which a measurement measures what it purports to measure”[28]. Finally, the fourth do-main iscurrencyortimeliness[32,33] - the latter asks, “Is an element in the EHR [electronic health record] a relevant representation of the patient state at a given point in time?”[33]. We used a series of process steps to develop and test a set of EMR data quality measures, (defined as metrics or indicators of data quality) within these domains.
Developing the data quality measures
drawbacks of each potential measure according to these criteria, we created an initial set of measures.
Operationalizing the data quality measures
We conducted three steps to operationalize the mea-sures. First, we identified test conditions to be used with the measures. The research team generated a list of thir-teen conditions based on their prevalence in primary health care practice, previous use in EMR data quality research, and clinician team member input. After a process of assessment regarding the clinical importance of the conditions, the availability of relevant data in the EMR (i.e. would the condition be recorded in the cumu-lative patient profile or the problem list), and the feasi-bility of finding the data (i.e. presence of data in the structured portion of the EMR data vs. notes portion of the record), six conditions were selected for use: dia-betes, hypertension, hypothyroidism, asthma, obesity, and urinary tract infection. Second, we needed to create case definitions so that patients with the test conditions could be identified (see Additional file 2: Appendix B). We could not use existing validated EMR case defini-tions that contain a billing code [34] because for two of the measures we needed to compare the proportion of patients who actually had diabetes and hypertension (ac-cording to our definition) against the proportion with a billing code for these conditions. Three family physician members of the team (SC, JNM, JS) assessed the case definitions that were created according to expected pa-tient treatment practices and recording patterns in the EMR. Information including the problem list, medica-tions, laboratory results, blood pressure readings, and BMI data contained in the databases was used. Multiple steps were undertaken to process each EMR data element used in the definitions. For example, free text recording of medication names and problem list entries were screened and verified by the clinical research team members. Third, we determined the specific details of each measure, for ex-ample the age ranges of the patients as applicable. Finally the statistical tests for the appropriate measures were de-termined. Please see Table1for details.
Testing of the data quality measures
Next we tested the measures sequentially in three data-sets built from data extracted from three different EMR software products (herein referred to as dataset A, B, and C). The details of the datasets are as follows: dataset A - 43 family physicians from 13 sites contributed data for 31, 000 patients from Jan 1, 2006 to Dec 31, 2015; dataset B - 15 family physicians contributed data for 2472 patients from July 1st, 2010 to June 30, 2014; data-set C - 10 family physicians from 1 site contributed data for 14,396 patients from March 1st, 2006 to June 30, 2010 (please see Table 2). These datasets were created
for the Deliver Primary Healthcare Information (DEL-PHI) project; this study is part of the DELPHI project. De-identified data are extracted from primary health care practices in Southwestern Ontario, Canada and combined to create the datasets which form the DELPHI database.
The datasets included in the DELPHI database are ex-tracted from the EMR as a set of relational tables. For example, there is one table to store patient sex and age, and another table to store their scheduled appointments - these are linked by a unique patient identifier. The structure of the tables depends on the EMR software provider. For example, some EMRs provide discrete fields to enter height or weight information and specify the metric to be used, and drop down menus to select diagnosis codes. Other EMRs provide open fields for the provider to enter free text. Each dataset was analyzed separately to identify the location of the fields used in the data quality assessment. Datasets A and B had a higher proportion of structured fields for data entry, while Dataset C had several areas of free text that were searched and coded for analysis.
Written consent was obtained from all physician partici-pants in the DELPHI project. The physicians are the data custodians of the patient’s EMR. DELPHI data extraction procedures, consent processes, and methods are described more fully elsewhere [35]. The DELPHI project was ap-proved by The University of Western Ontario’s Health Sciences Research Ethics Board (number 11151E).
Within the process of testing the measures, several from the initial set were modified, or dropped, while others were added through the course of the study (e.g. % of patients with one or more entries on the problem list). We could not calculate several measures in dataset C (due to absence of laboratory values in a specific for-mat for diabetes, and the different forfor-mat of the problem list). However, we were able to calculate the remainder of the measures in the three datasets. This resulted in a final set of eleven measures (see Table1).
Results
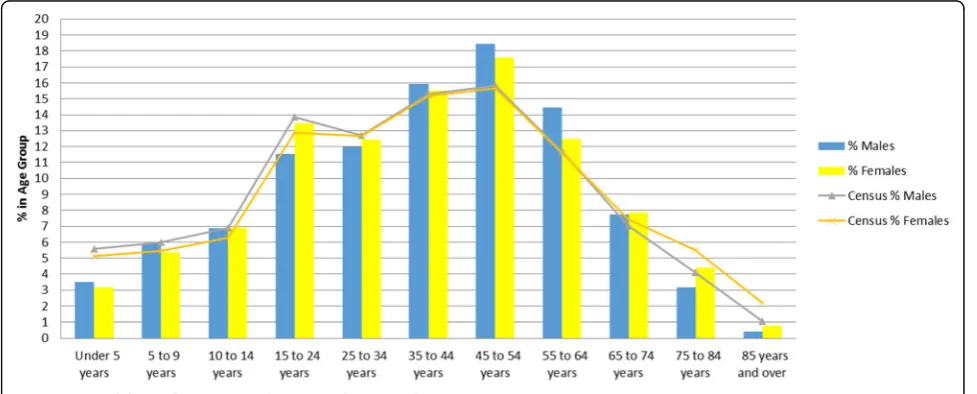
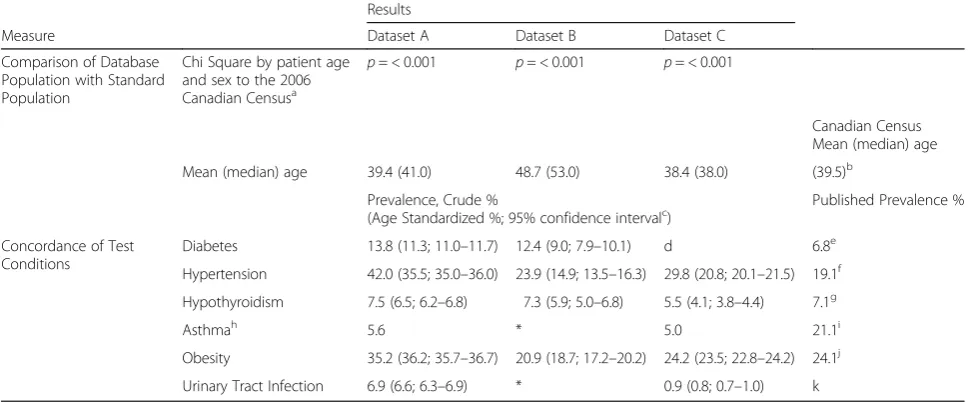
Data quality assessment Comparability
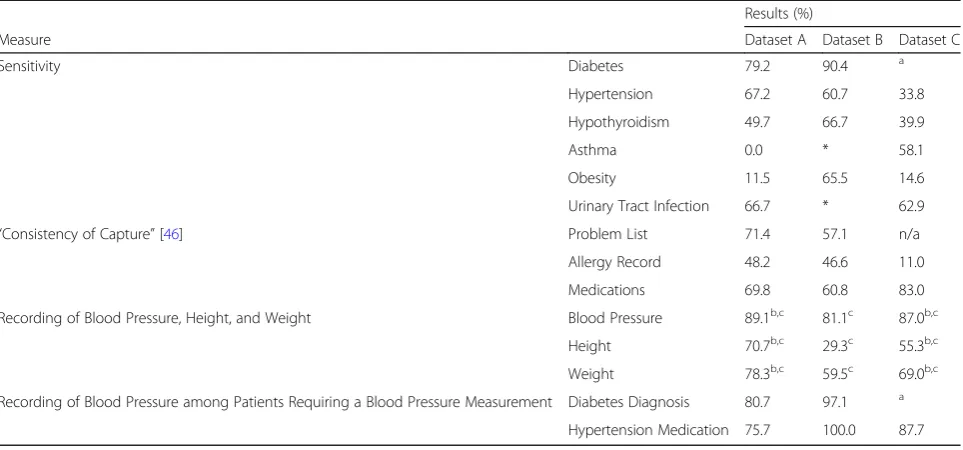
Completeness
Variability in sensitivity values for the test conditions was found, ranging from 12% for obesity in dataset A, to 90% for diabetes in dataset B (see Table 4). For the “consistency of capture” measure, completeness varied from a low of 11% for allergy recording in dataset C, to a high of 83% for medication recording in dataset C. Completeness of blood pressure recording was over 80% in all three datasets, while height ranged from 29% in dataset B to 71% in dataset A, and weight ranged from 60% in dataset B to 78% in dataset A. Significant differ-ences in recording by sex were found for blood pressure,
height and weight in datasets A and B, with females hav-ing a higher level of recordhav-ing, while dataset B showed no difference in level of recording by sex. In contrast, significant differences were observed by age group for blood pressure, height and weight recording in all three datasets, with the highest level of recording for patients aged 45–59 years of age. The proportion of patients with diabetes who had a blood pressure recording was high (ranging from 81% in dataset A to 97% in dataset B). For patients taking hypertension medications, completeness of recording of blood pressure was also high - ranging from 76% in dataset A to 100% in dataset B.
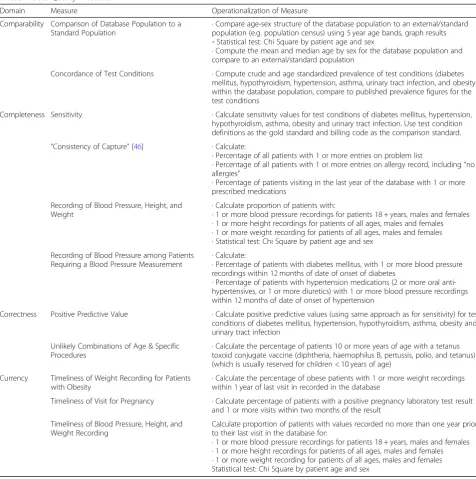
Table 1Data Quality Measures
Domain Measure Operationalization of Measure
Comparability Comparison of Database Population to a
Standard Population ∙
Compare age-sex structure of the database population to an external/standard population (e.g. population census) using 5 year age bands, graph results ∘Statistical test: Chi Square by patient age and sex
∙Compute the mean and median age by sex for the database population and compare to an external/standard population
Concordance of Test Conditions ∙Compute crude and age standardized prevalence of test conditions (diabetes mellitus, hypothyroidism, hypertension, asthma, urinary tract infection, and obesity) within the database population, compare to published prevalence figures for the test conditions
Completeness Sensitivity ∙Calculate sensitivity values for test conditions of diabetes mellitus, hypertension, hypothyroidism, asthma, obesity and urinary tract infection. Use test condition definitions as the gold standard and billing code as the comparison standard. “Consistency of Capture”[46] ∙Calculate:
∙Percentage of all patients with 1 or more entries on problem list
∙Percentage of all patients with 1 or more entries on allergy record, including“no allergies”
∙Percentage of patients visiting in the last year of the database with 1 or more prescribed medications
Recording of Blood Pressure, Height, and
Weight ∙
Calculate proportion of patients with:
∙1 or more blood pressure recordings for patients 18 + years, males and females ∙1 or more height recordings for patients of all ages, males and females ∙1 or more weight recording for patients of all ages, males and females ∙Statistical test: Chi Square by patient age and sex
Recording of Blood Pressure among Patients Requiring a Blood Pressure Measurement ∙
Calculate:
∙Percentage of patients with diabetes mellitus, with 1 or more blood pressure recordings within 12 months of date of onset of diabetes
∙Percentage of patients with hypertension medications (2 or more oral anti-hypertensives, or 1 or more diuretics) with 1 or more blood pressure recordings within 12 months of date of onset of hypertension
Correctness Positive Predictive Value ∙Calculate positive predictive values (using same approach as for sensitivity) for test conditions of diabetes mellitus, hypertension, hypothyroidism, asthma, obesity and urinary tract infection
Unlikely Combinations of Age & Specific Procedures
∙Calculate the percentage of patients 10 or more years of age with a tetanus toxoid conjugate vaccine (diphtheria, haemophilus B, pertussis, polio, and tetanus) (which is usually reserved for children < 10 years of age)
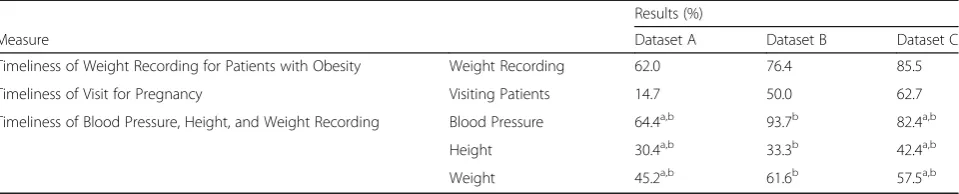
Currency Timeliness of Weight Recording for Patients with Obesity
∙Calculate the percentage of obese patients with 1 or more weight recordings within 1 year of last visit in recorded in the database
Timeliness of Visit for Pregnancy ∙Calculate percentage of patients with a positive pregnancy laboratory test result and 1 or more visits within two months of the result
Timeliness of Blood Pressure, Height, and Weight Recording
Calculate proportion of patients with values recorded no more than one year prior to their last visit in the database for:
Correctness
Positive predictive values were found to be variable for the test conditions and across datasets, ranging from 4% for obesity in dataset B, to 80% for diabetes in dataset A (see Table5). The presence of a tetanus toxoid conjugate vaccination among those 10 years of age and older was 0% in all three datasets.
Currency
Recording of weight for patients with obesity within one year of their last visit ranged from 62% in dataset A to 86% in dataset C (see Table 6). Office visits within two months for patients with a positive pregnancy test result ranged from 15% in dataset A, to 63% in dataset C. Blood pressure recording no more than one year prior to a patient’s last visit ranged from 64% in dataset A to 94% in dataset B. Significant differences were observed for males and females in dataset A and C, and by age in
all three datasets for blood pressure. For height record-ing no more than one year prior to a patient’s last visit, values ranged from 30% in dataset A to 42% in dataset C. Significant differences for height by sex were found only for dataset A, however significant differences were found in height recording by age across all three data-sets. For weight recording no more than a year prior to a patient’s last visit, values ranged from 45% in dataset A to 62% in dataset B. Significant differences by age were observed for weight recording across all three datasets, while differences by sex were found in dataset A alone.
Discussion
In this study we developed eleven measures of primary health care EMR data quality, and tested them within three EMR-derived datasets. We were not able to calcu-late results for several measures in one dataset because of the way the data were collected in that specific EMR. Table 2Patient Characteristics in Each Dataset
Dataset A Dataset B Dataset C
Years of Data January 1, 2006-December 31, 2015 July 1, 2010-June 30, 2014 March 1, 2006-June 30, 2010
# % # % # %
Sex
Males 14,619 47.2% 1126 45.6% 6614 45.9%
Females 16,381 52.8% 1346 54.4% 7782 54.1%
Total 31,000 100.0% 2472 100.0% 14,396 100.0%
Missing Sex 5 0 0
Age As of January 1, 2006 As of July 1, 2010 As of March 1, 2006
Mean 39.4 48.7 38.4
Median 41 53 38
Missing Age 1367 0 5
Note: cases with complete sex and age information are included
Overall, we found variability in the results of testing the measures among the test conditions (e.g. sensitivity values were highest for diabetes, and lowest for obesity), among datasets (e.g. recording of height), and by patient age and sex (e.g. recording of blood pressure, height and weight). Several of these results are in keeping with other studies of primary health care EMR data quality in Canada. For example, Singer et al. (2016) found differing levels of the completeness of recording for a set of chronic dis-eases [15]. The results of this study pertaining to re-cording of measures such as height and weight differ from Tu et al. (2015), however, overall patterns such as less frequent recording of weight versus blood pressure were similar.
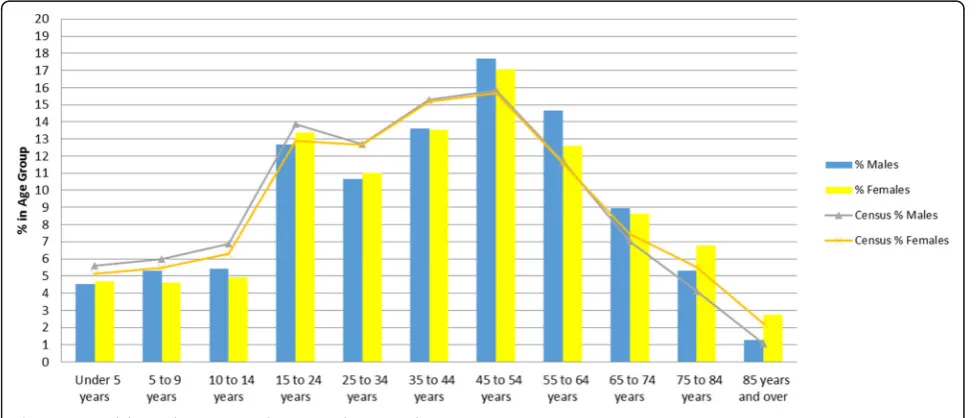
Some of this variability is to be expected. For example, one could anticipate blood pressure would be recorded less frequently among younger age groups. Similarly, the high level of completeness of blood pressure recording among patients with diabetes and those taking hyperten-sion medications is perhaps not surprising. However, other results such as no difference in the completeness of blood pressure, height, and weight recording for male and female patients in dataset B versus datasets A and C, do not have an obvious explanation. Some practice sites may have decided that blood pressure, height, and weight should be universally recorded among males and females. In general, practices may record height less fre-quently than weight, because height varies less over time than weight. This speaks to the importance of Fig. 2Comparability to the 2006 Canadian Census by Age and Sex–Dataset B
understanding the nature of the data in the context of their potential use. The measures developed for this study help illuminate some of the nuances associated with primary health care EMR data. For example, re-searchers seeking to answer a question regarding pa-tients with hypertension may want to be aware that these patients could have higher levels of blood pressure recording than other patients, and thus may want to consider a study of medication adherence among these patients as opposed to a study of the prevalence of high blood pressure.
Despite advancement in the field, the most recent pri-mary health care EMR data quality literature focuses mainly on describing process steps regarding the assess-ment of data quality, or on determining one aspect of data quality such as completeness. Reporting guidelines exist for studies using routinely collected health data
[36,37], which highlight the importance of data quality.
However, a small proportion of studies using EMR data report on quality assessments [38], with the exception of studies associated with well-established primary health care EMR databases [39,40]. This may be partly because there is a lack of consensus on the process steps for
assessing data quality, the measures to be used, and fi-nally, what acceptable levels for primary health care EMR data quality are [8]. Creating these standards is a challenging task, given that different data are required for different questions, and the level of quality needed varies with types of data use. Developing and testing measures of primary health care EMR data quality is a necessary foundational step in this task.
Assessing primary health care EMR data quality is a complex process. There are many factors that play into how these data come to be, including: how users interact with the EMR and enter data; the EMR system itself; practice characteristics, such as how external data are incorporated in the EMR [8], and the nature of patient populations [41]. The user of primary health care data needs to be aware of the possible impact of these factors. For example, some software programs provide a cumula-tive patient profile or “problem list” area of the EMR where current diagnoses can be recorded for a patient in a free text field, while others provide a structured“health condition” section with drop-down lists and coded diag-noses, or both. Thus, even within the datasets in our own database we found we could not calculate all the Table 3Comparability Measures
Results
Measure Dataset A Dataset B Dataset C
Comparison of Database Population with Standard Population
Chi Square by patient age and sex to the 2006 Canadian Censusa
p= < 0.001 p= < 0.001 p= < 0.001
Canadian Census Mean (median) age
Mean (median) age 39.4 (41.0) 48.7 (53.0) 38.4 (38.0) (39.5)b
Prevalence, Crude %
(Age Standardized %; 95% confidence intervalc) Published Prevalence %
Concordance of Test Conditions
Diabetes 13.8 (11.3; 11.0–11.7) 12.4 (9.0; 7.9–10.1) d 6.8e
Hypertension 42.0 (35.5; 35.0–36.0) 23.9 (14.9; 13.5–16.3) 29.8 (20.8; 20.1–21.5) 19.1f
Hypothyroidism 7.5 (6.5; 6.2–6.8) 7.3 (5.9; 5.0–6.8) 5.5 (4.1; 3.8–4.4) 7.1g
Asthmah 5.6 * 5.0 21.1i
Obesity 35.2 (36.2; 35.7–36.7) 20.9 (18.7; 17.2–20.2) 24.2 (23.5; 22.8–24.2) 24.1j
Urinary Tract Infection 6.9 (6.6; 6.3–6.9) * 0.9 (0.8; 0.7–1.0) k
*cell sizes less than 5 are suppressed a
The 2006 Canadian Census was selected because age was measured at the start of each dataset. Two of the three datasets began in 2006 b
Mean age for Canadian Census is not reported c
The 1991 Canadian Census of Population is used as the standard population by Statistics Canada d
Diabetes was not measured in Dataset C e
Source: Public Health Agency of Canada. 2011. Diabetes in Canada: Facts and Figures from a public health
perspective. (
https://www.canada.ca/en/public-health/services/chronic-diseases/reports-publications/diabetes/diabetes-canada-facts-figures-a-public-health-perspective.html) f
Public Health Agency of Canada Report. 2010. Report from the Canadian Chronic Disease Surveillance System: Hypertension in Canada,
2010. (
https://www.canada.ca/en/public-health/services/chronic-diseases/cardiovascular-disease/report-canadian-chronic-disease-surveillance-system-hypertension-canada-2010.html) g
Gagnon F, Langlois MF, Michaud I, Gingras S, Duchesen JF, Levesque B. 2006. Spatio-temporal distribution of hypothyroidism in Quebec. Chronic Diseases in
Canada; 27 [1]
h
Asthma prevalence was not age standardized because the definition was limited to patients less than 18 years old i
Gershon A.S., Guan J, Wang C, To T. 2010. Trends in Asthma Prevalence and Incidence in Ontario, 1996–2005: A Population Study. Am J Epidemiol 172;728–736 j
Statistics Canada. 2011. Adult obesity prevalence in Canada and the United States. (http://www.statcan.gc.ca/pub/82-625-x/2011001/article/11411-eng.htm)
k
measures we had developed because of differences in EMR structures. This is a particular difficulty that ap-plies to the Canadian context where a plethora of EMRs are utilized by primary health care practitioners, each with its own configuration [27]. Furthermore, different data extraction tools can produce different results [42], adding an additional layer of complexity to this picture.
While the measures presented here are meant to as-sess overall EMR data quality, each question that one hopes to answer using EMR data is unique. There-fore, when assessing the “fitness” of the data for its intended purpose [9] one needs to apply both broad considerations captured in the aforementioned frame-works, including the provenance of the data [43], and narrow ones – applying specific quality measures to the data elements that are to be used [8, 37, 44]. If
we stay true to a broad conceptualization as fitness for purpose, then each question posed that will be answered through the use of EMR data can be con-sidered unique in the context of data quality. Mea-sures serve as tools that can be deployed in a data quality assessment activity, but they are not sufficient in and of themselves to properly assess data quality in terms of a particular question or project. However, a sustained program of testing measures in a wide variety of jurisdictions, across EMR types – could allow the creation of a standard set of measures of data quality for general use. Over time, these mea-sures could be collected into a library (to be shared widely) which would assist those who seek to conduct and report on their own data quality assessments. We recommend that data users examine the suite of Table 4Completeness Measures
Results (%)
Measure Dataset A Dataset B Dataset C
Sensitivity Diabetes 79.2 90.4 a
Hypertension 67.2 60.7 33.8
Hypothyroidism 49.7 66.7 39.9
Asthma 0.0 * 58.1
Obesity 11.5 65.5 14.6
Urinary Tract Infection 66.7 * 62.9
“Consistency of Capture”[46] Problem List 71.4 57.1 n/a
Allergy Record 48.2 46.6 11.0
Medications 69.8 60.8 83.0
Recording of Blood Pressure, Height, and Weight Blood Pressure 89.1b,c 81.1c 87.0b,c
Height 70.7b,c 29.3c 55.3b,c
Weight 78.3b,c 59.5c 69.0b,c
Recording of Blood Pressure among Patients Requiring a Blood Pressure Measurement Diabetes Diagnosis 80.7 97.1 a
Hypertension Medication 75.7 100.0 87.7
*cell sizes less than 5 are suppressed a
Diabetes was not measured in Dataset C b
Significant differences by Sex (p< .001)
c
Significant differences by Age (p< .001)
Table 5Correctness Measures
Results (%)
Measure Dataset A Dataset B Dataset C
Positive Predictive Value Diabetes 79.5 48.9 a
Hypertension 77.9 58.7 65.8
Hypothyroidism 60.7 37.6 76.0
Asthma 0.0 * 16.1
Obesity 83.5 4.0 61.8
Urinary Tract Infection 0.1 * 3.5
Unlikely Combinations of Age & Specific Procedures Tetanus Toxoid Conjugate Vaccination 0.0 0.0 0.0
*cell sizes less than 5 are suppressed a
measures available and determine which would be the most applicable in their own particular context as they are conducting data quality assessments. From a broader perspective, guidance also exists in the litera-ture regarding data quality management and the gov-ernance of health information [45].
Strengths and limitations
There are several potential limitations of this study. The first is that our assessment of data quality is focused on the structured data elements within the three EMR data-sets – not the narrative or notes portion of the record. This limitation reflects a choice made by DELPHI re-searchers not to extract the narrative portion of the EMR data, for patient privacy reasons. Based on our un-derstanding of our EMR datasets, the majority of the data needed for the analysis would be found in the struc-tured portion of the EMR data. Second, our assessment of data quality will be generalizable only to three types of Canadian EMR software products. Third, in the Can-adian context, diagnostic codes are submitted for billing purposes (used in our case definitions for the test condi-tions), while in other jurisdictions, diagnoses are not linked to billing. Despite these factors, the three datasets are based on EMR data from a large number of practi-tioners working within many practice types and commu-nities in Southwestern Ontario. It was not within the scope of this study to systematically assess the individual recording practices among all the DELPHI sites; this would have allowed us more fully explain some of the results. A strength of this study is that it focuses on assessing data quality primarily using data within the EMR itself. This approach is the most feasible method to implement on a wide scale, in contrast to methods using external reference data.
Conclusion
This paper proposes a basic model for assessing primary health care EMR data quality. We developed and tested multiple measures of data quality, within four domains, in three different EMR-derived primary health care data-sets. The results of testing these measures indicated that
not all measures could be utilized in all datasets, and illustrated variability in data quality. This is one step for-ward in creating a standard set of measures of data qual-ity. Nonetheless, each project has unique challenges, and therefore requires its own data quality [46] assessment before proceeding.
Additional files
Additional file 1: Appendix A.- Literature Review - Assessing Electronic Medical Record Data Quality. A brief literature review of approaches to primary health care EMR data quality assessment. (DOCX 37 kb)
Additional file 2: Appendix B.- Algorithms to Identify Patients with
the Test Conditions. A table outlining the component of the algorithms used to identify patients with the test conditions used in this study. (DOCX 13 kb)
Abbreviations
DELPHI:Deliver Primary Healthcare Information; EMR: Electronic Medical Record
Acknowledgements
We thank the DELPHI participants. Dr. Stewart held the Dr. Brian W. Gilbert Canada Research Chair in Primary Health Care Research from 2003 to 2017. Dr. Thind held a Canada Research Chair in Health Services Research from 2008 to 2018.
The authors of this paper wish to acknowledge and honour the work of Dr. Joshua Shadd. Dr. Shadd died on December 15th, 2018. We have lost a brilliant and compassionate colleague whose contributions to research and patient care inspire us to strive not for perfection, but excellence.
Funding
This study was funded by the Canadian Institutes of Health Research (#105431).
Availability of data and materials
De-identified patient data contained in the DELPHI database are collected from physicians who have consented to participation in this study. Participants agreed to share these data for the purposes of the DELPHI study only, therefore these data are not publically available.
Authors’contributions
ALT-study conception & design, data analysis, drafting of manuscript, revision of manuscript. MS-study conception & design, revision of manuscript. SC-study conception & design, revision of manuscript. JNM-SC-study conception & design, revision of manuscript. SdeL-study conception & design, revision of manuscript. BC-study conception & design, revision of manuscript. VC-study conception & design, data acquisition, data analysis, revision of manuscript. HM-study conception & design, data analysis, revision of manuscript. JS-study conception & design, revision of manuscript. FB-study conception & design, Table 6Currency Measures
Results (%)
Measure Dataset A Dataset B Dataset C
Timeliness of Weight Recording for Patients with Obesity Weight Recording 62.0 76.4 85.5
Timeliness of Visit for Pregnancy Visiting Patients 14.7 50.0 62.7
Timeliness of Blood Pressure, Height, and Weight Recording Blood Pressure 64.4a,b 93.7b 82.4a,b
Height 30.4a,b 33.3b 42.4a,b
Weight 45.2a,b 61.6b 57.5a,b
a
Significant differences by Sex (p< .001)
b
revision of manuscript. AT-study conception & design, revision of manuscript. All authors read and approved the final manuscript.
Ethics approval and consent to participate
The DELPHI project received approval from The University of Western Ontario’s Review Board for Health Sciences Research Involving Human Subjects (number 11151E).Written consent was obtained from all physician participants in the DELPHI project. The physicians are the data custodians of the patient’s EMR.
Consent for publication
Not applicable.
Competing interests
The authors declare they have no competing interests.
Publisher’s Note
Springer Nature remains neutral with regard to jurisdictional claims in published maps and institutional affiliations.
Author details
1Department of Family Medicine, Department of Epidemiology & Biostatistics, Schulich Interfaculty Program in Public Health, Schulich School of Medicine & Dentistry, The University of Western Ontario, 1151 Richmond Street, London, Ontario N6A 3K7, Canada.2Department of Family Medicine, Department of Epidemiology & Biostatistics, Schulich School of Medicine & Dentistry, The University of Western Ontario, 1151 Richmond Street, London, Ontario N6A 3K7, Canada.3Department of Clinical and Experimental Medicine, University of Surrey, Guildford, Surrey GU2 7XH, UK.4School of Physical Therapy, Faculty of Health Sciences, Department of Epidemiology & Biostatistics, Schulich School of Medicine & Dentistry, The University of Western Ontario, 1151 Richmond Street, London, Ontario N6A 3K7, Canada. 5Science and Software Educator and Consultant, 58 Moraine Walk, London, Ontario N6G 4Y8, Canada.6Department of Family Medicine, Schulich School of Medicine & Dentistry, The University of Western Ontario, 1151 Richmond Street, London, Ontario N6A 3K7, Canada.7Department of Family Medicine, McMaster University, 100 Main Street West, 6th Floor, Hamilton, Ontario L8P 1H6, Canada.8Department of Family Medicine, Dalhousie University, 5909 Veterans Memorial Lane, Abbie J Lane Building, Room 8101B, Halifax, Nova Scotia B3H 2E2, Canada.9Department of Family Medicine, Department of Epidemiology & Biostatistics, Schulich Interfaculty Program in Public Health, Schulich School of Medicine and Dentistry, The University of Western Ontario, 1151 Richmond Street, London, Ontario N6A 3K7, Canada.
Received: 25 January 2018 Accepted: 2 January 2019
References
1. Schoen C, Osborn R, Squires D, et al. A survey of primary care doctors in ten countries shows progress in use of health information technology, less in other areas. Health Aff (Millwood). 2012;31:2805–16.
2. Osborn R, Moulds D, Schneider EC, Doty MM, Squires D, Sarnak DO. Primary care physicians in ten countries report challenges caring for patients with complex health needs. Health Aff (Millwood). 2015;34:2104–12. 3. Chang F, Gupta N. Progress in electronic medical record adoption in
Canada. Can Fam Physician. 2015;61:1076–84.
4. Canadian Primary Care Sentinel Surveillance Network. 2013.http://cpcssn. ca/. Accessed January 19, 2018.
5. Carr H, de LS, Liyanage H, Liaw ST, Terry A, Rafi I. Defining dimensions of research readiness: a conceptual model for primary care research networks. BMC Fam Pract. 2014;15:169.
6. Freeman TR. Stewardship of resources, patient information, and data. In: Freeman TR. McWhinney's textbook of family medicine. 4th ed. New York: Oxford University Press; 2016. p. 407–16.
7. Dungey S, Glew S, Heyes B, Macleod J, Tate AR. Exploring practical approaches to maximising data quality in electronic healthcare records in the primary care setting and associated benefits. Report of panel-led discussion held at SAPC in July 2014. Prim Health Care Res Dev. 2016;17:448–52.
8. de Lusignan S, Liaw ST, Krause P, et al. Key concepts to assess the readiness of data for international research: data quality, lineage and provenance, extraction and processing errors, traceability, and curation. Contribution of
the IMIA primary health care informatics working group. Yearb Med Inform. 2011;6:112–20.
9. de Lusignan S. The optimum granularity for coding diagnostic data in primary care: report of a workshop of the EFMI primary care informatics working group at MIE 2005. Inform Prim Care. 2006;14:133–7. 10. Stewart M, Ryan B. Ecology of health care in Canada. Can Fam Physician.
2015;61:449–53.
11. Green LA, Fryer GE Jr, Yawn BP, Lanier D, Dovey SM. The ecology of medical care revisited. N Engl J Med. 2001;344:2021–5.
12. Terry AL, Stewart M, Fortin M, et al. Stepping up to the plate: an agenda for research and policy action on electronic medical records in Canadian primary healthcare. Healthc Policy. 2016;12:19–32.
13. Greiver M, Barnsley J, Glazier RH, Harvey BJ, Moineddin R. Measuring data reliability for preventive services in electronic medical records. BMC Health Serv Res. 2012;12:116.
14. Tu K, Widdifield J, Young J, et al. Are family physicians comprehensively using electronic medical records such that the data can be used for secondary purposes? A Canadian perspective. BMC Med Inform Decis Mak. 2015;15:67. 15. Singer A, Yakubovich S, Kroeker AL, Dufault B, Duarte R, Katz A. Data quality of
electronic medical records in Manitoba: do problem lists accurately reflect chronic disease billing diagnoses? J Am Med Inform Assoc. 2016;23:1107–12. 16. Laberge M, Shachak A. Developing a tool to assess the quality of
socio-demographic data in community health centres. Appl Clin Inform. 2013;4:1–11. 17. Staff M, Roberts C, March L. The completeness of electronic medical record
data for patients with type 2 diabetes in primary care and its implications for computer modelling of predicted clinical outcomes. Prim Care Diabetes. 2016;10:352–9.
18. Barkhuysen P, de GW, Akkermans R, Donkers J, Schers H, Biermans M. Is the quality of data in an electronic medical record sufficient for assessing the quality of primary care? J Am Med Inform Assoc. 2014;21:692–8. 19. Bailie R, Bailie J, Chakraborty A, Swift K. Consistency of denominator data in
electronic health records in Australian primary healthcare services: enhancing data quality. Aust J Prim Health. 2015;21:450–9.
20. Chan KS, Fowles JB, Weiner JP. Review: electronic health records and the reliability and validity of quality measures: a review of the literature. Med Care Res Rev. 2010;67:503–27.
21. Thiru K, Hassey A, Sullivan F. Systematic review of scope and quality of electronic patient record data in primary care. BMJ. 2003;326:1–5. 22. Jordan K, Porcheret M, Croft P. Quality of morbidity coding in general practice
computerized medical records: a systematic review. Fam Pract. 2004;21:396–412. 23. Weiskopf NG, Weng C. Methods and dimensions of electronic health record
data quality assessment: enabling reuse for clinical research. J Am Med Inform Assoc. 2013;20:144–51.
24. Upshur RE, Tracy S. Chronicity and complexity: is what's good for the diseases always good for the patients? Can Fam Physician. 2008;54:1655–8. 25. Ministry of Health and Long-Term Care. Patients First: A Proposal to
Strengthen Patient-Centred Health Care in Ontario: Queen’s Printer for Ontario; 2015.http://www.health.gov.on.ca/en/news/bulletin/2015/docs/ discussion_paper_20151217.pdf. Accessed 19 Jan 2018
26. Hasan S, Padman R. Analyzing the effect of data quality on the accuracy of clinical decision support systems: a computer simulation approach. AMIA Annu Symp Proc. 2006:324–8.
27. Bowen M, Lau F. Defining and evaluating electronic medical record data quality within the Canadian context. ElectronicHealthcare. 2012;11:e5–e13. 28. Last JM, editor. A dictionary of epidemiology. 3rd ed. New York: Oxford
University Press; 1995.
29. Faulconer ER, de Lusignan S. An eight-step method for assessing diagnostic data quality in practice: chronic obstructive pulmonary disease as an exemplar. Inform Prim Care. 2004;12:243–53.
30. Hassey A, Gerrett D, Wilson A. A survey of validity and utility of electronic patient records in a general practice. BMJ. 2001;322:1401–5.
31. Hogan WR, Wagner MM. Accuracy of data in computer-based patient records. JAMIA. 1997;4:342–55.
32. Williams JG. Measuring the completeness and currency of codified clinical information. Methods Inf Med. 2003;42:482–8.
33. Weiskopf NG, Hripcsak G, Swaminathan S, Weng C. Defining and measuring completeness of electronic health records for secondary use. J Biomed Inform. 2013;46:830–6.
35. Stewart M, Thind A, Terry A, Chevendra V, Marshall JN. Implementing and maintaining a researchable database from electronic medical records - a perspective from an academic family medicine department. Healthc Policy. 2009;2:26–39.
36. Benchimol EI, Smeeth L, Guttmann A, et al. The REporting of studies conducted using observational routinely-collected health data (RECORD) statement. PLoS Med. 2015;12:e1001885.
37. de Lusignan S, Metsemakers JFM, Houwink P, Gunnarsdottir V, van der Lei J. Routinely collected general practice data: goldmines for research? A report of the European Federation for Medical Informatics Primary Care Informatics Working Group (EFMI PCIWG) from MIE2006, Maastricht, the Netherlands. Inform Prim Care. 2006;14:203–9.
38. Dean BB, Lam J, Natoli JL, Butler Q, Aguilar D, Nordyke RJ. Review: use of electronic medical records for health outcomes research: a literature review. Med Care Res Rev. 2009;66:611–38.
39. Coleman N, Halas G, Peeler W, Casaclang N, Williamson T, Katz A. From patient care to research: a validation study examining the factors contributing to data quality in a primary care electronic medical record database. BMC Fam Pract. 2015;16:11.
40. Herrett E, Gallagher AM, Bhaskaran K, et al. Data resource profile: clinical practice research datalink (CPRD). Int J Epidemiol. 2015;44:827–36. 41. Weiskopf NG, Rusanov A, Weng C. Sick patients have more data: the
non-random completeness of electronic health records. AMIA Annu Symp Proc. 2013;2013:1472–7.
42. Liaw ST, Taggart J, Yu H, de Lusignan S. Data extraction from electronic health records - existing tools may be unreliable and potentially unsafe. Aust Fam Physician. 2013;42:820–3.
43. Johnson KE, Kamineni A, Fuller S, Olmstead D, Wernli KJ. How the provenance of electronic health record data matters for research: a case example using system mapping. EGEMS (Wash DC ). 2014;2:1058. 44. Kahn MG, Callahan TJ, Barnard J, et al. A harmonized data quality
assessment terminology and framework for the secondary use of electronic health record data. EGEMS (Wash DC ). 2016;4:1244.
45. Liaw ST, Pearce CM, Liyanage H, Liaw GSS, de Lusignan S. An integrated organisation- wide data quality management and information governance framework: theoretical underpinnings. Inform Prim Care. 2014;21(4):199–206. 46. Bowen M. EMR Data Quality Evaluation Guide. 2012. eHealth Observatory,