R E S E A R C H A R T I C L E
Open Access
Changes in the Q-tip angle in relation to
the patient position and bladder filling
Jong-hyun Yun
1, Jae Heon Kim
2, Suyeon Park
3and Changho Lee
4*Abstract
Background:It is hypothesized that patient position, supine or recline, and bladder filling status, empty or full, could change the Q-tip test result. This study evaluated the effect of the patient position and bladder filling status on the Q-tip angle for urethral hypermobility (UH).
Methods:There was a measurement of the Q-tip angle in the supine position and at a 45° angle in a reclining position during bladder emptying; and then the measurements were repeated while filling the bladder. We defined urethral hypermobility as the urethral angle straining or coughing minus that at rest≥30°.
Results:All 63 female patients (mean age: 61.6 years, range: 36–81) who complained of urinary incontinence were assessed using the Q-tip angle test. The pelvic organ prolapse quantification stages of all patients were≤stage 1. The mean Q-tip angle with an empty bladder was 14.1 ± 9.1° in the supine position and 16.4 ± 11.1° in the reclining position (p= 0.001). Then mean Q-tip angle during the filling bladder state was 15.4 ± 9.7° in the supine position and 15.9 ± 11.0° in the reclining position (p= 0.771). The UH rate during the bladder emptying state was 11.1 % (7/63) in the supine position and 19.1 % (12/63) in the reclining position. The UH rate during the bladder filling state was 15.0 % (9/60) in the supine position and 15.3 % (9/59) in the 45° reclining position. The odds ratio (OR) was 7.03 in the reclining position for a positive Q-tip angle. The positive rate was higher in the 45° reclining position during bladder emptying than that in the other position during bladder filling.
Conclusion:The outcome of the Q-tip angle and the rate of UH changed in relation to patient position. The reclining position during bladder emptying increased the Q-tip angle, thereby resulting in a positive UH.
Keywords: Q-tip test, Stress urinary incontinence, Urethra, Urinary incontinence
Background
Urinary incontinence (UI) is the involuntary loss of urine and occurs when bladder pressure exceeds urethral clos-ing pressure. A specific type of UI is stress urinary incon-tinence (SUI) is a complaint of involuntary urine leakage on effort or exertion, or on sneezing or coughing [1].
A poorly supported bladder base and urethrovesical junction (UVJ) are the main explanations for SUI; thus, urethral mobility should be assessed in all women with UI [2, 3]. The cotton swab or Q-tip test is a simple out-patient procedure used to quantify urethral mobility [4]. Although the Q-tip test was introduced more than 40 years ago, and is widely used in clinical practice, there
is limited literature on its use. Furthermore, only a few studies have evaluated the Q-tip examination based on patient position and bladder filling status [5, 6].
We hypothesized that patient position (supine or re-cline), and bladder filling status (empty or full), would change the Q-tip test result, as patient position affects bladder pressure, and bladder filling status can change the shape of the bladder base. To verify our hypothesis, we evaluated the effects of patient position and bladder filling status of Q-tip test results for urethral hypermo-bility (UH).
Methods
We reviewed the medical records of women who pre-sented to one urologist (CL) with urinary incontinence between February 2010 and March 2014. The clinical diagnosis was established based on history taking, in
* Correspondence:[email protected]
4Department of Urology, Soonchunhyang University Cheonan Hospital,
Soonchunhyang University School of Medicine, 31 Soonchunhyang 6 gil, Dongnam-Gu, Cheonan, Chungcheongnam-do 330-721, South Korea Full list of author information is available at the end of the article
particular, the chief complaints of patients. All pa-tients underwent a pelvic examination, including a pelvic organ prolapse quantification (POP-Q) meas-urement and a Q-tip test performed by the same ur-ologist (CL) in the dorsal lithotomy position. The urologist first performed the POP-Q test in the su-pine dorsal lithotomy position and then performed a Q-tip test. The Q-tip test was performed four times in each patient under different conditions. A sterile rubber Nelaton catheter was inserted into the bladder for emptying. Then, a sterile lubricated cotton swab (Q-tip) was introduced through the urethra into the bladder, and then withdrawn carefully until a resist-ance could be felt. This was considered the anatom-ical location of UVJ, with the length of inserted Q-tip is between 3.5 and 4.5 cm from the urethral meatus in all evaluated patients. The resting angle from the horizontal was set to 0° on a goniometer. The patient was asked to strain or cough while the maximum straining angle was measured and recorded as the Q-tip angle. This UVJ angle measurement was done in the supine position and is deemed the first measured Q-tip value. For the second Q-tip measurement value, the patient was moved to a reclining position (ap-proximately 45°) by setting the backrest up on the examination table, and the same Q-tip measurement was repeated. Another sterile rubber Nelaton catheter was inserted, and normal saline was slowly infused using a Toomey syringe until the patient expressed a desire to void. The mean infused volume is 209.7 ± 59.4 mL (range: 50–400) and there is no significant difference of bladder filling volume between 31 MUI and 3 UUI patients versus 27 SUI patients (mean bladder filling volume 209.4 ± 68.4 vs. 210.0 ± 47.2, p= 0.22). The third and fourth Q-tip values for the Q-tip angle was again a measurement in the supine and reclining position. The incontinence provocation test was performed at the end of physical examin-ation, a stress test using coughing. A positive result is indicated by efflux of the bladder solution from the meatus coinciding with the cough.
We reviewed the four Q-tip values and provocation test results on the medical records. There was an exclu-sion of the Q-tip angle data for patients with prolapsed pelvic organs, those over stage 1 according to the POP-Q criteria, and patients who had undergone surgery to correct incontinence. Urethral hypermobility was de-fined as the urethral angle straining or coughing minus that at rest≥30°.
The statistical analysis was performed using SPSS ver. 18.0 software (SPSS Inc., Chicago, IL, USA). The paired t-test was used to evaluate the Q-tip angles associated with the patients’ positions, and those as-sociated with bladder filling status. The generalized
linear mixed model was used to calculate the odds ratio and confidence interval. A p-value <0.05 was considered significant.
Ethics statement
This study protocol was approved by the Soonchunhyang University institutional review board of the human research and ethics committee (No. 1040875-201501-BM-002). They waived the requirement for the investigator to obtain a signed consent form.
Results Patients
We reviewed all 75 medical records of women with urin-ary incontinence. Among them, we excluded the follow-ing: 4 records with pelvic organ prolapsed greater than stage 1; 2 records of previous anti-incontinence surgery; 3 records of performing evaluation two times at different visits; and 3 records of a negative Q-tip value. A total of 63 patients complaining of UI were assessed. Among them, 32 (50.8 %) had mixed urinary incontinence (MUI), 27 (42.9 %) had stress urinary incontinence (SUI), and four (6.3 %) had urgency urinary incontinence (UUI).
Among the 63 patients, 58 had provocation test sults; 55.2 % (32/58) had positive provocation test re-sults. The patients with positive provocation test results had more hypermobile urethra than the patients with negative provocation test results (Table 1). Of the 63 pa-tients with UI, 25 (39.7 %) received a mid-urethral sling (MUS) to manage SUI. Among the 25 patients with MUS, 24 had the following Valsalva leak point pressure (VLPP) data; 33.3 % (8/24) had VLPP≤60 cm H2O,
41.7 % (10/24) had VLPP of 60–89 cm H2O, and 25.0 %
(6/24) had VLPP≥90 cm H2O. The patients with low
VLPP had a tendency of more mobile urethra (Table 1).
Q-tip angle change in relation to position
We analyzed the Q-tip angle change in the 63 patients complaining of UI. The mean Q-tip angle during the bladder emptying state was 14.1 ± 9.1° in the supine pos-ition and 16.4 ± 11.1° in the reclining pospos-ition (p= 0.001). The mean Q-tip angle during the bladder filling state was 15.4 ± 9.7° in the supine position, and 15.9 ± 11.0° in the reclining position (p= 0.771) (Table 2).
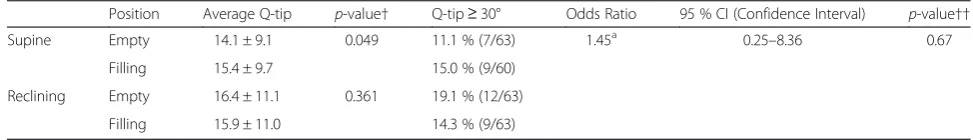
Q-tip angle change in relation to bladder filling state The mean Q-tip angle was 14.1 ± 9.1° in the supine position during the bladder emptying state and 15.4 ± 9.7° during the bladder filling state (p= 0.049). The mean Q-tip angle was 16.4 ± 11.1° in the reclining position during the bladder emptying state and 15.9 ± 11.0° during the bladder filling state (p= 0.361) (Table 3).
The proportion of patients defined as UH during the bladder emptying state in the supine position (Q-tip angle≥30°) was 11.1 % (7/63) and was 15.0 % (9/60) during the bladder filling state. The proportion of pa-tients identified with UH in the reclining position was 19.1 % (12/63) during the bladder emptying state and 14.3 % (9/63) during the bladder filling state. The blad-der filling status had an odds ratio of 1.45 for a positive Q-tip angle (Table 3 and Fig. 2).
Discussion
The Q-tip test was developed to measure the degree of urethral relaxation and mobility during increased intra-abdominal pressure [4, 7, 8]. When a physician performs the Q-tip test, patients are usually positioned in the supine lithotomy position, then the Q-tip is inserted into the blad-der through the urethra, and the angle that the Q-tip moves from horizontal to its final position during straining is measured [5, 8]. The UH was initially defined as a Q-tip angle≥20° from the horizontal position [4]. However, a Q-tip angle≥30° appears to be widely accepted by urol-ogists and urogynecolurol-ogists [3, 9].
The Q-tip angle measures the degree of urethral mobil-ity presented by increased intra-abdominal pressure. Abdominal pressure is approximately two times higher with the patient in the seated position than that when the patient is in the supine position [10]. Because the patient
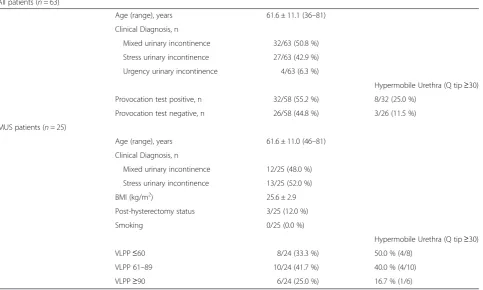
Table 1Basic characteristics of the patients (n= 63)
All patients (n= 63)
Age (range), years 61.6 ± 11.1 (36–81) Clinical Diagnosis, n
Mixed urinary incontinence 32/63 (50.8 %) Stress urinary incontinence 27/63 (42.9 %) Urgency urinary incontinence 4/63 (6.3 %)
Hypermobile Urethra (Q tip≥30) Provocation test positive, n 32/58 (55.2 %) 8/32 (25.0 %)
Provocation test negative, n 26/58 (44.8 %) 3/26 (11.5 %) MUS patients (n= 25)
Age (range), years 61.6 ± 11.0 (46–81) Clinical Diagnosis, n
Mixed urinary incontinence 12/25 (48.0 %) Stress urinary incontinence 13/25 (52.0 %) BMI (kg/m2) 25.6 ± 2.9 Post-hysterectomy status 3/25 (12.0 %) Smoking 0/25 (0.0 %)
Hypermobile Urethra (Q tip≥30) VLPP≤60 8/24 (33.3 %) 50.0 % (4/8)
VLPP 61–89 10/24 (41.7 %) 40.0 % (4/10) VLPP≥90 6/24 (25.0 %) 16.7 % (1/6)
Table 2Comparison of mean Q-tip angles and urethral hypermobility (UH) rates in relation to patient position
Position Average Q-tip p-value† Q-tip≥30° Odds ratio 95 % CI (Confidence interval) p-value†† Empty Supine 14.1 ± 9.1 0.001 11.1 % (7/63) 7.03a 1.01–48.94 0.05
Reclining 16.4 ± 11.1 19.1 % (12/63) Filling Supine 15.4 ± 9.7 0.771 15.0 % (9/60)
Reclining 15.9 ± 11.0 15.3 % (9/59)
a
position affects abdominal pressure, we hypothesized that the patient position would also affect the Q-tip angle measurement. In this study, the mean Q-tip angle was 14.1 ± 9.1° in the supine position during the empty bladder state and 16.4 ± 11.1° in the reclining position (p= 0.001, Table 2). We calculated the UH rate by using a 30° cut-off value to clarify whether this difference was clinically significant. The UH rate was 11.1 % in the supine position in the bladder emptying state, and 19.1 % in the reclining position. The odds ratio was 7.03 in reclining position (Table 2 and Fig. 1). Therefore, we concluded that the patient position (supine or reclining) significantly affected the change in Q-tip angle. The female urethra is more mobile in the reclining position than in the supine position because of elevated abdominal pressure in the reclining position.
The patient’s bladder filling status is usually not consid-ered when physicians measure the Q-tip angle and no reli-able recommendations are availreli-able on bladder filling status while measuring the Q-tip angle [3–5, 7–9]. We hy-pothesized that the bladder filling status would affect the Q-tip angle measurement because it changes the shape of bladder base. Only one report has analyzed Q-tip angle measurements in patients with a symptomatically full
bladder [5]. They reported no difference in either resting or straining Q-tip angle measurements when patients were tested with <150 mL of urine in their bladder as compared with patients with a symptomatically full blad-der. We emptied the patient’s bladder completely using a Nelaton catheter and measured the Q-tip angle in the su-pine and reclining positions. Then, we filled the patient’s bladder until they expressed a desire to urinate, and mea-sured the Q-tip angle again in the supine and reclining po-sitions. The odds ratio was 1.45 for the filled bladder and there is no significant difference in the Q-tip angles be-tween empty and full bladders (Table 3 and Fig. 2). Al-though these findings are supported by previous studies, the reasons are not well understood as to why bladder filling status does not affect the Q-tip angle. Moreover, al-though we found that the reclining position increased the Q-tip angle, this effect dissipated when we measured the Q-tip angle during the bladder filling state. We anticipated that some patients would not have an active response to straining or coughing because of worry or shyness about leaking. We believe that this may be a habitual coping method by some incontinent patients, which may explain why some patients did not show consistent Q-tip angle measurements during the bladder filling state.
Yet, an important question is: which position and blad-der filling condition should be recommended for detecting Fig. 1Comparison of the urethral hypermobility rate in relation to
patient position. Positive urethral hypermobility was defined as a Q-tip angle≥30°
Table 3Comparison of mean Q-tip angles and urethral hypermobility (UH) rates in relation to bladder filling status
Position Average Q-tip p-value† Q-tip≥30° Odds Ratio 95 % CI (Confidence Interval) p-value†† Supine Empty 14.1 ± 9.1 0.049 11.1 % (7/63) 1.45a 0.25–8.36 0.67
Filling 15.4 ± 9.7 15.0 % (9/60) Reclining Empty 16.4 ± 11.1 0.361 19.1 % (12/63)
Filling 15.9 ± 11.0 14.3 % (9/63)
a
Bladder filling status had higher odds of a positive Q-tip angle,p-value†; by pairedt-test,p-value††; by generalized linear mixed model
urethral hypermobility? A good physical examination is a reflection of a patient’s complaints or condition. Most incontinence events in patients with SUI occur in the standing position. Thus, the standing position might be the best position for the Q-tip test. However, previous study showed that the urethra is more mobile in the supine position than that in the standing position, and the sitting position results in a more mobile urethra than that of the supine position [6, 11]. Our current results also demonstrate that the reclining produces a more mobile urethra than that of the supine position (Table 2 and Fig. 1). A more mobile urethra has decreased Valsalva leak point pressure and is associated with the success rate of the tension-free vaginal tape procedure [12, 13]. These observations indicate that UH is an explanation for SUI but not for the female SUI mechanism.
Our study has some limitations, of which the first is its retrospective nature, which did not ensure complete data collection for all patients. Among enrolled 63 patients, we could not obtain important variables, such as body mass index (BMI), parity, and the post-hysterectomy status, except for 25 patients who had undergone an MUS. More-over, this current study did not answer important question as to which measurement correlated with a better surgical outcome. However, the study population in this study of having an MUS is too small to answer that important question. Thus that question will have to be answered by further research.
In summary, we do not know which position more closely reflects urethral mobility in patients with SUI. The reclining position guaranteed the most mobile urethra, whereas the supine position provided a more mobile urethra than that of the standing position. We recommend an empty bladder or urine volume less than the volume when voiding is desired. According to a previous report and our result, the bladder filling status does not affect UH [5]. However, an empty bladder or a bladder with a small volume of urine was more com-fortable for the examinees.
Conclusion
The outcome of Q-tip angle measurement and the rate of UH appeared to increase when patients were exam-ined in the reclining position. However, this difference dissipated when the Q-tip angle was measured during the bladder filling state. The largest difference in Q-tip angle, indicating a positive UH, was observed in pa-tients in the reclining position during the bladder emptying state.
Abbreviations
UH:Urethral hypermobility; UI: Urinary incontinence; SUI: Stress urinary incontinence; UVJ: Urethrovesical junction; POP-Q: Pelvic organ prolapsed quantification; MUI: Mixed urinary incontinence; UUI: Urgency urinary incontinence; MUS: Mid-urethral sling; VLPP: Valsalva leak point pressure.
Competing interests
The authors declare that they have no competing interests.
Authors’contributions
JY participated in the study design, coordination, and data analysis, performed statistical analysis of the data, prepared figures and description of figures, and helped to draft the manuscript. JHK participated in the study design, and data interpretation, and critically revised the manuscript for important intellectual content. SP participated in data analyses, performed statistical analysis of the data, and provided a statistical description of the manuscript. CL conceptualized and planned the study, provided the clinical data, participated in the study design, coordination, and data interpretation, and wrote and revised the manuscript. All authors read and approved the final manuscript.
Acknowledgements
This study was supported by Soonchunhyang University Research Fund.
Author details
1Department of Urology, Soonchunhyang University Gumi Hospital,
Soonchunhyang University School of Medicine, Gumi, South Korea.
2Department of Urology, Soonchunhyang University Hospital,
Soonchunhyang University School of Medicine, Seoul, South Korea.
3Department of Biostatistics, Soonchunhyang University Hospital, Seoul,
South Korea.4Department of Urology, Soonchunhyang University Cheonan Hospital, Soonchunhyang University School of Medicine, 31 Soonchunhyang 6 gil, Dongnam-Gu, Cheonan, Chungcheongnam-do 330-721, South Korea.
Received: 28 May 2015 Accepted: 28 September 2015
References
1. Abrams P, Cardozo L, Fall M, Griffiths D, Rosier P, Ulmsten U, et al. The standardisation of terminology of lower urinary tract function: report from the Standardisation Sub-committee of the International Continence Society. Neurourol Urodyn. 2002;21(2):167–78.
2. Enhorning GE. A concept of urinary continence. Urol Int. 1976;31(1–2):3–5. 3. Kobashi KC. Evaluation of patients with urinary incontinence and pelvic
prolapse. In: WA J, Kavoussi LR, Novick AC, Partin AW, PC A, editors. Campbell-Walsh urology. 10th ed. Philadelphia: Saunders;
2012. p. 1896–908.
4. Crystle CD, Charme LS, Copeland WE. Q-tip test in stress urinary incontinence. Obstet Gynecol. 1971;38(2):313–5.
5. Karram MM, Bhatia NN. The Q-tip test: standardization of the technique and its interpretation in women with urinary incontinence. Obstet Gynecol. 1988;71(6 Pt 1):807–11.
6. Handa VL, Jensen JK, Ostergard DR. The effect of patient position on proximal urethral mobility. Obstet Gynecol. 1995;86(2):273–6.
7. Bergman A, McCarthy TA, Ballard CA, Yanai J. Role of the Q-tip test in evaluating stress urinary incontinence. J Reprod Med.
1987;32(4):273–5.
8. Walters MD, Diaz K. Q-tip test: a study of continent and incontinent women. Obstet Gynecol. 1987;70(2):208–11.
9. Staskin D, Kelleher C, Avery K, Bosch R, Cotterill N, Coyne K, et al. Initial Assessment of urinary and faecal incontinence in adult male and female patients. In: Abrams P, Cardozo L, Khoury S, Wein AJ, editors. Incontinence. 4th ed. Paris: Health publication Ltd; 2009.
10. Schafer W, Abrams P, Liao L, Mattiasson A, Pesce F, Spangberg A, et al. Good urodynamic practices: uroflowmetry, filling cystometry, and pressure-flow studies. Neurourol Urodyn. 2002;21(3):261–74.
11. Caputo RM, Benson JT. The Q-tip test and urethrovesical junction mobility. Obstet Gynecol. 1993;82(6):892–6.
12. Chen Y, Wen JG, Shen H, Lv YT, Wang Y, Wang QW, et al. Valsalva leak point pressure-associated Q-tip angle and simple female stress urinary
incontinence symptoms. Int Urol Nephrol. 2014;46(11):2103–8.