R E S E A R C H
Open Access
Cost-effectiveness of changes in alcohol taxation
in Denmark: a modelling study
Astrid Ledgaard Holm
1*, Lennert Veerman
2, Linda Cobiac
2, Ola Ekholm
3and Finn Diderichsen
1Abstract
Introduction:Excessive alcohol consumption is a public health problem in many countries including Denmark, where 6% of the burden of disease is due to alcohol consumption, according to the new estimates from the Global Burden of Disease 2010 study. Pricing policies, including tax increases, have been shown to effectively decrease the level of alcohol consumption.
Methods:We analysed the cost-effectiveness of three different scenarios of changed taxation of alcoholic beverages in Denmark (20% and 100% increase and 10% decrease). The lifetime health effects are estimated as the difference in disability-adjusted life years between a Danish population that continues to drink alcohol at current rates and an identical population that changes their alcohol consumption due to changes in taxation. Calculation of cost offsets related to treatment of alcohol-related diseases and injuries, was based on health care system costs from Danish national registers. Cost-effectiveness was evaluated by calculating cost-effectiveness ratios (CERs) compared to current practice.
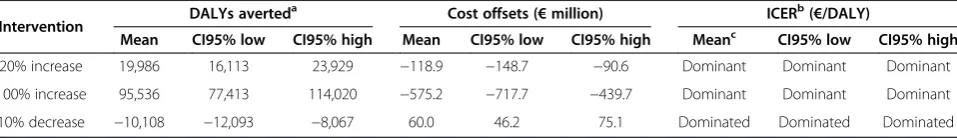
Results:The two scenarios of 20% and 100% increased taxation could avert 20,000 DALY and 95,500 DALY respectively, and yield cost savings of -€119 million and -€575 million, over the life time of the Danish population. Both scenarios are thus cost saving. The tax decrease scenario would lead to 10,100 added DALY and an added cost of€60 million. For all three interventions the health effects build up and reach their maximum around 15–20 years after implementation of the tax change.
Conclusion:Our results show that decreased taxation will lead to an increased burden of disease and related increases in health care costs, whereas both a doubling of the current level of alcohol taxation and a scenario where taxation is only increased by 20% can be cost-saving ways to reduce alcohol related morbidity and mortality. Our results support the growing evidence that population strategies are cost-effective and should be considered for policy making and prevention of alcohol abuse.
Keywords:Cost-effectiveness, Taxation, Alcohol, Public health, Health effects, Health care costs, Simulation modelling
Background
Excessive alcohol use is a cause of morbidity and mortality as it increases the risk of many diseases, including several types of cancer and cardiovascular diseases, as well as the risk of (intentional and unintentional) injuries [1-7]. Alcohol consumption is widespread in Denmark. In 2010 the average annual consumption among Danes over the age of 14 was 11.3 litres of pure alcohol [8] and 13% of men and 8% of women exceed the high risk threshold of maximum 14 standard drinksa per week for women and 21 standard drinks per week for men set out by the Danish Health and Medicines Authority [9]. As a
consequence, about 6% of the burden of disease in Denmark is due to alcohol consumption, according to the new estimates from the Global Burden of Disease 2010 study [10]. Economically, excess alcohol consumption has been estimated to cost society more than 1% of the gross national product in high- and middle-income countries [11]. A Danish analysis of the socio-economic conse-quences of alcohol consumption estimated the overall costs of alcohol consumption to be between €160 million using the friction cost method and €1.1 billion using the human capital method in 2005 [12]. Thus, there is a need for inter-ventions to prevent alcohol-related diseases and injuries.
In order to decrease the alcohol related burden of disease, different interventions can be implemented to lower the level of alcohol consumption in entire populations or in * Correspondence:[email protected]
1Department of Public Health, University of Copenhagen, Copenhagen, Denmark
Full list of author information is available at the end of the article
specific high risk groups. These include individually focussed programmes, such as education and persuasion or early intervention and treatment services; and legislative policies, which reduce the availability of alcohol, restrict marketing or increase the price of alcoholic beverages [13]. Previous re-search has found that increased taxation, which raises the price of alcohol, is a very effective way to decrease the bur-den of disease related to consumption of alcohol [14-18]. Further, economic studies have found that prevention of al-cohol related morbidity and mortality through increased taxation is very cost-effective [19-21]. Several legislative pre-ventive alcohol interventions, including increased taxation, were recently highlighted in a policy recommendation for increased public health in Denmark [22]. However, in Denmark decreases in alcohol taxation can be seen as a means to counter cross-border trade in Germany and keep sales within Denmark. A recent example of this was a 15% decrease of the taxation on beer effective from July 1st2013.
In this paper we estimate the cost-effectiveness of three different alcohol taxation scenarios - two levels of increased taxation and one of decreased taxation - using a dynamic model of the entire Danish population. In the analyses we take a Danish health sector perspective and make use of the unique Danish registers for information on disease incidence, mortality and costs for all indivi-duals in the Danish population.
Methods
To estimate the cost-effectiveness of changed alcohol ta-xation, we simulated the impact of changed taxation on population health over the lifetime of the adult Danish population (aged 16 years and older) in 2009. The health effects of taxation are estimated as the difference in dis-ability-adjusted life years (DALYs) [23] between a Danish population that continues to drink alcohol at current rates and an identical population that changes alcohol con-sumption due to tax increases or decreases. The health-adjusted years of life lived by each of the two populations are calculated by simulating the population in a multi-state life table until everyone has either died or reached 100 years of age. Years of life lived are adjusted at each age for time spent in poor health due to disease or injury.
The model simulated intervention effects on health outcomes associated with alcohol consumption, which included: ischaemic heart disease, ischaemic and hemor-rhagic stroke, hypertensive heart disease, pancreatitis, cirrhosis, alcohol dependence, and cancer of the breast (in women), mouth and oropharynx, oesophagus, liver, larynx, colon and rectum [1-6,24]. Further, excess con-sumption of alcohol increases the risk of a wide range of injury outcomes due to road traffic accidents (RTA) and other accidents (non-RTA) [7,25,26]. Non-RTA injuries associated with death or disability due to alcohol con-sumption included falls, fires, burns and scalds, drowning,
other accidents, suicide and self-inflicted injuries, and homicide and violence [27].
Each of the alcohol-related diseases is modelled by tran-sitions between four states (healthy, diseased, dead from the disease, and dead from all other causes), based on rates of mortality, incidence, case fatality and remission [28]. For injuries, which are acute in nature, changes due to alcohol interventions are modelled through direct changes in incidence of injury-related mortality and dis-ability. Data on incidence and mortality were taken from The Danish National Patient Register [29] and The Danish Register of Causes of Death [30], both of which cover the entire Danish population and can be linked for all indi-viduals. Case fatality (defined as the proportion of preva-lent cases that dies in a given year) was calculated using DISMOD II [28].
Average disability associated with each disease (disability weights) was derived from Australian Burden of Disease calculations [31], since such calculations were not available for Denmark. Adjustment for future changes in disease in-cidence and case fatality was based on trend analysis of Danish mortality and incidence rates by causeb.
Disease outcomes
For all outcomes except alcohol dependence and injuries the intervention effect on disease incidence was mo-delled by a modified version of the potential impact frac-tion, where the intervention effect changed the relative risk of disease rather than the population prevalence within alcohol consumption groups (Equation 1) [32,33].
PIF¼ Xn
i¼1
piRRi−
Xn
i¼1 piRR0i Xn
i¼1 piRRi
ð1Þ
where:
PIF is the potential impact fraction;
pi is the prevalence of alcohol consumption at expo-sure leveli;
RRiis the relative risk of disease associated with alcohol consumption at exposure leveli; and
RR'iis the relative risk of disease associated with alcohol consumption after an intervention is implemented in the population at exposure leveli.
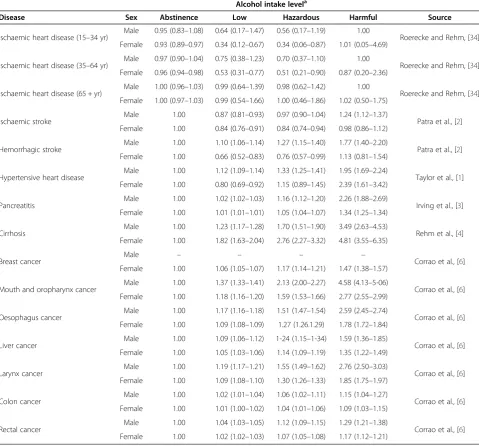
Estimates of relative risks were derived from existing meta-analyses (Table 1).
Alcohol dependence
reduction in the incidence of alcohol dependence that is proportional to the change in consumption at a harmful level of alcohol consumption (Equation 2).
j0¼j 1−ΔCHarm
CHarm
ð2Þ
where:
j'is the incidence of alcohol dependence after an inter-vention is implemented in the population;
j is the current incidence of alcohol dependence, ad-justed for level of dependence among harmful drinkers;
ΔcHarm is the average change in alcohol consumption in the population due to an intervention, in g/day, among those currently drinking at a harmful level;
cHarm is the average alcohol consumption, in g/day, among those currently drinking at a harmful level.
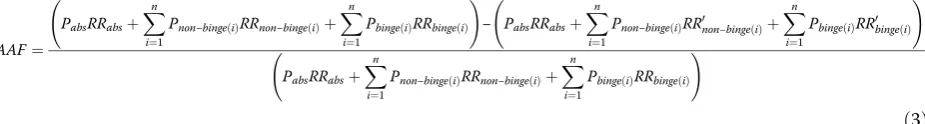
Injuries
The effects of alcohol interventions on injuries were measured by translating a change in alcohol consump-tion into a change in mortality and morbidity from in-juries, by calculating Alcohol-Attributable Fractions (AAF), an adaptation of the potential impact fraction
Table 1 Baseline relative risks of disease due to alcohol consumption
Alcohol intake levela
Disease Sex Abstinence Low Hazardous Harmful Source
Ischaemic heart disease (15–34 yr) Male 0.95 (0.83–1.08) 0.64 (0.17–1.47) 0.56 (0.17–1.19) 1.00 Roerecke and Rehm, [34] Female 0.93 (0.89–0.97) 0.34 (0.12–0.67) 0.34 (0.06–0.87) 1.01 (0.05–4.69)
Ischaemic heart disease (35–64 yr) Male 0.97 (0.90–1.04) 0.75 (0.38–1.23) 0.70 (0.37–1.10) 1.00 Roerecke and Rehm, [34] Female 0.96 (0.94–0.98) 0.53 (0.31–0.77) 0.51 (0.21–0.90) 0.87 (0.20–2.36)
Ischaemic heart disease (65 + yr) Male 1.00 (0.96–1.03) 0.99 (0.64–1.39) 0.98 (0.62–1.42) 1.00 Roerecke and Rehm, [34] Female 1.00 (0.97–1.03) 0.99 (0.54–1.66) 1.00 (0.46–1.86) 1.02 (0.50–1.75)
Ischaemic stroke Male 1.00 0.87 (0.81–0.93) 0.97 (0.90–1.04) 1.24 (1.12–1.37) Patra et al., [2]
Female 1.00 0.84 (0.76–0.91) 0.84 (0.74–0.94) 0.98 (0.86–1.12)
Hemorrhagic stroke Male 1.00 1.10 (1.06–1.14) 1.27 (1.15–1.40) 1.77 (1.40–2.20) Patra et al., [2]
Female 1.00 0.66 (0.52–0.83) 0.76 (0.57–0.99) 1.13 (0.81–1.54)
Hypertensive heart disease Male 1.00 1.12 (1.09–1.14) 1.33 (1.25–1.41) 1.95 (1.69–2.24) Taylor et al., [1] Female 1.00 0.80 (0.69–0.92) 1.15 (0.89–1.45) 2.39 (1.61–3.42)
Pancreatitis Male 1.00 1.02 (1.02–1.03) 1.16 (1.12–1.20) 2.26 (1.88–2.69) Irving et al., [3]
Female 1.00 1.01 (1.01–1.01) 1.05 (1.04–1.07) 1.34 (1.25–1.34)
Cirrhosis Male 1.00 1.23 (1.17–1.28) 1.70 (1.51–1.90) 3.49 (2.63–4.53) Rehm et al., [4]
Female 1.00 1.82 (1.63–2.04) 2.76 (2.27–3.32) 4.81 (3.55–6.35)
Breast cancer Male – – – – Corrao et al., [6]
Female 1.00 1.06 (1.05–1.07) 1.17 (1.14–1.21) 1.47 (1.38–1.57)
Mouth and oropharynx cancer Male 1.00 1.37 (1.33–1.41) 2.13 (2.00–2.27) 4.58 (4.13–5-06) Corrao et al., [6] Female 1.00 1.18 (1.16–1.20) 1.59 (1.53–1.66) 2.77 (2.55–2.99)
Oesophagus cancer Male 1.00 1.17 (1.16–1.18) 1.51 (1.47–1.54) 2.59 (2.45–2.74) Corrao et al., [6]
Female 1.00 1.09 (1.08–1.09) 1.27 (1.26.1.29) 1.78 (1.72–1.84)
Liver cancer Male 1.00 1.09 (1.06–1.12) 1-24 (1.15–1-34) 1.59 (1.36–1.85) Corrao et al., [6]
Female 1.00 1.05 (1.03–1.06) 1.14 (1.09–1.19) 1.35 (1.22–1.49)
Larynx cancer Male 1.00 1.19 (1.17–1.21) 1.55 (1.49–1.62) 2.76 (2.50–3.03) Corrao et al., [6]
Female 1.00 1.09 (1.08–1.10) 1.30 (1.26–1.33) 1.85 (1.75–1.97)
Colon cancer Male 1.00 1.02 (1.01–1.04) 1.06 (1.02–1.11) 1.15 (1.04–1.27) Corrao et al., [6]
Female 1.00 1.01 (1.00–1.02) 1.04 (1.01–1.06) 1.09 (1.03–1.15)
Rectal cancer Male 1.00 1.04 (1.03–1.05) 1.12 (1.09–1.15) 1.29 (1.21–1.38) Corrao et al., [6]
Female 1.00 1.02 (1.02–1.03) 1.07 (1.05–1.08) 1.17 (1.12–1.21)
Values are mean relative risk and 95% confidence interval at average alcohol consumption for each consumption category, calculated by Monte Carlo analysis with 3000 iterations.
a
(PIF), as outlined by Taylor et al. [25], and personal communication with Jürgen Rehm (Equation 3).
where:
Pabs and RRabs is the prevalence and relative risk for current abstainers.
Pbinge(i)and RRbinge(i)is the prevalence and relative risk for current drinkers who engage in binge drinking, for alcohol consumption at exposure leveli (low, hazardous or harmful). RR for current drinkers who engage in binge drinking is calculated based on average amount of alcohol consumed at each binge episode (this informa-tion was not available for Denmark, but based on [35]), time at risk in binge episodes (based on metabolism rates) and average consumption level when not engaging in binge drinking [25].
Pnon-binge(i)and RRnon-binge(i)is the prevalence and rela-tive risk for current drinkers who do not engage in binge drinking, for alcohol consumption at exposure leveli.
RR'binge(i)/non-binge(i)is the relative risk of injury associ-ated with alcohol consumption at exposure level i after an intervention is implemented, for current drinkers who do/do not engage in binge drinking at exposure leveli. The intervention scenarios analysed are not spe-cifically targeted binge drinking, therefore we do not as-sume a special effect on binge drinking.
Intervention scenarios
To evaluate the potential effects of changes in alcohol taxation we analysed three different intervention scenar-ios and compared these with the current Danish taxation scenario (in the baseline year 2009). Input data for each scenario and model assumptions are shown in Table 2.
AAF¼
PabsRRabsþ
Xn
i¼1
Pnon−binge ið ÞRRnon−binge ið Þþ
Xn
i¼1
Pbinge ið ÞRRbinge ið Þ !
− PabsRRabsþ
Xn
i¼1
Pnon−binge ið ÞRR0non−binge ið Þþ
Xn
i¼1
Pbinge ið ÞRR0binge ið Þ !
PabsRRabsþ
Xn
i¼1
Pnon−binge ið ÞRRnon−binge ið Þþ
Xn
i¼1
Pbinge ið ÞRRbinge ið Þ !
ð3Þ
Table 2 Input data and model assumptions
Change in taxation 20% increase 100% increase 10% decrease Source
Intervention effect (mean (SD)) [Distribution]
−1.4% (0.1) −6.9% (0.7) 0.7% (0.1) National Danish prevention taskforce [22]. Based on estimates from the ministry of taxation
[Normal] [Normal] [Normal]
Tax level after tax change (Price per litre pure alcohol)
Beer:€8.2 Beer:€13.6 Beer:€6.1
National Danish prevention Taskforce [22]. Based on estimates from the Ministry of Taxation
Wine:€8.1 Wine:€13.4 Wine:€6.0
Spirits:€24.1 Spirits:€40.2 Spirits:€18.1
Target population Current Danish population
-Proportion of population 100% of non-abstainers
-Price elasticity Beer: -0.2, wine: -0.25, spirits: -0.3 National Danish prevention taskforce [on estimates from the ministry of taxation22]. Based
Time horizon 100 years
-Effect decay rate 2% Reflecting the rate of inflation; statistics
Denmark [36]
Discount rate (costs and effects) 3%
-Intervention costs [Distribution] None National Danish prevention taskforce [22]
[None]
Cost offsets [Distribution] Calculated based on Danish cost data See‘Methods’for details on calculation
methods [Normal]
Estimates of Relative risk [Distribution] See Table1
Current taxation scenario
In Denmark alcohol taxes vary according to beverage type, with heavier taxation on spirits than wine and beer. In 2009 the tax on beer, wine and spirits was€6.8,€6.7 and €20.1 respectively per litre of pure alcohol, or€0.1 per 33 cl bottle or can of beer, €0.6 per 75 cl bottle of wine and €5.6 per 70 cl bottle of spirits. Actual prices are highly dependent on the specific brand, outlet etc., but approximate (low-end) prices for a 33 cl bottle or can of beer, a 75 cl bottle of wine and a 70 cl bottle of spirits are€0.5-€1.2,€5-€13 and€11-€16 respectively.
20% increased taxation scenario
In the first scenario we modelled the cost-effectiveness of a 20% increase in alcohol taxation on beer, wine and spirits. This corresponds to a tax increase of €0.02 per 33 cl bottle or can of beer,€0.12 per 75 cl bottle of wine and€1.12 per 70 cl bottle of spirits.
100% increased taxation
Here we estimate the health effects and costs of a sce-nario where the tax levels are doubled compared to the current level of alcohol taxation. This percentage change in taxation would apply to beer, wine and spirits, raising the tax by €0.1 per 33 cl bottle or can of beer, €0.6 per 75 cl bottle of wine and€5.6 per 70 cl bottle of spirits.
10% decreased taxation
Finally we estimate the effects of a 10% decrease in alco-hol taxation compared to the current level of taxation, decreasing the tax by €0.01 per 33 cl bottle or can of beer,€0.06 per 75 cl bottle of wine and€0.56 per 70 cl bottle of spirits.
In all intervention scenarios it was assumed that the full price change due to changed taxation was passed on from producers to consumers. Taxation is a population wide intervention, assumed to affect the entire adult population of 16 years or older (except abstainers). The effect of taxation on alcohol consumption was measured as relative change in grams of alcohol consumed per day, which was added to the baseline average consump-tion for each consumpconsump-tion group. For the two tax in-crease scenarios these estimates of effect were taken from the work done by a National Danish Prevention Taskforce, commissioned to examine and recommend preventive health interventions to be implemented in Denmark [22], and personal communication with Jürgen Rehm. For the tax decrease scenario estimates of effect were based on calculations done by The Danish Ministry of Taxation [37]. Change in alcohol consumption due to changed alcohol taxation was estimated based on price elasticity estimated by The Danish Ministry of Taxation (−0.2 for beer, -0.25 for wine, -0.3 for spirits). In our
model we assume a rate of 2% for intervention effect, representing the rate of inflation [36] (Table 2).
Current alcohol consumption
Data collected in The Danish Health and Morbidity Sur-vey 2010 (the national sample in the Danish National Health Survey) were used to determine the current con-sumption of alcohol [38]. Alcohol concon-sumption was di-vided into four levels based on the Danish Health and Medicines Authority recommendations for alcohol con-sumption [39], recalculated into grams per day: Abstin-ence (<1.7 g/day), low (1.7-11.9 g/day for women and 1.7-23.9 g/day for men), hazardous (12–23.9 g/day for women and 24–35.9 g/day for men) and harmful (>24 g/day for women and >36 g/day for men). Age-specific distributions on consumption levels and average alcohol consumption at each level were calculated. Population distribution on consumption levels are shown in Figure 1. Calculation of injury outcomes (Equation 3) required an estimate of drinking pattern, which was based on fre-quency of binge drinking (defined as more than five standard drinks in one occasion) from the Danish Health and Morbidity Survey 2010.
Studies have shown that population surveys tend to underestimate alcohol consumption [40,41]. We therefore adjusted for underreporting, using the coverage rate be-tween survey data and adult per capita alcohol consump-tion from sales statistics (as described by Rehm et al. [42]). To avoid over-adjustment, we assumed that 10% of adult per capita consumption estimated from sales statistics was not consumed (as suggested by Taylor et al. [25]).
Health effects and net costs
Net costs of each intervention were calculated as the sum of intervention costs and costs of prevented health care utilisation (cost offsets) related to treatment of
0% 10% 20% 30% 40% 50% 60%
Abstinent Low Hazardous Harmful
Prevalence
Males
Females
alcohol-related diseases and injuries. Costs were estimated from a Danish health sector perspective. Intervention costs included government and local government costs as-sociated with deliverance and enforcement of interven-tions and costs of materials, but excluded costs associated with lost productivity, time costs for patients due to par-ticipation in interventions or costs to others (e.g. family). Costs associated with research and development was also excluded.
Cost offsets were evaluated using data on costs of treatment in the health care system, including inpatient and out-patient costs (from the Diagnosis Related Grouping (DRG) Register [43]), data on costs related to consultations with general practitioners and specialists (from the Danish National Health Service Register [44]), data on costs of pharmaceuticals (from the Danish Na-tional Prescription Register [45]) and data on municipal health care costs, such as nursing homes, home nursing, rehabilitation etc. Municipal health care costs are not re-ported consistently across municipalities in Denmark, and we therefore assessed costs in the municipality of Copenhagenc(based on data from the Health and Care Administration of the City of Copenhagen[personal communication], linked to register data on health out-comes via Statistics Denmark). Cost offsets excluded costs to the individual or caregivers, costs due to lost productivity or costs associated with alcohol-related crime and violence. In the absence of a Danish cost of illness study, cost offsets were quantified for each of the included health outcomes by comparing health care costs for people with the disease and health care costs for people without the disease. Multiple regression ana-lyses were used, mutually controlling for all included health outcomes and for other diseases not associated with alcohol consumption. Average health care costs due to diseases not associated with alcohol consumption were included in the analysis in order to account for costs in added years of life. Costs were derived by sex and age (<49, 50–69, 70+ years), based on rates of dis-ease in 2009.
Cost-effectiveness analyses
Costs and effects of the three intervention scenarios were plotted on the cost-effectiveness plane to illustrate cost-effectiveness. Cost-effectiveness ratios (CERs) were calculated as the ratio of means [46] and compared to the current taxation scenario. All costs and effects were evaluated for the Danish population with a lifetime per-spective, and a discount rate of 3% per annum was used for both costs and health outcomes. Probabilities of the interventions being cost-effective or cost saving were modelled using cost-effectiveness acceptability curves. We used WHO’s thresholds of less than GDP per capita GDP per capita for highly cost-effective and between
one and three times GDP per capita for cost-effective, since there is no agreed threshold of cost-effectiveness in Denmark (GDP Denmark, 2009:€39,900 [47]).
The statistical software SAS (version 9.2) was used for analyses of epidemiological data inputs and cost data. The cost-effectiveness analyses were performed in Excel (Microsoft Office 2007), applying the add-in programme Ersatz (version 1.31, Epigear 2012) for uncertainty analyses.
Uncertainty and sensitivity analyses
We used Monte Carlo simulation for uncertainty ana-lyses in the cost-effectiveness model. We assessed the possible effects of uncertainty in estimates of relative risk, effects, costs and coverage rates of the intervention and cost offsets.
In sensitivity analyses we tested the effect of three main assumptions made in the modelling. The price elasticity estimates used in the main analysis are calcu-lated by The Danish Ministry of Taxation [22]. To test the effects of this choice of price elasticity we did a sen-sitivity analysis where estimates of price elasticity are based on a meta analysis by Gallet [48]. The price elasti-cities used in this analysis are −0.35, -0.7 and −0.7 for beer, wine and spirits respectively.
In our main analysis we assumed changes in alcohol taxation to be cost-neutral in terms of intervention costs [22]. In a sensitivity analysis we tested the implications of this assumption, by calculating the cost-effectiveness of the three taxation interventions assuming that chan-ged taxation would involve a yearly cost of €375,000, plus a cost of €270,000 the first year. This is the esti-mated cost of law enforcement activities plus start up expenses and added information the first year, applied to other legislative interventions such as changes in hours of retail sale or legal drinking age [22].
The proportion of a tax increase that is passed on to consumers may be less than, equal to, or greater than the full change in taxation. In the main analysis we as-sumed a tax pass-through rate of one, indicating that the full tax increase is passed on to consumers. In the third sensitivity analysis we tested the implications of this tax pass-through rate by applying two alternative rates of tax pass-through based on the studies by Young and Bielinska–Kwapisz (average pass-through rate of 1.66) and Kenkel (average pass-through rate of 2.57) [49,50].
Results
respectively, and for the tax decrease scenario a negative cost offset of -€60 million. The cost-effectiveness ratios are dominant for both scenarios of increased taxation, in-dicating that the interventions are cost saving and health promoting, whereas the cost-effectiveness ratio for the de-creased taxation scenario is dominated. Table 3 shows dif-ferences in health gains, costs and cost-effectiveness ratios for the three scenarios.
The two scenarios with increased taxation are posi-tioned in the south-east quadrant of the cost-effectiveness plane, indicating that these interventions are cost saving (Figure 2). Opposite, the taxation decrease scenario is po-sitioned in the north-west quadrant, indicating that this level of taxation is less effective and more costly than current practice.
The health effects of changed alcohol tax over the mod-elled timeframe are illustrated in Figure 3. For the two sce-narios with increased taxation, the lower consumption of alcohol reduces the incidence of alcohol-related diseases and the number of disability adjusted life years experi-enced by the population compared to current practice. For the scenario with decreased taxation the opposite ef-fect can be observed, with an increase in disability ad-justed life years. The health effects of taxation build up and are largest around 15–20 years after the change in taxation. As the simulated cohorts gradually age and dwindle in numbers, the health effects diminish.
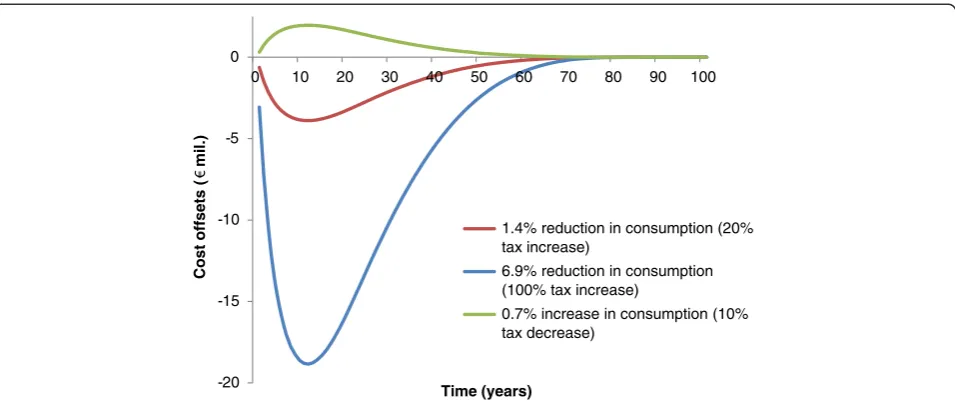
For the decreased taxation scenarios the reduced inci-dence of alcohol related diseases leads to lower health care costs associated with these diseases. As illustrated in Figure 4, these savings are reduced over time due to increased costs associated with people living longer, but also due to discounting of future costs (Table 2). For the tax increase scenario we see the opposite, with increased health care costs, which are also reduced over time.
Sensitivity analyses
Applying alternative, and higher, estimates of price elas-ticity resulted in larger health effects of all three scenar-ios. In this analysis the 20% tax increase could avert 44,000 DALY in a 100 year modelling frame and 200,000 DALY could be averted with a doubling of the current level of taxation. With the alternative estimates of price elasticity, a 10% reduction of alcohol taxation could
increase the burden of disease by 23,000 DALY with (Table 4).
The results of assuming an intervention cost for the taxation interventions similar to the estimated cost of other legislative alcohol interventions in Denmark are also shown in Table 4. It can be seen that for all three intervention scenarios, cost-effectiveness is only affected marginally by the change in intervention cost.
The two alternative estimates of pass-through rate of taxation increase the absolute effect off the interventions considerably (Table 4). The pass-through rate found by Kenkel was the higher of the two and thus resulted in the largest effect on both costs and effects.
Discussion
We modelled the potential health effects and associated costs of two different scenarios of increased alcohol tax-ation and one scenario of decreased alcohol taxtax-ation in Denmark. Our model was based on epidemiological evi-dence and Danish register data of high quality. However, the intervention scenarios analysed are modelled
scenar-ios; not observed policy changes. We found that both scenarios with increased tax were cost-saving. This is in line with previous research, which has found increased taxation to be a cost-effective or cost-saving way of pre-venting alcohol related diseases and injuries [19-21]. From a health sector perspective we found that the sce-nario of decreased taxation is a less effective and more costly alternative to current practice.
Due to price differences compared to our neighbour-ing countries, cross-border trade is relatively common in Denmark, with Danes buying alcohol and other goods in Germany and Swedes purchasing goods in Denmark. A way to counter the cross-border trade with Germany and increase sales in Denmark could be to decrease tax-ation of alcohol. Based on revenue calcultax-ations it has been argued that tax decreases could be cost saving, however, these calculations most often do not include health care costs or other broader cost to society [51].
A few studies have examined the effects of a decrease in the taxation on spirits by 45% in 2003 on alcohol con-sumption. Two studies reach divergent results: Based on panel data, both studies found that consumption of spirits decreased by 7-8% in the year following the
Table 3 Cost-effectiveness of alcohol taxation interventions for the Danish population aged 16+ (population in 2009: 4.5 million)
Intervention DALYs averted
a Cost offsets (
€million) ICERb(
€/DALY)
Mean CI95% low CI95% high Mean CI95% low CI95% high Meanc CI95% low CI95% high
20% increase 19,986 16,113 23,929 −118.9 −148.7 −90.6 Dominant Dominant Dominant
100% increase 95,536 77,413 114,020 −575.2 −717.7 −439.7 Dominant Dominant Dominant
10% decrease −10,108 −12,093 −8,067 60.0 46.2 75.1 Dominated Dominated Dominated
a
decrease in taxation, however, based on repeated cross sectional data a 6-11% increase in total consumption was found [52,53]. In our study we assumed that a 10% tax decrease would result in a 0.7% increase in con-sumption, applied to cross sectional consumption data. This estimate of change is cautious compared to the es-timates found for cross sectional data in the two studies. Unfortunately our estimates of cost-effectiveness cannot be compared to the consequences of the decrease in spirits tax, since the long term health effects have not yet been studied. Unlike the scenarios analysed in our study,
this policy affected the taxation of spirits only, and substi-tution between types of alcohol might have occurred.
We only modelled the health effects in a population aged 16 years and older, but chances in alcohol taxation might also affect the younger population. Another study of the effects of the tax decrease on spirits in Denmark in 2003 found that the number of hospitalizations due to acute alcohol intoxication increased by 26% among people aged 15 years or younger [54].
Other studies have modelled the cost-effectiveness of potential changes in alcohol taxation, most with a focus -800
-700 -600 -500 -400 -300 -200 -100 0 100
-15 -5 5 15 25 35 45 55 65 75 85 95 105 115
N
e
t c
o
sts (m
illio
n
)
DALY Averted (1000) 1.4% reduction in consumption (20% tax increase)
6.9% reduction in consumption (100% tax increase) 0.7% increase in consumption
(10% tax decrease)
Figure 2Cost-effectiveness of alcohol taxation scenarios.
-300 200 700 1200 1700 2200 2700
0 10 20 30 40 50 60 70 80 90 100
DALY
Time (years)
1.4% reduction in consumption (20% tax increase)
6.9% reduction in consumption (100% tax increase)
0.7% increase in consumption (10% tax decrease)
on tax increases. Due to differences in modelled scenarios, modelling approaches and characteristics of the popula-tions modelled, it is difficult to make direct comparisons between our results and the findings from other studies. However, subject to these differences, our estimates of po-tential health effects are lower than found by Chisholm et al., Purshouse et al. and van den Berg et al. [14,19,21], but higher than found by Cobiac et al. and Lhachimi et al. [18,20], as illustrated in Table 5. Generally we find larger potential cost offsets compared to these other studies.
Some of these differences in estimates of health effects might be due to differences in alcohol consumption and
baseline epidemiology and demography of the popula-tions studied. Denmark has a larger baseline burden of disease from alcohol-related diseases than many other-wise comparable countries [10]. Thus there is a large po-tential for health prevention through decreased alcohol consumption. However, compared to some studies we find smaller health effects. The estimation of potential health effects are influenced by a range of factors in the modelling, including estimates of price elasticity. The price elasticity estimates used in our study are calculated by The Danish Ministry of Taxation [22]. These esti-mates are lower than the estiesti-mates used in other studies -20
-15 -10 -5 0
0 10 20 30 40 50 60 70 80 90 100
Cost offsets
(
mi
l.
)
Time (years)
1.4% reduction in consumption (20% tax increase)
6.9% reduction in consumption (100% tax increase)
0.7% increase in consumption (10% tax decrease)
Figure 4Cost offsets due to alcohol taxation over the modelled timeframe for the Danish population aged 16+ in 2009 (population 4,5 million).
Table 4 Sensitivity analyses: cost-effectiveness of alcohol taxation under alternative assumptions (for the Danish population aged 16+ in 2009, population: 4.5 million)
Intervention DALYs averted
a
Cost offsets (€million) ICERb(€/DALY)
Mean CI95% low CI95% high Mean CI95% low CI95% high Meanc CI95% low CI95% high
Price elasticityd
20% increase 43,873 35,130 52,556 −263 −332 −201 Dominant Dominant Dominant
100% increase 204,291 167,407 243,095 −1,246 −1,584 −973 Dominant Dominant Dominant
10% decrease −23,209 −27,760 −18,645 137 107 173 Dominated Dominated Dominated
Intervention coste
20% increase 19,995 16,080 24,007 −119 −148 −92 Dominant Dominant Dominant
100% increase 95,639 76,949 113,174 −575 −718 −440 Dominant Dominant Dominant
10% decrease −10,085 −12,107 −8,077 60 46 75 Dominated Dominated Dominated
Taxation pass-through rate of 1.66f
20% increase 33,282 26,760 40,024 −197 −247 −152 Dominant Dominant Dominant
100% increase 157,148 129,415 186,267 −944 −1,182 −733 Dominant Dominant Dominant
10% decrease −17,010 −20,368 −13,793 100 77 126 Dominated Dominated Dominated
Taxation pass-through rate of 2.57f
20% increase 50,580 40,628 60,523 −301 −379 −229 Dominant Dominant Dominant
100% increase 239,017 191,170 291,742 −1,518 −2,194 −1,104 Dominant Dominant Dominant
10% decrease −26,348 −31,770 −21,220 154 119 194 Dominated Dominated Dominated
a
DALY = disability-adjusted life year.bICER = incremental cost-effectiveness ratio.cCalculated as‘ratio of means’[46].dIn the first sensitivity analysis the effects of higher price elasticities of−0.35, -0.7 and−0.7 respectively for beer, wine and spirits are tested.e
In the second sensitivity analysis the effects of assuming the same intervention cost for taxation as for other legislative interventions (yearly cost of€375,000 plus€270,000 the first year) are tested.f
of effect and cost-effectiveness of alcohol taxation [14,18,19,21]. We used these estimates, since they are based on a Danish context. Further, since the level of al-cohol taxation is already higher in Denmark compared to many other European countries [18], a tax increase in Denmark could have lower effects, due to increased in-centives for cross-border trade. This effect has been taken into account in the lower estimates of price elasti-city. In our sensitivity analyses we tested the implications of applying higher price elasticities. The results of this analysis are closer to the effects found in other studies which used higher price elasticity estimates [18,19].
Variations in included and excluded health care costs affect intervention cost-effectiveness, and can explain some of the differences between our estimates of cost-effectiveness and those found in other studies. Further, in our study the tax interventions are assumed to be cost-neutral in terms of intervention costs (Table 2). Our esti-mates of intervention costs are based on the work done a National Danish Prevention Taskforce, appointed to exa-mine and recommend preventive health interventions to be implemented in Denmark [22]. For increased taxation The Danish Ministry of Taxation estimated that current costs would not change with an increased taxation level. This is not in accordance with WHO’s generalised cost-effectiveness approach where interventions are compared to a null scenario [55]. The results of our sensitivity analysis show that even if taxation was assumed to have costs com-parable to those of other legislative interventions, the two scenarios with decreased taxation would still be cost-saving.
We did not include changes in Government revenue in our cost estimates. From a societal perspective it has been argued, that tax revenues should not be included in cost-effectiveness analyses, since they are transfer payments [19,21]. Further, comparable estimates of revenue change were not available for all three taxation scenarios.
In the analysis of health effects over time, we found that the largest health effects were 15–20 years of inter-vention. This is about 10 years earlier than found by van den Berg and colleagues [19]. This difference is partly at-tributable to the effect of discounting, where we in our study use a 3% discount rate for effects, compared to the discount rate of 1.5% applied by van den Berg et al., but also attributable differences in the baseline population.
Based on the calculations performed by the Danish Ministry of Taxation, we assumed that increased tax on alcohol will translate fully into increased prices of alco-holic beverages. Only few studies have examined supply-side responses to alcohol pricing policies, which could include market restructuring or increased discounts [56,57]. Kenkel [49] and Young and Bielinska–Kwapisz [50] have analysed alcohol tax pass-through rates in USA, and both found that prices increased by more than the actual tax increase [49,50]. Kenkel found that sales outlets with a higher baseline price passed less of the tax increase on to consumers [49]. This supports the rather cautious pass-on rate of one assumed in our study, since baseline prices are rather high in Denmark. In the sensi-tivity analyses we applied the higher pass-through rates found by Kenkel and Young and Bielinska–Kwapisz, which enhanced the impact of the analysed tax changes considerably. The assumption regarding taxation pass-through rate thus have implications for our results, and the effect of alcohol taxation on alcohol consumption might therefore be greater than found in our study.
For information on morbidity, mortality and costs we used linked data from national Danish registers. This allowed us to base our analysis on information for the entire Danish population. Alcohol consumption data is based on data from a representative national Danish health survey [38]. We adjusted these data for under-reporting, using the coverage rate between survey data Table 5 Overview of findings in other studies of increased taxation
Study Taxation change Study population
and time frame
Effect Intervention
cost
Cost offsets
CER
Cobiac et al. [20] Volumetric tax Australia 100 years 11,000 DALY AU$0.58 million -AU$57 Dominant
Chisholm et al. [21] 25% increase Western Europe 10 years (costs and effects p.a.)
1,500 DALY per 1 million population
I$0.45 million per 1
million population - 289 I$/DALY
Van den Berg et al. [19]
34% increase for beer Netherlands 13,000 QALY None €65 million 5100
€/QALY
225-300% increase* 100 years 625,000 QALY €3300
million
5300 €/QALY
Lhachimi et al. [18]
20% tax increase European Union 19,100 deaths prevented
(400 in Denmark)
-** -** -**
80% tax increase 10 years 107,800 deaths prevented
(2300 in Denmark)
Purshouse et al. [14] 10% general price
increase England 10 years 55,000 QALY
-** -** -**
CER = Cost-effectiveness ratio; AU$ = Australian dollar; p.a. = per annum; I$ = International dollar. *
Differentiated increase for beverage types. **
and sales statistics. This approach presumes that under-coverage by surveys is evenly distributed in the popula-tion, which might not be the case. However, no clear evi-dence exists on differential underreporting of alcohol consumption by different survey subpopulations [42]. In our analyses we included average daily alcohol consump-tion and–for the injury calculations only–an estimate of binge drinking. Due to limitations in the available data, we were not able to properly include effects of drinking pat-terns. Differences have been found in the effect of alcohol intake among regular drinkers and irregular drinkers [58], and this aspect should thus be investigated further in fu-ture studies.
In our modelling approach we did not include time lag effects of the temporal relationship between alcohol con-sumption and incidence of health outcomes. Only few studies have examined this aspect, but a recent review propose that there are immediate effects of changes in alcohol consumption on both mortality and morbidity of many health outcomes, except cancers, and that full ef-fects are obtained after 10 to 20 years [59]. This is in line with our results, where we found that the health effects built up and were largest around 15–20 years after a change in alcohol taxation (Figure 3).
Danish population registers, covering all individuals in the Danish population, were used for information on disease incidence, mortality and costs. In The Danish National Patient Register diseases are registered accor-ding to ICD-10 codes, whereas registration of injuries is based on the Nordic Classification of External Causes to Injuries [43]. A weakness in this approach is, that long term disability due to injuries are not linked to injury in-cidence, and we were thus unable to include these in our cost estimates. A Danish study has found that, de-pending on diagnosis, the use of health care services was higher among people with serious injuries up to nine years after the injury [60]. This indicates that our cost estimates for injuries might be underestimated.
The disability adjusted life year (DALY) was used as the measure of effect, a measure which has been widely dis-cussed [61,62]. We did not use age weighting, but both ef-fects and costs were discounted by 3%. As argued by Chisholm et al. [63], the main limiting factor related to the use of DALY in cost-effectiveness studies is the in-ability to include non-health effects or effects on others than the person at risk. An exception being victims of al-cohol related accidents and crimes, but the societal potential of the interventions could still be larger than our estimates.
Public policy making should to be informed by evi-dence; however when evidence from evaluations of pre-vious interventions is not available, results from modelling studies can help guide discussion and decision making by presenting possible outcomes and effects, and the probability and consequences of these. In Denmark
there is little history of modelling studies within public health and our study adds new perspectives to discus-sions regarding the possible effects of changes in alcohol taxation, a frequently debated topic.
Conclusion
Alcohol is one of the leading risk factors in many indus-trialized countries, and in Denmark 6% of the total bur-den of disease is attributable to alcohol consumption. We found that, from a health sector perspective, de-creased alcohol taxation, as has been suggested in Denmark, will raise both the burden of disease and health care costs. On the other hand, our study shows that increased taxation of alcohol can be a cost-saving way to reduce alcohol related morbidity and mortality. This applies to both a scenario where the current level of taxation is doubled, but also to a less radical scenario where alcohol taxation is increased by 20%.
Endnotes a
A Danish standard drink is equivalent to 12 grams pure alcohol [39].
b
Mortality trends are based on mortality between 1977 and 2009 for cardiovascular diseases and breast cancer, and between 1994 and 2009 for other cancers and cirrhosis, due to lack of available comparable data [64]. Incidence trends are based on data from 1977 to 2009, but only available for cancers [64]. For pancreatitis and alcohol dependence we assumed stable rates over time.
c
The Municipality of Copenhagen, the capital of Denmark, is the largest municipality in the country, with 10% of the Danish population.
Competing interests
The authors declare that we have no competing interests.
Authors’contributions
ALH was the main contributor to data analysis and writing of the paper. LV and LC contributed significantly to the design of the study, data analysis and writing of the paper. OE supplied parts of the data material and contributed with revisions of manuscript drafts. FD contributed to the design of the study and drafting of the article. All authors approved the final version of the manuscript.
Acknowledgements
We would like to thank Jan Barendregt for assistance with Ersatz analyses; Theo Vos for sharing information on burden of disease estimates for Denmark; Jürgen Rehm and colleagues for specifications on equations for the relationship between alcohol consumption and health outcomes; and the Health and Care Administration of the City of Copenhagen for providing data on municipal health care costs.
This research is part of a PhD-project jointly funded by the Danish Ministry of Science, Innovation and Higher Education and the City of Copenhagen.
Author details 1
Received: 29 August 2013 Accepted: 2 January 2014 Published: 9 January 2014
References
1. Taylor B, Irving HM, Baliunas D, Roerecke M, Patra J, Mohapatra S,et al: Alcohol and hypertension: gender differences in dose–response relationships determined through systematic review and meta-analysis. Addiction2009,104:1981–1990.
2. Patra J, Taylor B, Irving H, Roerecke M, Baliunas D, Mohapatra S,et al: Alcohol consumption and the risk of morbidity and mortality for different stroke types–a systematic review and meta-analysis.BMC Public Health2010,10:258.
3. Irving HM, Samokhvalov AV, Rehm J:Alcohol as a risk factor for pancreatitis. A systematic review and meta-analysis.JOP2009,10:387–392.
4. Rehm J, Taylor B, Mohapatra S, Irving H, Baliunas D, Patra J,et al:Alcohol as a risk factor for liver cirrhosis: a systematic review and meta-analysis. Drug Alcohol Rev2010,29:437–445.
5. Baan R, Straif K, Grosse Y, Secretan B, El Ghissassi F, Bouvard V,et al: Carcinogenicity of alcoholic beverages.Lancet Oncol2007,8:292–293. 6. Corrao G, Bagnardi V, Zambon A, La Vecchia C:A meta-analysis of alcohol
consumption and the risk of 15 diseases.Prev Med2004,38:613–619. 7. Taylor B, Irving HM, Kanteres F, Room R, Borges G, Cherpitel C,et al:The more
you drink, the harder you fall: a systematic review and meta-analysis of how acute alcohol consumption and injury or collision risk increase together.Drug Alcohol Depend2010,110:108–116.
8. Statistics Denmark. ALKO2:Consumption and Sales of Alcohol and Tobacco, Subject to Excises Duties, by Type.http://www.statistikbanken.dk/statbank5a/ default.asp?w=1366. 15-10-2012. Ref Type: Online Source.
9. Danish Health and Medicines Authority:Den Nationale Sundhedsprofil 2010 -Hvordan har du det? [The National Health Profile 2010 - How are you doing?]. Copenhagen; 2011. Ref Type: Report.
10. World Health Organization:Global Burden of Disease Country Profiles. Institute for Health Metrics and Evaluation, University of Washington; 2013. http://www.healthmetricsandevaluation.org/gbd/country-profiles. Ref Type: Online Source.
11. Rehm J, Mathers C, Popova S, Thavorncharoensap M, Teerawattananon Y, Patra J:Global burden of disease and injury and economic cost attributable to alcohol use and alcohol-use disorders.Lancet2009, 373:2223–2233.
12. Juel K, Sorensen J, Bronnum-Hansen H:Risk factors and public health in Denmark.Scand J Public Health2008,36(Suppl 1):11–227.
13. Anderson P, Chisholm D, Fuhr DC:Effectiveness and cost-effectiveness of policies and programmes to reduce the harm caused by alcohol.Lancet 2009,373:2234–2246.
14. Purshouse RC, Meier PS, Brennan A, Taylor KB, Rafia R:Estimated effect of alcohol pricing policies on health and health economic outcomes in England: an epidemiological model.Lancet2010,375:1355–1364. 15. Elder RW, Lawrence B, Ferguson A, Naimi TS, Brewer RD, Chattopadhyay SK,
et al:The effectiveness of tax policy interventions for reducing excessive alcohol consumption and related harms.Am J Prev Med2010,38:217–229. 16. Wagenaar AC, Tobler AL, Komro KA:Effects of alcohol tax and price
policies on morbidity and mortality: a systematic review.Am J Public Health2010,100:2270–2278.
17. Wagenaar AC, Salois MJ, Komro KA:Effects of beverage alcohol price and tax levels on drinking: a meta-analysis of 1003 estimates from 112 studies. Addiction2009,104:179–190.
18. Lhachimi SK, Cole KJ, Nusselder WJ, Smit HA, Baili P, Bennett K,et al:Health impacts of increasing alcohol prices in the European Union: a dynamic projection.Prev Med2012,55:237–243.
19. van den Berg M, van Baal P, Tariq L, Schuit A, de Wit G, Hoogenveen R: The cost-effectiveness of increasing alcohol taxes: a modelling study. BMC Med2008,6:36.
20. Cobiac L, Vos T, Doran C, Wallace A:Cost-effectiveness of interventions to prevent alcohol-related disease and injury in Australia.Addiction2009, 104:1646–1655.
21. Chisholm D, Rehm J, Van OM, Monteiro M:Reducing the global burden of hazardous alcohol use: a comparative cost-effectiveness analysis.J Stud Alcohol2004,65:782–793.
22. Forebyggelseskommisionen:Vi kan leve længere og sundere - Forebyggelses-kommisionens anbefalinger til en styrket forebyggende indsats [We can live longer and healthier - The Prevention Commission’s recommendations for
strengthened prevention].Copenhagen: Ministeriet for forebyggelse og sundhed [Ministry of Health]; 2009. Ref Type: Report.
23. WHO:Metrics: Disability-Adjusted Life Year (DALY).who.int/healthinfo/global_ burden_disease/metrics_daly/en/index.html. 2009. Ref Type: Online Source. 24. Roerecke M, Rehm J:The cardioprotective association of average alcohol
consumption and ischaemic heart disease: a systematic review and meta-analysis.Addiction2012,107:1246–1260.
25. Taylor B, Shield K, Rehm J:Combining best evidence: a novel method to calculate the alcohol-attributable fraction and its variance for injury mor-tality.BMC Public Health2011,11:265.
26. Rehm J, Room R, Taylor B:Method for moderation: measuring lifetime risk of alcohol-attributable mortality as a basis for drinking guidelines.Int J Methods Psychiatr Res2008,17:141–151.
27. Møller H, Damm M, Laursen B:Ulykker i Danmark [Injuries in Denmark]. Copenhagen: National Institute of Public Health, University of Southern Denmark; 2012. Ref Type: Report.
28. Barendregt JJ, Van Oortmarssen GJ, Vos T, Murray CJ:A generic model for the assessment of disease epidemiology: the computational basis of DisMod II.Popul Health Metr2003,1:4.
29. Lynge E, Sandegaard JL, Rebolj M:The Danish National patient register. Scand J Public Health2011,39:30–33.
30. Helweg-Larsen K:The Danish register of causes of death.Scand J Public Health2011,39:26–29.
31. Begg S, Vos T, Barker B, Stevenson C, Stanley L, Lopez A:The Burden of Disease and Injury in Australia 2003.Canberra: Australian Institute of Health and Welfare; 2007. Ref Type: Report.
32. Morgenstern H, Bursic ES:A method for using epidemiologic data to estimate the potential impact of an intervention on the health status of a target population.J Community Health1982,7:292–309.
33. Barendregt JJ, Veerman JL:Categorical versus continuous risk factors and the calculation of potential impact fractions.J Epidemiol Community Health2010,64:209–212.
34. Roerecke M, Rehm J:Ischemic heart disease mortality and morbidity rates in former drinkers: a meta-analysis.Am J Epidemiol2011,173:245–258. 35. Centers for Disease Control and Prevention:Vital signs: binge drinking
prevalence, frequency, and intensity among adults - United States, 2010. MMWR Morb Mortal Wkly Rep2012,61:14–19.
36. Statistics Denmark:PRIS9: Consumer price index, annual rate of change (inflation) by type; 2013. http://statistikbanken.dk/statbank5a/SelectVarVal/ Define.asp?Maintable=PRIS9&PLanguage=1 2013. Ref Type: Online Source. 37. The Danish Ministry of Taxation:Status Over Grænsehandel [Status Report on
Cross-Boarder Shopping].Copenhagen; 2010. Ref Type: Report.
38. Christensen AI, Ekholm O, Glumer C, Andreasen AH, Hvidberg MF, Kristensen PL,et al:The Danish National Health Survey 2010. Study design and respondent characteristics.Scand J Public Health2012,40:391–397. 39. Danish Health and Medicines Authority:Udmeldinger om Alkohol
[Recommendations regarding alcohol consumption].http://www.sst.dk/ Sundhed%20og%20forebyggelse/Alkohol/UdmeldingerOmAlkohol.aspx. 2012. Ref Type: Online Source.
40. Rehm J, Klotsche J, Patra J:Comparative quantification of alcohol exposure as risk factor for global burden of disease.Int J Methods Psychiatr Res2007,16:66–76.
41. Stockwell T, Donath S, Cooper-Stanbury M, Chikritzhs T, Catalano P, Mateo C:Under-reporting of alcohol consumption in household surveys: a comparison of quantityGÇôfrequency, graduatedGÇôfrequency and recent recall.Addiction2004,99:1024–1033.
42. Rehm J, Kehoe T, Gmel G, Stinson F, Grant B, Gmel G:Statistical modeling of volume of alcohol exposure for epidemiological studies of population health: the US example.Popul Health Metr2010,8:3.
43. ECREPH (The European Centre for Register Based Health Related Population Research):Register Database - Find information on 35 Danish Registers suitable for health related register research.http://www.si-folkesundhed.dk/ Statistik/Registerforskning/Database.aspx?lang=en. 25-8-2011. Ref Type: Online Source.
44. Sahl Andersen J, De Fine ON, Krasnik A:The Danish National Health service register.Scand J Public Health2011,39:34–37.
45. Wallach Kildemoes H, Toft Sørensen H, Hallas J:The Danish national prescription registry.Scand J Public Health2011,39:38–41.
47. World Bank:GDP per capita.http://data.worldbank.org/indicator/NY.GDP. PCAP.CD. 2009. Ref Type: Online Source.
48. Gallet CA:The demand for alcohol: a meta-analysis of elasticities.Aust J Agric Resour Econ2007,51:121–135.
49. Kenkel DS:Are alcohol tax hikes fully passed through to prices? Evidence from Alaska.Am Econ Rev2005,95:273–277.
50. Young DJ:Alcohol taxes and beverage prices.Natl Tax J2002,55:57–73. 51. The Danish Ministry of Taxation:The Taxation Committee 2012–13, Answer to
Question 231 (Decrease of Taxations), Public [Skatteudvalget 2012–13, SAU Alm. del endeligt svar på spørgsmål 231 (vedr. sænkning af skatter og afgifter), Offentligt].The Taxation Committee of the Danish Parliament; 2013. Ref Type: Hearing.
52. Makela P, Bloomfield K, Gustafsson NK, Huhtanen P, Room R:Changes in volume of drinking after changes in alcohol taxes and travellers’ allowances: results from a panel study.Addiction2008,103:181–191. 53. Grittner U, Gustafsson NK, Bloomfield K:Changes in alcohol consumption in
Denmark after the tax reduction on spirits.Eur Addict Res2009,15:216–223. 54. Bloomfield K, Rossow I, Norstrom T:Changes in alcohol-related harm after
alcohol policy changes in Denmark.Eur Addict Res2009,15:224–231. 55. World Health Organization: InMaking choices in health: WHO guide to
cost-effectiveness analysis.Edited by Edejer TT, Baltussen R, Adam T, Hutubessy R, Acharya A, Evans DB,et al. Geneva: World Health Organization; 2003. Ref Type: Report.
56. Chalmers J, Carragher N, Davoren S, O’Brien P:Real or perceived impediments to minimum pricing of alcohol in Australia: public opinion, the industry and the law.Int J Drug Policy2013,24:517–523.
57. Carragher N, Chalmers JJ:What are the options? Pricing and taxation policy reforms to redress excessive alcohol consumption and related harms in Australia.Sydney, NSW: NSW Bureau of Crime Statistics and Research; 2011. 58. Bagnardi V, Zatonski W, Scotti L, La VC, Corrao G:Does drinking pattern
modify the effect of alcohol on the risk of coronary heart disease? Evidence from a meta-analysis.J Epidemiol Community Health2008, 62:615–619.
59. Holmes J, Meier PS, Booth A, Guo Y, Brennan A:The temporal relationship between per capita alcohol consumption and harm: a systematic review of time lag specifications in aggregate time series analyses.Drug Alcohol Depend2012,123:7–14.
60. Laursen B, Helweg-Larsen K:Health service use in adults 20–64 years with traumatic brain injury, spinal cord or pelvic fracture. A cohort study with 9-year follow-up.BMJ Open2012,2:e001521.
61. Anand S, Hanson K:Disability-adjusted life years: a critical review.J Health Econ1997,16:685–702.
62. Murray CJ, Acharya AK:Understanding DALYs.J Health Econ1997,16:703–730. 63. Chisholm D, Doran C, Shibuya K, Rehm J:Comparative cost-effectiveness
of policy instruments for reducing the global burden of alcohol, tobacco and illicit drug use.Drug Alcohol Rev2006,25:553–565.
64. Danish Health and Medicines Authority:Sundhedsdata [Health data].http:// www.sst.dk/Indberetning%20og%20statistik/Sundhedsdata.aspx. 2012. Ref Type: Online Source.
doi:10.1186/1478-7547-12-1
Cite this article as:Holmet al.:Cost-effectiveness of changes in alcohol
taxation in Denmark: a modelling study.Cost Effectiveness and Resource
Allocation201412:1.
Submit your next manuscript to BioMed Central and take full advantage of:
• Convenient online submission
• Thorough peer review
• No space constraints or color figure charges
• Immediate publication on acceptance
• Inclusion in PubMed, CAS, Scopus and Google Scholar
• Research which is freely available for redistribution
![Figure 1 Distribution of the Danish population on alcoholconsumption categories (data from The Danish Health andMorbidity Survey 2010 [38]).](https://thumb-us.123doks.com/thumbv2/123dok_us/590223.1554486/5.595.305.539.535.696/figure-distribution-danish-population-alcoholconsumption-categories-danish-andmorbidity.webp)